

Key Points
A claims-based algorithm was developed to distinguish the clinical profiles of hemophilia B based on the severity of disease presentation.
Total annual health care costs were >25-fold higher among male adults with hemophilia B relative to demographic-matched controls.

Abstract
Hemophilia B is a rare congenital blood disorder characterized by factor IX deficiency. Clinical profiles of hemophilia B range from mild to severe forms of the disease. The objective of this study was to characterize the economic burden associated with differing clinical profiles of hemophilia B from a US health system perspective. Using the IBM MarketScan database (June 2011-February 2019), a claims-based algorithm was developed to identify 4 distinct profiles (mild, moderate, moderate-severe, and severe) in adult males with hemophilia B based on the frequency of hemorrhage events and factor IX replacement claims. Mean annual health care resource use (HRU) and costs were statistically compared between patients with hemophilia B (N = 454) and 1:1 demographic-matched controls (N = 454), both overall and with stratification by clinical profile. Compared with matched controls, patients with hemophilia B had a significantly higher comorbidity burden (Charlson Comorbidity Index, mean ± standard deviation [SD]: 0.9 ± 1.7 vs 0.3 ± 0.9, P < .001). Across all clinical profiles, patients with hemophilia B had significantly higher HRU vs matched controls (mean ± SD: 0.3 ± 0.6 vs 0.1 ± 0.3 inpatient admissions; 0.6 ± 1.2 vs 0.2 ± 0.6 emergency department visits; 17.7 ± 22.9 vs 8.0 ± 11.0 outpatient visits; all P < .001). Annual total health care costs per patient among patients with hemophilia B were more than 25-fold higher vs matched controls (mean ± SD: $201 635 ± $411 530 vs $7879 ± $29 040, respectively, P < .001). Annual total health care costs per patient increased with increasing severity (mean ± SD: mild, $80 811 ± $284 313; moderate, $137 455 ± $222 021; moderate-severe, $251 619 ± $576 886; severe, $632 088 ± $501 270). The findings of this study highlight the substantial burden of illness associated with hemophilia B.
Introduction
Hemophilia B is a rare, X-linked genetic disorder. The number of people living with hemophilia B worldwide is >30 000 and in the United States alone is >6000.1,2 Approximately 5 in 100 000 male newborns worldwide have hemophilia B.3 The disorder is characterized by abnormally low levels of coagulation factor IX (FIX).4,5 The severity of hemophilia B varies based on the FIX activity level and is commonly classified as mild (>5%-40%), moderate (1%-5%), or severe (<1%).6 Patients with mild to moderate forms of hemophilia B may experience bleeding episodes following trauma, whereas those with severe forms are at risk of spontaneous bleeding into muscles and/or joints, which can result in disabling and painful arthropathy and significant affect quality of life.7,8 Clinical management strategies for hemophilia B consist of FIX replacement therapy administered as needed (ie, episodic or on-demand) following a bleeding episode or regularly (ie, prophylactically) to help prevent bleeding and ensuing complications.5,9
Although hemophilia B is a rare disorder, it is associated with a substantial economic and societal burden.10-17 Direct costs include medications, physician visits, hospitalizations, procedures (ie, medical, surgical), and laboratory assessments, whereas indirect costs include decreases in productivity, increases in absenteeism, and disability resulting from complications such as recurrent bleeding and joint damage.10,11,13 Health care costs may be particularly high among patients with severe hemophilia because of the high costs of prophylactic treatment, as well as the costs of bleeding events requiring medical intervention.10,18 To date, a limited number of studies have investigated the economic burden associated with hemophilia B in the United States14,16,19-21 ; however, those studies were based on relatively small sample sizes and were restricted to patients treated with FIX replacement therapy.14,16,19-21 Additionally, previous estimates of hemophilia B–related health care costs have generally focused on all patients without differentiation by disease severity16,19 or patients receiving extended half-life (EHL) or standard half-life (SHL) FIX treatments.14 There is limited information available on the health care resource utilization (HRU) and costs associated with different disease severity levels11 or clinical profiles of hemophilia B.
The goal of this study was to assess the burden of illness in adults with hemophilia B, both overall and by severity of the clinical profile, from a US health system perspective. Because there are no diagnosis codes distinguishing the clinical disease severity of hemophilia B (ie, as defined by basal FIX activity), it is not possible to directly identify patients’ disease severity levels based on their insurance claims. We therefore constructed an insurance database algorithm to identify distinct clinical profiles (claims-based proxies for clinical disease severity levels) and quantified incremental HRU and health care costs by clinical profile of hemophilia B.
Methods
Data source
This study used data from the IBM MarketScan Commercial Claims and Encounters Database (June 2011-February 2019), which captures the medical experience of insured enrollees that include active employees, dependents, early retirees, and beneficiaries covered by the Consolidated Omnibus Budget Reconciliation Act. The database includes enrollment history and claims for medical (provider and institutional) and outpatient pharmacy services for ∼90 million unique enrollees across more than 160 contributing employers and 40 contributing health plans over the timeframe of this study. All US census regions are included, with a predominance in the South and North Central (Midwest). All data in this study are deidentified and fully compliant with the Health Insurance Portability and Accountability Act. Institutional review was not required for this study.
Study population
Patients in the hemophilia B cohort included male enrollees with at least 2 International Classification of Disease Ninth/Tenth Revision, Clinical Modification (ICD-9/10-CM) diagnosis codes on separate dates that included hemophilia B (ICD-9-CM: 286.1; ICD-10-CM: D67). The dates of all medical visits associated with a hemophilia B diagnosis were considered as potential index dates and were further refined to include only those that allowed for continuous enrollment for ≥1 year before (baseline period) and ≥1 year after (study period) the index date. For patients with multiple potential index dates meeting the criteria for continuous enrollment, 1 date was randomly selected as the patient’s index date.
After identifying patients with hemophilia B, a matched control sample of enrollees without a diagnosis for hemophilia B, hemophilia A, or any other coagulation disorders (eg, von Willebrand disease) was generated. Diagnosis codes for coagulation disorders are provided in supplemental Table 1. Patients in the hemophilia B cohort were matched 1:1 with the control sample based on age at index date, insurance type, geographic region, and year of index date. Index dates for controls were selected to meet the same continuous enrollment criteria used for patients in the hemophilia B cohort.
Clinical profile algorithm development
The clinical profile of hemophilia B was categorized as mild, moderate, moderate-severe, or severe using a claims-based algorithm informed by literature and expert opinion (Figure 1). To distinguish mild from moderate to severe profiles, the algorithm used in this study considered the frequency of FIX replacement claims because prophylaxis is considered the optimal therapeutic approach for patients with moderate to severe hemophilia B.22,23 Real-world uptake fell short of this recommendation as of a 2014-2017 registry study, particularly among patients with moderate hemophilia B (of whom only 15.6% received continuous prophylaxis)2 ; however, continuous prophylaxis was reported as the most common treatment modality (69.0%) in patients with severe hemophilia B.2 Its use has also increased since the approval of the first EHL products in 2014.24 For each patient in the study sample, claims for FIX replacement therapy occurring on distinct dates were counted during the baseline period using both pharmacy and medical procedure claims. In addition, the number of hemorrhage events during the baseline period was used as a proxy for the severity of bleeding based on previous studies7,25 that have cited a correlation between the severity of bleeding and levels of endogenous clotting factors in the clinical classification of hemophilia severity. Based on these indicators, the categories of clinical profiles included mild (no FIX claims or hemorrhage); moderate (1-3 FIX claims/year and no hemorrhage); moderate-severe (4-5 FIX claims/year, or ≤3 FIX claims/year and ≥1 hemorrhage/year); and severe (≥6 FIX claims/year). Supplemental Table 2 lists codes used in the algorithm to identify clinical profiles of hemophilia B, including pharmacy and procedure codes for FIX replacement therapy and diagnosis codes for hemorrhage events.

Algorithm for clinical profile. The algorithm to identify clinical profiles of hemophilia B was applied to patients with ≥2 claims associated with a hemophilia B diagnosis occurring on distinct dates.
Algorithm for clinical profile. The algorithm to identify clinical profiles of hemophilia B was applied to patients with ≥2 claims associated with a hemophilia B diagnosis occurring on distinct dates.
Study covariates and outcomes
Baseline characteristics.
Baseline characteristics were compared between patients with hemophilia B vs matched controls overall and stratified by clinical profile. Characteristics evaluated included demographics (ie, age at index date, geographic region, insurance plan type), index year, prescription medication use (ie, pain medication, antidepressants, and antianxiety medications), comorbidity profile, including the Charlson Comorbidity Index26 and comorbidities associated with hemophilia (eg, HIV/AIDS, hepatitis B, hepatitis C), baseline HRU and costs, number of bleeding events, and presence of joint-related problems during the baseline period. Supplemental Tables 3 and 4 list diagnosis and pharmacy codes used to measure baseline characteristics.
HRU and costs.
HRU and costs were compared between patients with hemophilia B and matched controls overall and by clinical profile. HRU quantified during the study period included inpatient admissions, emergency department visits, outpatient visits, specialist visits (eg, hematologists, orthopedists, psychologists/psychiatrists), and use of opioid medications. Specialist visits were identified based on provider type or Current Procedural Terminology code reported on a claim. Total health care costs, pharmacy costs (including hemophilia-related treatment, pain medication, antidepressants/antianxiety medications, and other prescription drugs), medical costs (including inpatient costs, emergency department costs, and outpatient costs) were also assessed during the study period. Hemophilia-related treatment costs included FIX replacement and costs of bypassing agents (supplemental Table 4). Costs were converted from their original reporting year to 2019 values using the health component of the Personal Consumption Expenditure Price Index, consistent with best-practice recommendations for the inflation of medical expenditures.27,28 Hemophilia-related HRU and costs, defined as claims with a diagnosis of hemophilia B, were also estimated.
Statistical analyses
Summary statistics for baseline characteristics, HRU, and cost outcomes included means and standard deviations (SDs) for continuous variables and counts and percentages for categorical variables. Statistical comparisons between patients with hemophilia B and matched controls were conducted using Wilcoxon signed-rank tests for continuous variables and McNemar test for categorical variables. All analyses were performed using SAS Enterprise Guide software (version 7.15; SAS Institute Inc., Cary, NC).
Results
Patient characteristics
A total of 454 adult male patients were identified with at least 2 diagnoses of hemophilia B on separate days and continuous enrollment for at least 1 year before and 1 year after the index date (Figure 2). The distributions of demographic factors used for matching were well balanced between patients with hemophilia B and matched controls (Table 1 [overall] and supplemental Table 5 [by clinical profile]). On average, patients with hemophilia B had a significantly higher comorbidity burden compared with matched controls (Charlson Comorbidity Index, mean ± SD: 0.9 ± 1.7 vs 0.3 ± 0.9, P < .001).
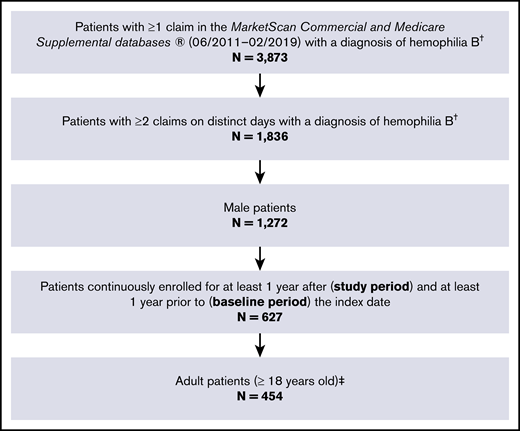
Sample selection flowchart. †Hemophilia B was identified using ICD-9-CM code 286.1 or ICD-10-CM code D67. ‡Patients with hemophilia B were matched 1:1 to control enrollees without hemophilia or other coagulation disorders (N = 454).
Sample selection flowchart. †Hemophilia B was identified using ICD-9-CM code 286.1 or ICD-10-CM code D67. ‡Patients with hemophilia B were matched 1:1 to control enrollees without hemophilia or other coagulation disorders (N = 454).
Baseline characteristics
| Patient characteristics | Patients with hemophilia B (N = 454) | Controls (N = 454) | P* |
|---|---|---|---|
| Demographics | |||
| Age, mean (SD), y | 46.0 (18.4) | 46.0 (18.4) | 1.000 |
| Geographic region, n (%) | 1.000 | ||
| North central | 132 (29.1) | 132 (29.1) | |
| Northeast | 90 (19.8) | 90 (19.8) | |
| South | 163 (35.9) | 163 (35.9) | |
| West | 69 (15.2) | 69 (15.2) | |
| Insurance type, n (%) | 1.000 | ||
| Comprehensive | 33 (7.3) | 33 (7.3) | |
| Preferred provider organization | 276 (60.8) | 276 (60.8) | |
| Capitated | 50 (11.0) | 50 (11.0) | |
| Other | 95 (20.9) | 95 (20.9) | |
| Index year, n (%) | 1.000 | ||
| 2012-2013 | 184 (40.5) | 184 (40.5) | |
| 2014-2015 | 131 (28.9) | 131 (28.9) | |
| 2016-2018 | 139 (30.6) | 139 (30.6) | |
| Comorbidities | |||
| Charlson Comorbidity Index, mean (SD) | 0.9 (1.7) | 0.3 (0.9) | <.001† |
| Hemophilia-related comorbidities, n (%) | |||
| HIV/AIDS | 17 (3.7) | 1 (0.2) | <.001† |
| Hepatitis B | 7 (1.5) | 0 (0.0) | .008† |
| Hepatitis C | 76 (16.7) | 2 (0.4) | <.001† |
| Prescription medication use, n (%) | |||
| Pain medication | 201 (44.3) | 130 (28.6) | <.001† |
| Antidepressant or antianxiety | 78 (17.2) | 50 (11.0) | .008† |
| Number of bleeding events, mean (SD) | |||
| Hemarthrosis | 0.10 (0.77) | 0.002 (0.05) | <.001† |
| Hemorrhages | 0.23 (0.84) | 0.03 (0.26) | <.001† |
| Joint effusions | 0.08 (0.54) | 0.02 (0.21) | .002† |
| Contusions | 0.11 (0.41) | 0.03 (0.19) | <.001† |
| Joint-related problems, n (%) | |||
| Joint pain | 111 (24.4) | 54 (11.9) | <.001† |
| Stiff joints | 11 (2.4) | 0 (0.0) | <.001† |
| Difficulty walking | 5 (1.1) | 1 (0.2) | .102 |
| Osteoarthritis | 67 (14.8) | 30 (6.6) | <.001† |
| Arthropathy | 17 (3.7) | 0 (0.0) | <.001† |
McNemar's tests were used for comparisons of categorical variables and Wilcoxon signed-rank tests were used for comparisons of continuous variables.
Indicates statistical significance (P < .05).
During the baseline period, a greater proportion of patients with hemophilia B received prescription pain medication (44.3% vs 28.6%, P < .001) and antidepressant/antianxiety medications (17.2% vs 11.0%, P = .008) compared with matched controls. The mean number of hemorrhages per year was significantly higher among patients with hemophilia B relative to controls (mean ± SD: 0.23 ± 0.84 vs 0.03 ± 0.26, P < .001). The proportions of patients with joint pain (24% vs 12%, P < .001) and osteoarthritis (15% vs 7%, P < .001) were approximately twice as high among patients with hemophilia B compared with matched controls.
Health care resource use
On average, patients with hemophilia B had significantly more inpatient admissions (mean ± SD: 0.3 ± 0.6 vs 0.1 ± 0.3, P < .001), emergency department visits (0.6 ± 1.2 vs 0.2 ± 0.6, P < .001), and outpatient visits (17.7 ± 22.9 vs 8.0 ± 11.0, P < .001) compared with matched controls (Table 2). Patients with hemophilia B also had significantly more frequent specialist visits than matched controls over the 1-year study period, particularly hematologist visits (mean ± SD: 2.1 ± 3.4 vs 0.2 ± 1.6, P < .001) and orthopedist visits (2.4 ± 6.3 vs 1.2 ± 4.6, P < .001). Use of prescribed opioids was significantly higher among patients with hemophilia B than matched controls (number of prescriptions, mean ± SD: 1.8 ± 4.7 vs 0.7 ± 2.2, P < .001), with patients in the severe cohort receiving on average a 2-month supply of opioid medications per year.
Annual health care resource utilization
| Health care resource utilization | Patients with hemophilia B (N = 454) | Controls (N = 454) | P* |
|---|---|---|---|
| Inpatient admissions | |||
| Occurrence of ≥1 admission, n (%) | 87 (19.2) | 26 (5.7) | <.001† |
| Number of admissions, mean (SD) | 0.3 (0.6) | 0.1 (0.3) | <.001† |
| Days of hospitalization, mean (SD) | 1.2 (3.7) | 0.3 (1.5) | <.001† |
| Emergency department visits | |||
| Occurrence of ≥1 admission, n (%) | 133 (29.3) | 64 (14.1) | <.001† |
| Number of admissions, mean (SD) | 0.6 (1.2) | 0.2 (0.6) | <.001† |
| Outpatient visits | |||
| Occurrence of ≥1 visit, n (%) | 454 (100.0) | 366 (80.6) | <.001† |
| Number of visits, mean (SD) | 17.7 (22.9) | 8.0 (11.0) | <.001† |
| Specialist visits | |||
| Hematologists | |||
| Occurrence of ≥1 visit, n (%) | 289 (63.7) | 34 (7.5) | <.001† |
| Number of visits, mean (SD) | 2.1 (3.4) | 0.2 (1.6) | <.001† |
| Orthopedists | |||
| Occurrence of ≥1 visit, n (%) | 151 (33.3) | 81 (17.8) | <.001† |
| Number of visits, mean (SD) | 2.4 (6.3) | 1.2 (4.6) | <.001† |
| Psychologists/psychiatrists | |||
| Occurrence of ≥1 visit, n (%) | 45 (9.9) | 21 (4.6) | .002† |
| Number of visits, mean (SD) | 0.6 (3.1) | 0.6 (4.2) | .054† |
| Prescribed opioids | |||
| Occurrence of ≥1 prescription, n (%) | 185 (40.7) | 102 (22.5) | <.001† |
| Number of prescriptions, mean (SD) | 1.8 (4.7) | 0.7 (2.2) | <.001† |
| Days of supply, mean (SD) | 35.2 (114.1) | 9.9 (39.1) | <.001† |
McNemar's tests were used for comparisons of categorical variables and Wilcoxon signed-rank tests were used for comparisons of continuous variables.
Indicates statistical significance (P < .05).
Across all clinical profiles, patients with hemophilia B had more than twice as many inpatient admissions, emergency department visits, and outpatient visits as matched controls, with patients in the severe and moderate-severe cohorts averaging >20 outpatient visits over the 1-year study period (supplemental Table 6). Among patients with hemophilia B, the majority of hospitalizations were hemophilia-related based on diagnosis codes, and over 80% of patients with hospitalizations had at least 1 hospitalization related to hemophilia during the 1-year study period. Additionally, 95.2% of patients with hemophilia B had at least 1 hemophilia-related outpatient visit (supplemental Table 7).
Health care costs
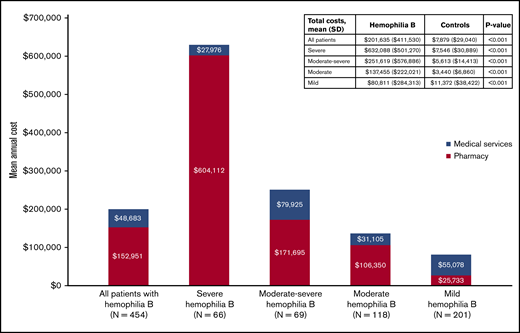
The mean total costs incurred by patients with hemophilia B over the study period were $201 635 (mean ± SD: $201 635 ± $411 530 vs $7879 ± $29 040 for matched controls, P < .001; Figure 3). Health care costs were significantly greater among patients with hemophilia B than matched controls across every cost category examined (all P < .05) (supplemental Table 8 [overall]). Similarly, across all clinical profiles, all-cause total costs, medical costs, and pharmacy costs were significantly higher among patients with hemophilia B than matched controls (Figure 3; supplemental Table 9 [by clinical profile]; all P < .001). Annual total health care costs increased with increasing severity of hemophilia B clinical profiles, ranging from $80 811 ± $284 313 and $137 455 ± $222 021 in the mild and moderate cohorts to $251 619 ± $576 886 and $632 088 ± $501 270 in the moderate-severe and severe cohorts.
Discussion
In this retrospective cohort study, HRU and costs were compared among adult males with hemophilia B relative to matched controls from a US health system perspective. Using a claims-based algorithm informed by literature and clinical expert opinion, the burden of hemophilia B was examined across 4 clinical profiles that included mild, moderate, moderate-severe, and severe presentations of the disease. The total annual health care costs were >25-fold higher in the overall sample of patients with hemophilia B relative to demographic-matched controls, ranging from $80 811 to $137 455 in the mild and moderate cohorts to $251 619 to $632 088 in the moderate-severe and severe cohorts. Relative to controls, patients with mild hemophilia B had sevenfold higher total health care costs, whereas those with severe clinical profiles had 84-fold higher costs. Across all clinical profiles, patients with hemophilia B had significantly higher resource use, and higher medical, pharmacy, and total costs compared with matched controls. Taken together, the results of this study highlight the substantial economic burden of hemophilia B, as well as the considerable heterogeneity of health care costs among patients with hemophilia B.
The economic burden of hemophilia B measured in the present study is within the range reported by previous studies.11,14-16,19-21 Previous claims-based estimates of average annual health care costs in hemophilia B range from $113 223 (2008 USD) in Guh et al (2012)20 to $242 276 (2013 USD) in Eldar-Lissai et al (2015).16 All else being equal, the inclusion of pediatric patients in prior cost-of-illness studies in hemophilia B14,16,19,20 would tend to reduce cost estimates, given the weight-based dosing of FIX replacement therapy. However, prior studies have also generally been restricted to patients with FIX replacement therapy claim(s),14,16,19,20 likely resulting in higher cost estimates due to the underrepresentation of mild hemophilia B cases. For example, the study by Eldar-Lissai et al included pediatric patients but nevertheless estimated high mean annual costs ($242 276 [2013 USD] vs $201 635 [2019 USD] in the present study) because of the requirement of ≥2 pharmacy claims for factor replacement within 3 months.16 Although no prior estimates are available for direct comparison regarding the costs of hemophilia B by clinical presentation, a 2018 claims-based study by Tortella et al used the National Specialty Pharmacy Database to estimate treatment costs (in 2015 USD) among patients with hemophilia B receiving prophylactic treatment with EHL and SHL FIX products.14 The annual costs of hemophilia-related treatments among patients on prophylactic EHL ($58 469 monthly; $701 628 annualized) and SHL treatments ($48 631 monthly; $583 572 annualized)14 were similar in magnitude to the hemophilia-related treatment costs measured among patients with severe clinical profiles in the present study ($596 541). A prospective study by Chen et al published in 2017 used data from 10 hemophilia treatment centers to estimate HRU and costs among pediatric (N = 62) and adult (N = 50) patients with hemophilia B by disease severity defined according to clotting factor level.11 Annual direct health care costs were significantly higher among patients with severe hemophilia B than those with mild/moderate disease ($190 312 vs $51 435; P < .0001), and comprised primarily hemophilia-related treatment costs (representing 98% of health care costs in the overall sample).11 Average annual health care costs reported by Chen et al (overall: $133 894)11 were low relative to the present study (overall: $201 635). The relatively low cost estimated by Chen et al may reflect the inclusion of pediatric patients combined with the approach of approximating health care costs based on HRU abstracted from clinical charts, which do not capture all HRU occurring outside of hemophilia treatment centers and their associated health care system(s).
The present study extends the existing body of literature by examining HRU and costs across 4 distinct clinical profiles of hemophilia B within a large population of adult patients in the United States. Overall, the total health care costs increased with increasingly severe clinical profiles. Hemophilia-related treatments represented the primary cost driver, particularly among patients with more severe clinical profiles, who were more likely to be on prophylaxis because it is considered the most appropriate therapy for moderate to severe hemophilia.25,29,30 The benefits associated with prophylaxis in improving patients’ health-related quality of life and clinical outcomes by mitigating bleeding into joints and the irreversible joint damage that can result have been reported previously.25,31 However, the need for frequent infusions limits the effectiveness of FIX prophylaxis, especially when dosing frequency affects adherence to the prophylaxis regimen.12,32
Although prophylaxis is the standard of care in reducing joint bleeds and mitigating further joint damage, pain management may be necessary for patients with existing joint damage. More than 50% of patients with severe clinical profiles have reported disabling pain in 1 or more joints.33 Joint pain may be acute because of acute bleeds or chronic because of arthropathy or other long-term complications associated with hemophilia.34 Among the armamentarium of pharmacological agents, opioids may be required to manage chronic pain for patients with severe hemophilia, particularly given that nonselective nonsteroidal anti-inflammatory drugs are relatively contraindicated in persons with bleeding conditions.35 In the current study, prescribed opioids were significantly higher among patients with hemophilia compared with matched controls. This aligns with previous studies reporting high opioid use among patients with hemophilia.35-37 In a prospective, computer-based survey study published in 2011 that assessed pain experienced by patients with bleeding disorders, ∼35% of patients with hemophilia reported opioid use for pain management.37 However, despite the high usage of opioids, patients with hemophilia have reported reduced quality-of-life scores related to pain and reported that pain was not well treated.35 Furthermore, as is true for all populations, concerns persist regarding opioid-related deaths and the risk of dependency or addiction among patients with chronic pain.38-40
Although the clinical and economic burden associated with hemophilia is high, efforts to reduce the disease burden are under way. To this end, this study provides a valuable characterization of the burden of illness associated with hemophilia B that can serve as a benchmark for future studies. An important strength of the current study is the use of a large-scale administrative claims database that spanned multiple years, which provided a robust patient population for analysis. To the best of our knowledge, this is the first study to develop an algorithm to identify clinical profiles of hemophilia B using indicators that are readily available in administrative claims data, and to examine HRU and costs stratified by clinical profile. The claims-based algorithm developed in the present study may support opportunities to expand potential uses of existing claims databases to understand the burden of disease and unmet medical needs among patients with hemophilia B from a health system perspective. Moreover, results from this study could provide useful inputs for cost-effectiveness analyses in hemophilia B to account for potential cost-offset associated with novel treatment options such as gene therapy.41-43
Limitations
This study should be considered within the context of specific limitations. First, in the absence of laboratory data integrated with the administrative claims data, it was not feasible to formally validate the claims-based algorithm to identify clinical profile against clotting factor level. Although the indicators used in the algorithm (ie, FIX claims and hemorrhage events) were selected based on prior evidence of their associations with clinical severity, some misclassification is expected. For example, in the 2014-2017 Community Counts Registry for Bleeding Disorders Surveillance, patients with mild and moderate hemophilia B comprised, respectively, 3.4% and 17.2%, of all those receiving continuous prophylaxis2 ; such patients would be misclassified as severe under the present claims-based algorithm. Second, the administrative claims database used in this study could only capture clinical events that resulted in medical service use. As a result, bleeding events that were treated and resolved by FIX infusion at home were almost certainly underrepresented. To address this limitation, the claims-based algorithm to identify hemophilia B clinical profile incorporated use of factor replacement therapy in addition to bleeding events. Third, to minimize the potential for false-positives resulting from incorrectly recorded diagnoses, this study required patients to have 2 diagnoses for hemophilia B occurring on separate dates. This approach may exclude some patients with very mild profiles of hemophilia B who did not have at least 2 recorded diagnoses of hemophilia B over their entire claims history. To mitigate this concern, this study also required ≥2 years of enrollment in the database (ie, including the 1-year baseline and 1-year study periods) because it was expected that the large majority of patients with hemophilia B would have diagnoses of hemophilia B recorded during routine or acute medical encounters over a ≥2-year period. Fourth, despite its size, the MarketScan database is not representative of the entire US private insurance market or general population, which may affect the generalizability of the study results. The cost of illness may differ in populations that are publically insured, who comprise 35.8% of patients with hemophilia B (and 75.5% of those aged ≥65 years) according to a 2014-2017 registry report.2 Nevertheless, key baseline characteristics of patients with hemophilia B in the current study (including the prevalence of HIV/AIDS and hepatitis C) closely aligned with those reported by the Centers for Disease Control and Prevention for this patient population.44
Conclusions
Overall, this study found that there is a considerable burden of illness in adults with hemophilia B from a US health system perspective. Using a claims-based algorithm, this study identified 4 distinct clinical profiles of hemophilia B, including mild, moderate, moderate-severe, and severe presentations of the disease. Hemophilia-related treatments represented the primary cost driver. HRU was uniformly higher among patients with hemophilia B across clinical profiles, medical service types examined, and with respect to opioid use. The significant burden highlights that unmet needs remain in hemophilia B.
The data used in this study are not publicly available because of a licensing agreement with IBM MarketScan.
Acknowledgments
Editorial assistance in the preparation of this article was provided by Gloria DeWalt, an employee of Analysis Group, Inc. Analytical support was provided by Eli Orvis, who was an employee of Analysis Group, Inc., when the research was conducted. Support for this assistance was provided by uniQure, Inc.
This study was supported by uniQure, Inc.
Authorship
Contribution: All authors designed the study; I.B., K.H., A.G.B., and H.Y. undertook formal analysis; and all authors interpreted the data, drafted the manuscript, and approved the final manuscript.
Conflict-of-interest disclosure: T.W.B. has received honoraria or fees for serving on advisory boards or as a consultant for uniQure, Inc. I.B., K.H., A.G.B., H.Y., and E.Q.W. are employees of Analysis Group, Inc., which received consulting fees from uniQure, Inc., to conduct this study. E.K.S. and N.L. are employees of, and own stock in, uniQure, Inc.
Correspondence: Nanxin Li, uniQure, Inc., 113 Hartwell Ave, Lexington, MA 02421; e-mail: n.li@uniqure.com.

