

Key Points
Most children with de novo AML experience complete hematologic remission when treated with minimally myelosuppressive therapy plus G-CSF.
Reduced-intensity induction decreases toxicity without adversely affecting the long-term outcomes in children with newly diagnosed AML.

Abstract
Treatment refusal and death as a result of toxicity account for most treatment failures among children with acute myeloid leukemia (AML) in resource-constrained settings. We recently reported the results of treating children with AML with a combination of low-dose cytarabine and mitoxantrone or omacetaxine mepesuccinate with concurrent granulocyte colony-stimulating factor (G-CSF) (low-dose chemotherapy [LDC]) for remission induction followed by standard postremission strategies. We have now expanded the initial cohort and have provided long-term follow-up. Eighty-three patients with AML were treated with the LDC regimen. During the study period, another 100 children with AML received a standard-dose chemotherapy (SDC) regimen. Complete remission was attained in 88.8% and 86.4% of patients after induction in the LDC and SDC groups, respectively (P = .436). Twenty-two patients in the LDC group received SDC for the second induction course. Significantly more high-risk AML patients were treated with the SDC regimen (P = .035). There were no significant differences between the LDC and SDC groups in 5-year event-free survival (61.4% ± 8.7% vs 65.2% ± 7.4%, respectively; P = .462), overall survival (72.7% ± 6.9% vs 72.5% ± 6.2%, respectively; P = .933), and incidence of relapse (20.5% ± 4.5% vs 17.6% ± 3.9%, respectively; P = .484). Clearance of mutations based on the average variant allele frequency at complete remission in the LDC and SDC groups was 1.9% vs 0.6% (P < .001) after induction I and 0.17% vs 0.078% (P = .052) after induction II. In conclusion, our study corroborated the high remission rate reported for children with AML who received at least 1 course of LDC. The results, although preliminary, also suggest that long-term survival of these children is comparable to that of children who receive SDC regimens.
Introduction
Acute myeloid leukemia (AML) comprises a heterogeneous group of disorders accounting for 15% to 20% of childhood leukemia.1 Genetic classification of AML has enabled risk-adapted therapy for adult and pediatric disease.2-4 Treatments for most pediatric AML consist of very intensive chemotherapy for remission induction followed by intensive chemotherapy and/or hematopoietic stem cell transplantation (HSCT).5 Progress in supportive care has reduced early death rates and overall treatment-related mortality (TRM).6,7 However, concerns have been raised about the late effects of intensive chemotherapy in long-term survivors.8 Moreover, despite the increasing intensity of chemotherapy, optimal supportive care, and unlimited access to HSCT, overall survival (OS) has stagnated at approximately 75% in high-income countries.9-12 In low- to middle-income countries (LMICs), intensified treatment has not been associated with improved survival rates in patients with pediatric AML.13,14 The dismal OS rates for AML in LMICs result from a combination of determinants, including AML biology, deficient supportive care, and therapy abandonment.15-19
Until recently, approximately half of Chinese families of children with AML did not initiate treatment or abandoned it. Although caregivers of Chinese children with AML are initially encouraged by the cure rates obtained with intensive therapy and HSCT, the financial burden and the potential for early and long-term toxicities are substantial obstacles that may discourage these families from initiating or completing treatment.19 Because treatment-related complications and treatment abandonment or refusal are more common in the early phases of AML treatment, we reasoned that decreasing the intensity of induction could reduce early treatment complications, increase treatment adherence, and allow families time to address the potential financial burden.20
We recently analyzed the short-term outcomes of 46 children with de novo AML treated with low-dose chemotherapy (LDC).20 The remission rate in children treated with LDC was comparable to that in children treated with standard-dose chemotherapy (SDC) at the same institution. However, the impact on long-term outcomes of using LDC to induce remission remained uncertain. We have now accrued an additional 37 children with AML treated with LDC, and we focus our analysis on the long-term outcomes of the entire cohort.
Patients and methods
Patients
Children younger than 15 years with de novo AML, as defined by the World Health Organization (WHO) criteria, participated in this observational study. Patients were treated with either LDC or SDC for the first induction course. Allocation to LDC was based on the presence of comorbidities (active infection) or a high risk of treatment abandonment for socioeconomic reasons. Because of concerns that granulocyte colony-stimulating factor (G-CSF) might stimulate leukemia cells, patients who presented with white blood cell (WBC) counts of ≥50 × 109/L did not receive LDC. Subsequently, because G-CSF proved to be well tolerated and did not increase WBC counts, patients who presented with WBC counts of ≥50 × 109/L received LDC if their WBC counts decreased to <50 × 109/L after cytoreductive therapy. Patients with acute promyelocytic leukemia, AML evolving from myelodysplastic syndrome, treatment-related AML, or myeloid neoplasms associated with Down syndrome were not included in the analysis. The study was approved by the ethics committee of the Children’s Hospital of Soochow University. Informed consent was obtained from parents or legal guardians.
Response evaluation and risk classification
Treatment response was evaluated on day 26 of each cycle of induction chemotherapy. Complete remission (CR) was defined as WBC count ≥1.0 × 10⁹/L, absolute neutrophil count ≥0.5 × 10⁹/L, platelet count ≥50 × 109/L, and bone marrow showing <5% leukemia cells by morphologic assessment. Partial remission (PR) was defined as >5% but <20% leukemia cells, and nonresponse (NR) was defined as ≥20% leukemia cells in the bone marrow or the presence of extramedullary leukemia. Relapse was defined as ≥5% leukemia cells in the bone marrow or evidence of extramedullary leukemia.
AML was provisionally classified into low-, intermediate-, and high-risk categories according to the criteria shown in supplemental Table 1. Definitive AML risk classification required morphologic evaluation of the bone marrow after 2 cycles of induction therapy. Patients who experienced CR retained the same initial risk classification, whereas patients who did not meet the CR criteria were reclassified as high-risk patients (supplemental Table 2).
Genomic analysis and clearance of clonal mutated variants
Bone marrow samples obtained at diagnosis and after induction I and induction II were analyzed by whole-exome sequencing. T cells isolated by flow cytometry from remission bone marrow samples served as a germline control. Genomic DNA was analyzed by standard techniques.21-25
Treatment plan, supportive care, and toxicity monitoring
Details regarding treatment are provided in Table 1. Candidates for HSCT usually received it after the first consolidation course. LDC recipients who were classified as nonresponders to induction I received the SDC regimen for induction II but were included in the LDC group for analysis.
Children’s Hospital of Soochow University pediatric AML chemotherapy regimens
| Drug | Dose | Schedule | Days | |
|---|---|---|---|---|
| Induction | ||||
| LDC | Cytarabine | 10 mg/m2 | Every 12 h, subcutaneous | 1-10 |
| Omacetaxine mepesuccinate* or mitoxantrone | 1 mg/m2 | Once per day, IV | 1-7 | |
| 5 mg/m2 | Once per day, IV | 1, 3, 5 | ||
| G-CSF | 5 µg/kg | Once per day, subcutaneous | 1-10 | |
| SDC | Cytarabine | 100 mg/m2 | Every 12 h, IV | 1-10 |
| Etoposide | 100 mg/m2 | Once per day, IV | 1-5 | |
| Omacetaxine mepesuccinate* or daunorubicin | 3 mg/m2 | Once per day, IV | 1-7 | |
| 50 mg/m2 | Once per day, IV | 2, 4, 6 | ||
| Postremission consolidation | ||||
| I | Cytarabine | 2 g/m2 | Every 12 h, IV | 1-3 |
| Mitoxantrone | 10 mg/m2 | Once per day, IV | 3-5 | |
| II | Cytarabine | 3 g/m2 | Every 12 h, IV | 1-3 |
| Etoposide | 150 mg/m2 | Once per day, IV | 1-3 | |
| III | Cytarabine | 3 g/m2 | Every 12 h, IV | 1, 2, 8, 9 |
| L-asparaginase | 6000 U/m2 | Once per day, intramuscular | 3, 10 | |
| IV | Cytarabine | 2 g/m2 | Once per day, IV | 1-5 |
| Fludarabine | 30 mg/m2 | Once per day, IV | 1-5 | |
| G-CSF | 300 µg/m2 | Once per day, subcutaneous | 0-5 |
Mitoxantrone (n = 59) and daunorubicin (n = 81) were substituted for omacetaxine mepesuccinate in the LDC group (n = 24) and in the SDC group (n = 19).
Patients who presented with WBC counts of ≥50 × 109/L received cytoreductive therapy before starting remission induction. Options for cytoreductive therapy included cytarabine, hydroxyurea, and leukapheresis. Prophylactic antibiotics were not used, and fluconazole was used prophylactically when the absolute neutrophil count was <0.5 × 10⁹/L. Measures for managing febrile neutropenia were based on the guidelines of the Infectious Diseases Society of America and the European Conference on Infections in Leukemia.26,27 Treatment-related toxicity and other adverse events were evaluated after each treatment course and were graded using Common Terminology Criteria for Adverse Events (CTCAE) version 5.0.
Definitions
Events were refractory disease, leukemia relapse, death as a result of any cause, abandonment of treatment, or secondary malignancy. Surviving patients who did not experience CR after induction II were considered to have refractory disease. Abandonment was defined as refusal to continue treatment before finishing at least 2 consolidation courses and was considered an event. Patients were followed until death or until the date of last contact. The database as of January 2020 was used for analysis.
Statistical analysis
OS and event-free survival (EFS) were calculated from the date of diagnosis. Cumulative incidence of relapse (CIR) was estimated by the Kalbfleisch-Prentice method, accounting for competing risk. Gray’s test and the Fine-Gray regression model were applied to compare the CIRs in both groups. Fisher’s exact test and Monte Carlo analysis were used to compare categorical variables between 2 or more groups. The Mann-Whitney U test and Kruskal-Wallis H test were used to compare continuous variables between 2 or 3 groups. The risk group was used in survival analyses as a stratification factor or covariate. Kaplan-Meier analysis was used to estimate survival functions. The stratified log-rank test and the Cox regression model were applied to compare OS and EFS in the LDC and SDC groups. In light of the strong relation and overlap between the major outcomes (OS, EFS, and CIR), variables with P < .1 in univariable analysis were examined by the multivariable Cox regression method. All tests were two-sided. P values of < .05 were considered to indicate significance.
Results
Patient characteristics
From July 2012 to March 2018, 183 children (age younger than 15 years) with de novo AML were treated consecutively at the Children’s Hospital of Soochow University. Of these, 83 patients (45 males, 38 females) received the LDC regimen. The median age of the 83 patients was 6.1 years (range, 0.8-14.2 years). Median WBC count at diagnosis was 12.48 × 10⁹/L (range, 1.33 × 10⁹/L to 283.41 × 10⁹/L). Nine patients who presented with WBC counts of >50 × 109/L received cytarabine alone as cytoreductive therapy before starting an LDC plus G-CSF regimen. According to the French-American-British (FAB) classification, the M1/M2 subtype was observed in 38 patients (45.8%), the M4/M5 subtype in 31 patients (37.4%), and the M7 subtype in 7 patients (8.4%). Seven patients (8.4%) were not classifiable. Gene rearrangement analysis showed RUNX1-RUNX1T1 to be present in 33 (39.8%), KMT2Ar in 11 (13.2%), and CBF/MYH11 in 6 (7.2%) of the 83 patients. Molecular analysis revealed C-KIT mutations in 19 (25%), CEBPα biallelic mutations in 6 (7.9%), FLT3-internal tandem duplication (FLT3-ITD) in 4 (5.3%), WT1 in 4 (5.3%), NPM1 in 2 (2.6%), and PTPN11 in 2 (2.6%) patients. In the initial risk classification, 10 patients (12.0%) were considered low risk, 56 (67.5%) intermediate risk, and 17 (20.5%) high risk. During the study, another 100 patients were treated with an SDC regimen (Table 2). Compared with the LDC recipients, patients allocated to the SDC group had significantly higher WBC counts at presentation and more patients were classified as having high-risk AML (Table 2).
Baseline characteristics of patients in the LDC and SDC cohorts
| Characteristic | LDC* | SDC | Total | P† |
|---|---|---|---|---|
| Sex | 83 | 100 | 183 | .355 |
| Male | 45 (54.2) | 61 (61.0) | 106 (57.9) | |
| Female | 38 (45.8) | 39 (39.0) | 77 (42.1) | |
| Age, y | 83 | 100 | 183 | .424 |
| Median | 6.1 | 7.5 | 6.8 | |
| Range | 0.8-14.2 | 0.3-13.8 | 0.3-14.2 | |
| WBC count, × 109/L | 83 | 100 | 183 | .001 |
| Median | 12.48 | 27.67 | 17.9 | |
| Range | 1.33-283.41 | 0.42-606 | 0.42-606 | |
| FAB subtype | 83 | 100 | 183 | .058 |
| M1/M2 | 38 (45.8) | 43 (43.0) | 81 (44.3) | |
| M4/M5 | 31 (37.4) | 49 (49.0) | 80 (43.7) | |
| M6 | 0 | 1 (1.0) | 1 (0.5) | |
| M7 | 7 (8.4) | 1 (1.0) | 8 (4.4) | |
| Unclassified | 7 (8.4) | 6 (6.0) | 13 (7.1) | |
| Gene rearrangements | 83 | 100 | 183 | .432 |
| RUNX1–RUNX1T1 | 33 (39.8) | 35 (35.0) | 68 (37.1) | |
| KMT2Ar | 11 (13.2) | 14 (14.0) | 25 (13.7) | |
| CBF/MYH11 | 6 (7.2) | 15 (15.0) | 21 (11.5) | |
| BCR–ABL | 0 | 1 (1.0) | 1 (0.5) | |
| Negative | 33 (39.8) | 35 (35.0) | 68 (37.2) | |
| Gene mutations | 76 | 92 | 168 | .168 |
| C-KIT | 19 (25.0) | 23 (25.0) | 42 (25.0) | |
| CEBPα biallelic mutation | 6(7.9) | 3(3.3) | 9(5.4) | |
| FLT3-ITD | 4(5.3) | 12(13.0) | 16(9.5) | |
| WT1 | 4(5.3) | 0 | 4(2.4) | |
| NPM1 | 2 (2.6) | 1(1.1) | 3 (1.8) | |
| PTPN11 | 2 (2.6) | 2 (2.2) | 4 (2.4) | |
| Other | 6(7.9) | 6(6.5) | 12(7.1) | |
| Negative | 33 (43.4) | 45 (48.9) | 78 (46.4) | |
| Provisional risk group | 83 | 100 | 183 | .035 |
| Low | 10 (12.0) | 15 (15.0) | 25 (13.7) | |
| Intermediate | 56 (67.5) | 49 (49.0) | 105 (57.3) | |
| High | 17 (20.5) | 36 (36.0) | 53 (29.0) | |
| Definitive risk group | 77 | 95 | 172 | .016 |
| Low | 10 (13.0) | 15 (15.8) | 25 (14.5) | |
| Intermediate | 51 (66.2) | 43 (45.3) | 94 (54.7) | |
| High | 16 (20.8) | 37 (38.9) | 53 (30.8) |
Data are presented as n (%), unless otherwise specified.
NR, no remission.
Selected data on 46 study patients have been previously reported.20
The Mann-Whitney U test was used for continuous variables; Fisher’s exact test was used for categorical variables with 2×2 charts; Monte Carlo analysis was used for categorical variables with N×2 charts.
Induction response and evaluation
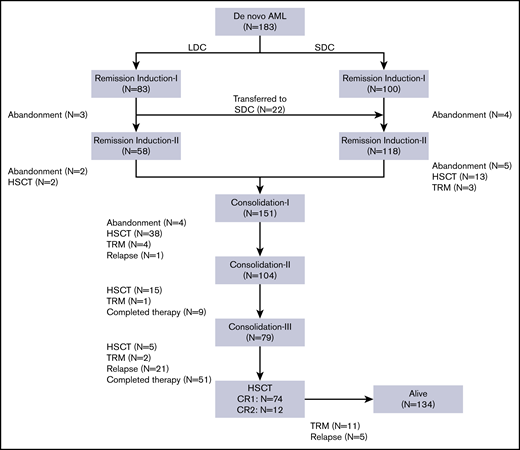
All 83 patients receiving LDC were evaluable for response (Figure 1). Seventy (84.4%) had a hematologic response: 58 (69.9%) experienced CR and 12 (14.5%) experienced PR. No deaths as a result of toxicity were observed during this treatment phase. The remaining 13 patients (15.6%) were considered to be nonresponders (Table 3). Eighty patients received induction II, 58 with the same LDC regimen and 22 with the SDC combination. The remaining 3 patients abandoned treatment before induction II. Of the 22 patients who received SDC for induction II, 13 were refractory to induction I and 9 received SDC because of physician preference. Of the 80 patients evaluable for response to induction II, 71 (88.8%) showed CR, 6 had PR or NR, and 3 abandoned treatment before bone marrow evaluation. Two patients who received SDC for induction II died as a result of TRM. In the final risk assessment after induction II evaluation, 10 patients (13.0%) were classified as having low-risk, 51 patients (66.2%) were classified as having intermediate-risk, and 16 patients (20.8%) were classified as having high-risk AML (Table 3). There was no substantial difference between the initial and definitive risk classifications; only 2 patients in the LDC group who were classified initially as having intermediate risk moved to the high-risk category.
Response evaluation
| LDC* | SDC | Total | P† | |
|---|---|---|---|---|
| First induction | 83 | 100 | 183 | .811 |
| CR | 58 (69.9) | 67 (67.0) | 125 (68.3) | |
| PR | 12 (14.5) | 18 (18.0) | 30 (16.4) | |
| NR | 13 (15.6) | 15 (15.0) | 28 (15.3) | |
| Second induction | 80 | 96 | 176 | .436 |
| CR | 71 (88.8) | 83 (86.4) | 154 (87.5) | |
| PR | 4 (5.0) | 6 (6.3) | 10 (5.7) | |
| NR | 2 (2.5) | 6 (6.3) | 8 (4.5) | |
| Unavailable‡ | 3 (3.7) | 1 (1.0) | 4 (2.3) | |
| Treatment-related deaths | 1§ | 2 | 3 | 1.000 |
| Induction I | 0 | 0 | 0 | |
| Induction II | 1 (1.2) | 2 (2.0) | 3 (1.6) | |
| Abandonment | 7 | 7 | 14 | |
| After induction I | 3 (3.6) | 4 (4.0) | 7 (3.8) | .912 |
| After induction II | 4 (4.8) | 3 (3.0) | 7 (3.8) |
All data are presented as n (%).
Twenty-two patients received 1 course of LDC for induction I and SDC for induction II.
Monte Carlo analysis was used for categorical variables with N×3 charts.
Two patients abandoned treatment and 1 patient in the LDC/SDC group died of treatment-related toxicity before evaluation of remission induction II; 1 patient died of treatment-related toxicity in the SDC group before evaluation of remission induction II.
Patient received LDC for induction I and SDC for induction II.
For comparison purposes, the response evaluation data for 100 patients who received SDC for induction are presented in Table 3. There was no significant difference in CR, PR, or NR among patients treated with the LDC or SDC regimen. Because of a shortage of omacetaxine mepesuccinate in China in 2016, mitoxantrone and daunorubicin were substituted for omacetaxine mepesuccinate for induction I and II in the LDC (n = 59) and SDC groups (n = 81), respectively. There were no differences in CR rates among patients who received omacetaxine mepesuccinate or mitoxantrone for induction chemotherapy (P = .316).
Clearance of somatic mutations after inductions I and II
We analyzed 208 bone marrow samples from 59 patients (32 treated with 2 courses of LDC and 27 treated with 2 courses of SDC) by whole-exome sequencing (supplemental Table 3). These patients had experienced hematologic remission after induction I and had samples available. In total, 439 somatic mutations of 362 genes were detected at diagnosis: 275 in the LDC group and 164 in the SDC group. The average number of mutations per patient in the LDC group was 8.6 (range, 3-17 mutations) and 6.1 (range, 1-15 mutations) in SCD. The average variant allele frequency (VAF) at diagnosis was 29.1% (range, 5.0%-84.7%) for the LDC group and 29.1% (range, 5.1%-94.7%) for the SDC group (P = .996). After induction I, the average VAF decreased to 1.9% for the LDC group and 0.6% for the SDC group (P < .001), and after induction II, the average VAF decreased to 0.17% for the LDC group and 0.078% for the SDC group (P = .052) (Figure 2A-B).

Relative change in VAFs of somatic mutations. (A-B) The change in VAFs of somatic mutations detected at diagnosis and after induction I and induction II in patients who were treated with LDC (A) or SDC (B). The thick black line shows the average VAF of all detected mutations; gray lines show the VAF of each single detected mutation. (C-D) Relative change in VAFs of the specific nonrandom AML-associated mutations at diagnosis and after induction I and induction II in the LDC (C) and SDC (D) groups. Nonrandom AML-associated genes were selected from the top 50 mutated AML-associated genes in pediatric AML and were detected recurrently in both groups. D0, at diagnosis; ID26, after induction I; IID26, after induction II; NA, not available.
Relative change in VAFs of somatic mutations. (A-B) The change in VAFs of somatic mutations detected at diagnosis and after induction I and induction II in patients who were treated with LDC (A) or SDC (B). The thick black line shows the average VAF of all detected mutations; gray lines show the VAF of each single detected mutation. (C-D) Relative change in VAFs of the specific nonrandom AML-associated mutations at diagnosis and after induction I and induction II in the LDC (C) and SDC (D) groups. Nonrandom AML-associated genes were selected from the top 50 mutated AML-associated genes in pediatric AML and were detected recurrently in both groups. D0, at diagnosis; ID26, after induction I; IID26, after induction II; NA, not available.
We also analyzed the clearance of specific nonrandom AML-associated mutations.28-31 Nine of the most frequently mutated genes in pediatric AML2 were detected recurrently in both the LDC and SDC groups (Figure 2C-D). A total of 27 nonrandom AML-associated mutations were detected in the 22 patients in the LDC group, and 26 such mutations were detected in the 18 patients in the SDC group, but all of them were cleared (VAF <2.5%) after induction II. Notably, some of these mutations were undetectable immediately after induction I in both groups (Figure 2C-D).
Postremission therapy
Because the 2 groups had similar treatment responses after induction chemotherapy and because the postremission approach was the same for all patients, we grouped them together for the postremission analysis. Of the 176 patients who completed 2 induction courses, 9 were transferred to another hospital for HSCT, 6 underwent HSCT at our center, and 151 received consolidation I (Figure 1; Table 3). Of these 151 patients, 38 underwent HSCT, 4 died as a result of TRM, and 4 abandoned treatment. Of the 104 patients who received consolidation II, 15 underwent HSCT, 1 died as a result of TRM, and 9 completed the planned therapy. Of the 79 patients who received consolidation III, 5 underwent HSCT, 2 died as a result of toxicity, and 72 completed therapy. No patient who received LDC for both induction cycles experienced TRM during induction or consolidation (Table 3).
The overall relapse rate was 18.0%, with 28 (84.8%) of 33 relapses occurring before HSCT. There were 17 relapses in the LDC group (representing 20.5% of the 83 patients in that group) and 16 relapses in the SDC group (representing 16.0% of the 100 patients in that group) (P = .447). We analyzed relapse-free survival according to definitive risk classification and treatment group. There was no significant difference in relapse rates between the 2 groups, irrespective of the risk classification (supplemental Figure 1). Sixteen of the 33 patients who relapsed underwent salvage therapy and HSCT; the other 17 refused further therapy.
Eighty-six (47.0%) of the 183 patients underwent HSCT: 74 in first CR and 12 in second CR. There was no significant difference in the number of patients who received HSCT according to treatment group: 38 (45.8%) of the 83 patients in the LDC group received HSCT vs 48 (48.0%) of the 100 patients in the SDC group (P = .758) (Table 3). Overall, 11.5% of patients experienced TRM, and 16.4% of deaths were attributed to the disease. Abandonment occurred in 9.8% of the patients and was more common during the remission induction phase.
Survival and prognostic factors
With a median follow-up of 50 months (range, 4-85 months), the 5-year probabilities of EFS, OS, and CIR for the 183 children were 63.1% ± 5.8%, 72.3% ± 4.7%, and 19.3% ± 3.0%, respectively (Figure 3A). Comparing the LDC and SDC groups, the 5-year probabilities of OS, EFS, and CIR were 72.7% ± 6.9% vs 72.5% ± 6.2% (Figure 3B), 61.4% ± 8.7% vs 65.2% ± 7.4%, and 20.5% ± 4.5% vs 17.6% ± 3.9%, respectively (Figure 3C). Because 22 patients allocated to the LDC group received the standard regimen for induction II, we performed an analysis taking into account the induction regimen actually received. For patients treated for induction with the LDC/LDC, LDC/SDC, or SDC/SDC regimens, there were no significant differences in 5-year OS (72.5% ± 8.1%, 72.7% ± 13.1%, and 72.5% ± 6.2%, respectively; P = .993 (Figure 3D), EFS (62.3% ± 1.0%, 59.1% ± 17.7%, and 65.2% ± 7.4%, respectively; P = .701), or CIR (23.0% ± 5.4%, 13.6% ± 7.5%, and 17.6% ± 3.9%, respectively; P = .502). To explore the impact of initial WBC count on outcome, we analyzed the survival in patients with WBC counts of <100 × 109/L and found no significant difference between the LDC and SDC groups in terms of OS (73.3% ± 5.1% vs 79.7% ± 4.7%, respectively; P = .332) or EFS (61.0% ± 5.6% vs 70.0% ± 5.4%, respectively; P = .194).

Outcomes of study patients according to treatment. (A) OS, EFS, and CIR for all study patients. OS (B) and EFS (upper graph lines) and CIR (lower graph lines) (C) according to treatment group. (D) OS according to the actual treatment received in induction.
Outcomes of study patients according to treatment. (A) OS, EFS, and CIR for all study patients. OS (B) and EFS (upper graph lines) and CIR (lower graph lines) (C) according to treatment group. (D) OS according to the actual treatment received in induction.
In a univariable analysis, WBC count, FAB subtype, definitive risk classification, and HSCT were associated with OS. FAB subtype, definitive risk classification, and treatment group were associated with EFS (supplemental Table 4). Multivariable regression analysis for the entire cohort showed that induction treatment had no significant impact on OS, EFS, or CIR. HSCT was significantly associated with OS (hazard ratio, 0.390; P = .007). Definitive risk classification was also an independent predictor for OS and EFS (Table 4). Because significantly more SDC recipients than LDC recipients had WBC counts of ≥100 × 109/L (25 vs 6 recipients; P = .01), we analyzed the SDC group without these patients. Cox regression analysis revealed that chemotherapy intensity during induction had no significant association with survival in patients with WBC counts of <100 × 109/L. Risk classification and HSCT remained significantly associated with outcome in the cohort with WBC counts of <100 × 109/L (supplemental Table 5). We also analyzed outcomes according to definitive risk classification and treatment group. There was no significant difference in survival between the 2 groups, irrespective of the risk classification (supplemental Figure 1).
Multivariable Cox regression of OS, EFS, and CIR in 183 patients
| Factor | OS | EFS | CIR | ||||||
|---|---|---|---|---|---|---|---|---|---|
| HR | 95% CI | P | HR | 95% CI | P | HR | 95% CI | P | |
| WBC × 109/L | |||||||||
| <100 | Reference | Reference | Reference | ||||||
| ≥100 | 1.483 | 0.691-3.186 | .312 | 1.052 | 0.515-2.148 | .889 | 0.758 | 0.305-1.883 | .550 |
| FAB subtype | |||||||||
| M1/M2 | Reference | Reference | Reference | ||||||
| M4/M5 | 0.994 | 0.411-2.406 | .990 | 0.932 | 0.465-1.867 | .842 | 2.008 | 0.844-4.777 | .115 |
| Other | 2.118 | 0.800-5.612 | .131 | 1.586 | 0.715-3.519 | .256 | 1.158 | 0.354-3.793 | .808 |
| Definitive risk | |||||||||
| Low | Reference | Reference | Reference | ||||||
| Intermediate | 2.156 | 0.483-9.631 | .314 | 2.566 | 0.765-8.609 | .127 | 2.286 | 0.484-10.805 | .297 |
| High | 7.831 | 1.629-37.637 | .010 | 6.201 | 1.689-22.769 | .006 | 3.900 | 0.769-19.783 | .100 |
| HSCT | |||||||||
| No | Reference | Reference | Reference | ||||||
| Yes | 0.390 | 0.197-0.769 | .007 | 0.693 | 0.397-1.212 | .198 | 1.054 | 0.514-2.162 | .886 |
| Induction treatment | |||||||||
| SDC/SDC | Reference | Reference | — | Reference | |||||
| LDC/LDC | 1.387 | 0.674-2.857 | .375 | 1.439 | 0.788-2.628 | .236 | 1.630 | 0.801-3.317 | .178 |
| LDC/SDC | 1.141 | 0.368-3.542 | .819 | 1.115 | 0.437-2.843 | .820 | 0.738 | 0.214-2.545 | .630 |
HR, hazard ratio.
Selected toxicities and treatment cost
Supplemental Table 6 shows selected treatment-related complications among patients receiving the LDC or SDC regimen. Patients receiving LDC for induction I had a significantly shorter period of neutrophil and platelet recovery than did SDC recipients (median, 12 vs 20 days [P < .001] and 11 vs 16 days [P < .001], respectively). Of the SDC recipients, 91% had grade 3 or 4 febrile neutropenia compared with 61.4% in the LDC group (P < .001). Similarly, patients receiving LDC for induction II had a shorter period of neutropenia and thrombocytopenia, fewer episodes of fever and neutropenia, and fewer episodes of grade 3 or 4 pneumonia and perianal abscess when compared with LDC recipients.
The median number of packed red blood cell and platelet units transfused was significantly lower for the LDC group than for the SDC group for induction I and II (supplemental Table 7). The overall cost of treatment for induction I and induction II, including blood products, antibiotics, and other expenses, was significantly higher for the SDC group than for the LDC group ($7256.50 vs $6278.90; P = .01).
Discussion
Our study expands the evidence that ∼70% of children with de novo AML experience CR after a single course of the LDC regimen.20 After receiving a second induction course with the same low-intensity regimen or with a standard induction regimen, ∼90% of the patients experienced CR. The CR rates in this cohort were comparable to those in children with AML treated with 2 courses of a conventional induction regimen at the same institution or at institutions participating in international studies of pediatric AML.1,11
Minimally myelosuppressive regimens have been used in adults with relapsed AML or in those with de novo AML who were too frail to receive standard induction therapy.32-35 A combination of low-dose cytarabine with low-dose aclarubicin administered concurrently with G-CSF was first used in Japan.36 A variation of this regimen that substitutes omacetaxine mepesuccinate for aclarubicin has been used extensively in China37,38 and with different anthracyclines in other regions.39-41 The mechanisms underlying the efficacy of LDC plus G-CSF remain elusive.42-47
Studies in elderly patients with AML have shown surprisingly high rates of CR and low treatment-related toxicity.32,37,48,49 After experiencing CR, patients were usually treated with reduced-intensity consolidation. As expected, relapse was noted in most elderly patients within 8 to 12 months.50 The low-dose cytarabine and low-dose anthracycline plus G-CSF regimens were effective at inducing remission and were well tolerated in elderly patients with AML. Because there was no evidence that G-CSF promoted leukemia growth, we hypothesized that children with AML who were at increased risk of death as a result of toxicity or treatment abandonment for socioeconomic reasons would benefit from this approach, which would allow time to manage the initial clinical complications and address the socioeconomic needs of the patients’ families. However, in contrast to the postremission strategy used with elderly patients, we used a risk-adapted postremission approach that included cycles of conventional intensive chemotherapy and HSCT when indicated. The 5-year OS was 72% for patients treated with 2 courses of LDC in induction and with adapted-risk intensive postremission therapy and HSCT in their first or second CR. This rate was not significantly different from that of patients who received conventional induction therapy and risk-adapted postremission treatment at the same institution. The OS rates for our low-dose cohort were also comparable to those reported for recent international clinical trials in the field of pediatric AML.9-11
The advantages of the LDC regimen over SDC include the shorter period of neutropenia and thrombocytopenia and the lower frequency of severe (grade 3 or 4) episodes of febrile neutropenia, mucositis, pneumonia, bleeding, and other infectious processes. Consistent with these findings, the use of blood products was significantly lower in patients who received the LDC regimen for both induction I and II. Finally, the overall cost of the 2 induction courses for LDC recipients was significantly lower than that for SDC recipients. Interestingly, the cost of induction I did not differ between the 2 cohorts, possibly reflecting the preferential inclusion of patients with comorbidities at presentation of AML in the LDC group. Therefore, children with AML who present with infectious or nutritional comorbidities require intensive supportive care (supplemental Table 8) that includes prolonged hospitalization irrespective of the treatment intensity during remission induction. Finally, exposure to anthracyclines is lower among patients treated with LDC. However, whether a lower cumulative dose of anthracyclines in remission induction is associated with less short- and long-term cardiotoxicity remains elusive.
To gain insights into the quality of response after induction, we compared the clearance of somatic mutations in a subset of patients who had bone marrow samples available for testing and who received 2 induction courses of LDC or 2 courses of SDC. VAF <2.5% has been used to indicate response in AML, corresponding to 5% mutated cells, assuming the mutations occur heterozygously.28,29 After induction I, the average VAF was significantly higher for the LDC recipients than for the SDC recipients. After induction II, there was no significant difference in the average VAF for the 2 groups. We also examined the clearance of nonrandom AML-associated mutations29-31,51 by treatment regimen and by using a criterion of VAF <1%.30 The VAFs of all genes selected were <1% after the second induction course, irrespective of the treatment arm.
Together, these observations suggest that in most cases of pediatric AML, the leukemia cell burden at diagnosis is very sensitive to chemotherapy and can be substantially reduced by low myelosuppressive approaches to a degree that permits robust reconstitution of the normal hematopoietic system. However, on the basis of adult AML data, minimally myelosuppressive regimens do not eradicate AML52,53 ; hence, postremission intense myelosuppressive therapy or HSCT is necessary for cure. A critical question not yet addressed by randomized studies is whether the initial intensity of induction chemotherapy influences the CIR. Indirect evidence that the intensity of induction might not be critical for eradicating AML comes from studies showing that increasing the intensity and complexity of remission induction regimens has not changed the ∼50% relapse rates in patients who do not undergo HSCT.10,54 The definitive answer to this question is even more relevant for patients in low-resource settings in which supportive care may be deficient and in which families cannot afford the treatment cost. In these situations, TRM or abandonment rates during induction are very high. Finally, for any child with AML, the intensity of current regimens is associated with severe toxicity that may have long-term deleterious effects on growth, development, and organ integrity.8,55
One limitation of our observational study was the exclusion of patients who presented with WBC counts of ≥50 × 109/L from the LDC group in the initial phase of the study. We were concerned that G-CSF could cause leukocytosis or leukostasis in children with high WBC counts at presentation. If the study progressed and there was no evidence that G-CSF was promoting leukocytosis, patients with WBC counts of >50 × 109/L at diagnosis received the LDC regimen after treatment with cytarabine alone for cytoreduction. Another limitation of our study was the lack of a randomized comparison group. For comparison, we used published data from international collaborative groups and from a cohort of patients who were admitted to the same institution during the study period. The clinical and biological characteristics of our 2 cohorts were similar except for the significantly higher WBC count in the SDC group. We compared the outcomes of patients with WBC counts of <100 × 109/L who were treated with the SDC regimen with those of LDC recipients. The outcome data did not differ between the 2 cohorts. A randomized study of LDC plus G-CSF vs SDC for untreated children with AML is ongoing. Finally, pediatric oncologists in LMICs must determine the strengths and weaknesses of their centers and adapt the treatment accordingly. The International Society of Pediatric Oncology has recently published guidelines on adapting AML therapy in LMICs.56 The impact of the low-intensity therapy for AML in places with limited supportive care is currently not known. It is important to consider that even a minimally myelosuppressive regimen for induction remission of AML may be associated with prolonged neutropenia. Moreover, improved outcomes require intensive postremission chemotherapy or HSCT for high-risk AML subtypes.
In conclusion, the results of this study suggest that the long-term survival rates of children who receive 1 or 2 courses of the low-intensity therapy regimen followed by risk-adapted standard postremission therapy that includes access to HSCT are comparable to those reported in international AML studies. Further investigation is necessary to determine the role of this approach in countries with limited resources.
The sequencing data have been deposited in the Genome Sequence Archive at the BIG Data Center, Beijing Institute of Genomics, Chinese Academy of Sciences, under accession numbers HRA000692 (https://bigd.big.ac.cn/gsa-human/browse/HRA000692), HRA000696 (https://bigd.big.ac.cn/gsa-human/browse/HRA000696), HRA000697 (https://bigd.big.ac.cn/gsa-human/browse/HRA000697), and HRA000030 (https://bigd.big.ac.cn/gsa-human/browse/HRA000030). For other original data, please contact Qian-fei Wang (wangqf@big.ac.cn), CAS Key Laboratory of Genomic and Precision Medicine, Beijing Institute of Genomics, Chinese Academy of Sciences, Beijing, China.
Acknowledgments
The authors thank Keith A. Laycock, Editor in the Life Sciences (an employee of St. Jude Children’s Research Hospital) for editing the manuscript, Ye Li for data collection and sorting, and our patients and their guardians for participating in this study.
This work was supported by grants from NSCF (81770193, 81700165, 81970163, and 81970174), by the Key Research Program of the Chinese Academy of Sciences (KFZD-SW-220), by the Jiangsu Province Foundation (CXTDA2017014 and BE2017659), by the National Clinical Research Center for Hematological Disorders, and by the Youth Innovation Promotion Association of Chinese Academy of Sciences (2019103). R.C.R. and C.C. were partially funded by grants from the National Institutes of Health, National Cancer Institute (CA21765), by the National Institute of General Medical Sciences (P50GM115279), by American Lebanese Syrian Associated Charities, and by the St. Jude Departments of Oncology and Global Pediatric Medicine.
The content is solely the responsibility of the authors and does not necessarily represent the official views of the National Institutes of Health.
Authorship
Contribution: S.H., R.C.R., and Q.-f.W. were the principal investigators of this study and take responsibility for the integrity of data and the accuracy of data analysis; Y.H., A.C., R.C.R., S.H., and Q.-f.W. designed the study and wrote the manuscript; A.C., S.J., X.Z., and Q.-f.W. designed the mutation clonal detection and performed sequencing; Jianqin Li, J. Ling, J.F., Y.Y., and J.P. provided study materials or samples; Y.H., A.C., S.J., and X.Z. helped collect samples and analyze sequencing data; Y.H., F.F., and C.C. performed the statistical analyses; Y.H., A.C., and R.C.R. prepared the figures and tables; Y.H., L.G., L.F., and S.C. collected clinical data; H.H., P.X., J. Lu, Y.W., and Jie Li provided advice on clinical study design and participated in clinical data collection; and all authors reviewed and approved the submitted manuscript.
Conflict-of-interest disclosure: The authors declare no competing financial interests.
Correspondence: Raul C. Ribeiro, Department of Oncology and Department of Global Pediatric Medicine, St. Jude Children’s Research Hospital, 262 Danny Thomas Pl, Memphis, TN 38105; e-mail: raul.ribeiro@stjude.org.

