

Key Points
An ASXL1- and/or NRAS-mutated genotype, bone marrow blasts, and comorbidities independently predict survival in CMML after transplantation.
These variables may build a CMML transplant score predictive of survival and nonrelapse mortality and may facilitate patient counseling.

Abstract
The inclusion of mutation status improved risk stratification for newly diagnosed patients with chronic myelomonocytic leukemia (CMML). Stem cell transplantation is a potentially curative treatment option, and patient selection is critical because of relevant transplant-related morbidity and mortality. We aimed to evaluate the impact of mutation status together with clinical presentations on posttransplant outcome. Our study included 240 patients with a median follow-up of 5.5 years. A significant association with worse survival was identified for the presence of mutations in ASXL1 and/or NRAS. In multivariable analysis, ASXL1- and/or NRAS-mutated genotype (hazard ratio [HR], 1.63), marrow blasts >2% (HR, 1.70), and increasing comorbidity index (continuous HR, 1.16) were independently associated with worse survival. A prognostic score (CMML transplant score) was developed, and the following points were assigned: 4 points for an ASXL1- and/or NRAS-mutated genotype or blasts >2% and 1 point each for an increase of 1 in the comorbidity index. The CMML transplant score (range, 0-20) was predictive of survival and nonrelapse mortality (P < .001 for both). Up to 5 risk groups were identified, showing 5-year survival of 81% for a score of 0 to 1, 49% for a score of 2 to 4, 43% for a score of 5 to 7, 31% for a score of 8 to 10, and 19% for a score >10. The score retained performance after validation (concordance index, 0.68) and good accuracy after calibration. Predictions were superior compared with existing scores designed for the nontransplant setting, which resulted in significant risk reclassification. This CMML transplant score, which incorporated mutation and clinical information, was prognostic in patients specifically undergoing transplantation and may facilitate personalized counseling.
Introduction
Chronic myelomonocytic leukemia (CMML) is a clonal hematopoietic stem cell disorder characterized by persistent monocytosis in the peripheral blood and overlapping features between myelodysplastic syndromes and myeloproliferative neoplasms in the bone marrow (BM).1,2 The clinical presentation is heterogeneous with symptoms of pancytopenia and BM failure (recurrent infections, bleeding, and transfusion dependence) as well as signs and symptoms of myeloproliferation (leukocytosis, splenomegaly, presence of B-symptoms). Both phenotypes are associated with a variable risk of transformation into secondary acute myeloid leukemia with very poor prognosis.3
Standard treatment approaches for CMML include supportive care and cytoreductive therapy with hydroxycarbamide for controlling leukocytosis.4 Hypomethylating agents have also been incorporated into clinical practice extending the therapeutic options for CMML.4-6 Nevertheless, no such therapies have been shown to alter the natural course of the disease.
Allogeneic stem cell transplantation (allo-SCT) remains the only potentially curative treatment option to date, but it is associated with relevant transplant-related morbidity and mortality.7,8 Transplantation is currently indicated in patients age 70 years or younger and is considered as standard of care in patients with higher-risk CMML.4,8 Although risk stratification for diagnosed CMML may rely on several established prognostic systems that include clinical and genetic features,9 uncertainty remains with respect to adequate clinical-molecular risk stratification specifically regarding posttransplant outcome.10 Therefore, patients who may benefit the most from allo-SCT and the timing of allo-SCT have yet to be identified.4,8,10
Here, we aimed to propose and validate a comprehensive prognostic index specifically for patients with CMML who are undergoing allo-SCT that includes clinical and molecular features that may improve patient selection by allowing personalized counseling regarding patients’ individual posttransplant outcome.
Methods
Patients and data collection
This international multicenter study included a total of 240 CMML patients from 10 centers who were undergoing their first allo-SCT, diagnosed at the time of transplantation according to the criteria of the 2016 revised World Health Organization (WHO) classification of myeloid neoplasms.1 The participating centers were the University Medical Center Hamburg-Eppendorf (Hamburg, Germany), University Hospital of Essen (Essen, Germany), University Hospital Carl Gustav Carus (Dresden, Germany), Medical Faculty Heinrich-Heine University (Duesseldorf, Germany), Medical Center-University of Freiburg (Freiburg, Germany), University Hospital Heidelberg (Heidelberg, Germany), Hannover Medical School (Hannover, Germany), Hôpital Saint-Louis (Paris, France), Radboud University Medical Center (Nijmegen, the Netherlands), and Fred Hutchinson Cancer Research Center (FHCRC) (Seattle, Washington). Results from the FHCRC cohort have been reported recently,11 and only the CMML patients from that cohort who had data on mutation status were included in this study. Transplantation was received between 1996 and 2019, and patients with CMML who had already progressed to acute leukemia at the time of transplantation were excluded. Acute leukemia was defined as at least 20% blasts in peripheral blood or BM. This study was approved by the local institutional review boards. The procedures followed were in accordance with the Declaration of Helsinki of 1975, as revised in 2000.
Cytogenetic and mutation analysis
Cytogenetic reporting was performed according to the International System for Human Cytogenetic Nomenclature criteria, using standardized techniques. Cytogenetic risk category was defined according to previously established cytogenetic risk stratification.12 Current prognostic systems that were developed for nontransplant CMML, such as the MD Anderson Prognostic Score (MDAPS),13 the CMML-specific prognostic scoring system (CPSS)14 and its molecular refinement (CPSS-mol),15 the Molecular Mayo Model (MMM),16 and the Groupe Francophone des Myelodysplasies (GFM), were used to calculate score at the time of transplantation.17
Mutation analysis was performed on DNA from BM mononuclear cells or from peripheral blood granulocytes collected before transplantation. Most samples (114 of 240) were analyzed centrally in Hamburg (including all samples from Hamburg, Hannover, and Dresden, 27 samples from Essen, and 8 samples from Duesseldorf) using amplicon-based next-generation sequencing of a custom panel consisting of 18 different genes and 313 amplicons in 2 primer pools (pool 1 with 159 amplicons and pool 2 with 154 amplicons) with 20 ng of DNA, targeting regions in ZRSR2, TET2, ASXL1, EZH2, TP53, DNMT3A, SF3B1, SH2B3, SRSF2 (full gene), KRAS, NRAS codons 12-13 and 61), U2AF1 (exons 2 and 4), RUNX1 (exons 1-8), CBL (exons 8-9), ETV6 (exon 8), IDH1 (exon 4), IDH2 (exon 4), and SETBP1 (exon 4). The amplicon range was 125 to 225 bp and the panel size was 45.01 kb. The sequencing was performed for all patients by using an Ion Personalized Genome Machine (Thermo Fisher Scientific, Waltham, MA). Mutations in JAK2 V617F were determined by using digital polymerase chain reaction as a mutation assay (Bio-Rad, Foster City, CA; catalog No. dHsaCP2000062 for WT gen HeX labeled and dHsaCP2000061 for mutation V617F FAM labeled). The panel and analyses were designed as part of the usual clinical process in Hamburg from the beginning, and samples were always taken before transplantation. The remaining analyses were performed as previously described, and all samples were taken before transplantation.11,18,19 Detailed information on mutation analyses is provided in the supplemental Data.
Statistical analysis
Patient characteristics are summarized as number and percentage or median and range. χ2 was estimated for comparison of categorical variables, and linear regression modeling was used to estimate the fraction that explained variability of clinical phenotype by genotype. Follow-up was calculated using the inverse method.20 The primary outcome of overall survival (OS) was defined as time from date of transplantation to death from any cause. The secondary objective of the cumulative incidence of nonrelapse mortality (NRM) was estimated with a competing risk approach, considering relapse as a competing event. The distribution of survival was estimated by the Kaplan-Meier method and compared by the log-rank test. Hazard ratios (HRs) and corresponding 95% confidence intervals (CIs) using Cox regression were applied for variables in univariable and multivariable analyses. The proportional hazard assumption was validated by visual inspection and testing of Schoenfeld residuals.21 The effect of quantitative covariates on NRM was estimated by the Fine-Gray regression model.
Interaction analyses between covariates were tested by introducing interaction terms in univariable and multivariable models, and multiple imputation was used for missing information. The final model for survival was selected on the basis of clinical judgment and by evaluating the model’s discrimination using the concordance index.22 The concordance index is the probability that for 2 randomly selected patients, the patient who experienced the event first had a higher probability of having the event according to the model. A concordance index of 0.5 represents agreement by chance alone, and a concordance index of 1 represents perfect discrimination. The accuracy of predictions was further evaluated by estimating the model’s calibration, and the performance of the model was evaluated with 10-fold cross-validation.22 For the final prognostic score, points were assigned relative to the beta coefficients produced from the multivariable model.
All values with P < .05 were considered statistically significant. All analyses were performed using R software version 3.6.1 (R: A language and environment for statistical computing. R Foundation for Statistical Computing, Vienna, Austria. https://www.R-project.org/).
Results
Patient characteristics
A total of 240 CMML patients were included, with a median age of 59 years at the time of transplantation (range, 19-74 years). The median follow-up was 5.5 years (95% CI, 4.0-7.0 years). Male patients were more frequent (72%), and at time of transplantation, CMML classification according to WHO was 0 in 10% (24 patients), 1 in 50% (119 patients), and 2 in 40% (97 patients). Half the patients were transfusion dependent before transplantation. The recipient-donor relationship of the transplant was matched related in 21%, matched unrelated in 54%, mismatched related in 3%, and mismatched unrelated in 22% of patients. Graft type was mainly peripheral blood (93%), and 56% of patients received reduced intensity conditioning compared with 44% of patients who received myeloablative conditioning. Half the patients had a comorbidity index of 0 or 1 according to Sorror et al23 (supplemental Table 2), whereas 21% of patients had a comorbidity index of >3. Detailed clinical information regarding the cohort is summarized in Table 1 and supplemental Table 1.
Clinical characteristics
| Characteristic | No. (%) | Median (range) |
|---|---|---|
| Total cohort | 240 | |
| Age at transplant, y | 59 (19-74) | |
| Sex | ||
| Female | 68 (28) | |
| Male | 172 (72) | |
| WHO classification | ||
| 0 | 24 (10) | |
| 1 | 119 (50) | |
| 2 | 97 (40) | |
| Bone marrow blasts, % | 5 (0-19) | |
| Circulating blasts, % | 0 (0-19) | |
| Hemoglobin, g/dL | 10 (6-16) | |
| Platelets, × 109/L | 78 (1-737) | |
| Leukocytes, × 109/L | 11.0 (0.1-82.6) | |
| Neutrophils, × 109/L | 5.6 (0.1-59.8) | |
| Transfusion before transplant | 122 (51) | |
| Time from diagnosis to transplant, y | 0.7 (0.01-9.2) | |
| Donor relation | ||
| Matched related | 50 (21) | |
| Matched unrelated | 131 (54) | |
| Mismatched related | 7 (3) | |
| Mismatched unrelated | 52 (22) | |
| Conditioning intensity | ||
| Myeloablative | 106 (44) | |
| Reduced | 134 (56) | |
| Peripheral blood graft | 224 (93) | |
| Pretreatment | ||
| No | 67 (28) | |
| Hydroxyurea | 63 (26) | |
| Hypomethylating agents | 59 (25) | |
| Other | 31 (13) | |
| Unknown | 20 (8) | |
| Comorbidity index* | ||
| 0-1 | 121 (50) | |
| 2-3 | 69 (29) | |
| >3 | 50 (21) | |
| Cytogenetic risk† | ||
| Low | 146 (61) | |
| Intermediate | 36 (15) | |
| High | 29 (12) | |
| Unknown | 29 (12) |
Cytogenetics and patterns of mutational information
Information on cytogenetics was available in 88% of patients. Cytogenetic risk according to Such et al12,14 was low in 61%, intermediate in 15%, and high in the remaining 12% of patients. Ninety-one percent of patients had at least 1 mutation at the time of transplantation, and the median number of mutations was 3 (range, 0-8 mutations). The most frequently mutated genes were SRSF2 (34.5%), TET2 (34.2%), ASXL1 (34.2%), RUNX1 (20.3%), NRAS (19.3%), DNMT3A (17.4%), SETBP1 (16.0%), CBL (15.4%), U2AF1 (14.4%), ZRSR2 (11.2%), KRAS (10.9%), EZH2 (9.0%), IDH1 (7.9%), SF3B1 (8.0%), JAK2 (7.8%), and TP53 (6.9%). A significant association was found for TET2 and ASXL1 (P = .01), with co-occurrence of both mutations in 16% of patients. In line with previous findings,15 another association was found for TET2 and RNA splicing factors (P = .001), with co-occurrence of TET2 and SRSF2 in 17% of patients. A complete list of mutations, frequencies of mutations, and mutation patterns are depicted in Figure 1.
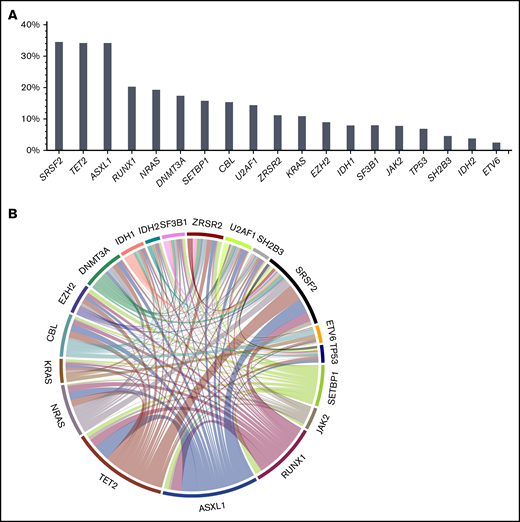
Mutation frequencies and patterns. At time of transplantation, 91% of patients had at least 1 mutation, and the median number of mutations was 3 (range, 0-8 mutations). (A) The most frequently mutated genes were SRSF2 (34.5%), TET2 (34.2%), ASXL1 (34.2%), RUNX1 (20.3%), NRAS (19.3%), DNMT3A (17.4%), SETBP1 (16.0%), CBL (15.4%), U2AF1 (14.4%), ZRSR2 (11.2%), KRAS (10.9%), EZH2 (9.0%), IDH1 (7.9%), SF3B1 (8.0%), JAK2 (7.8%), and TP53 (6.9%). A significant association was found for TET2 and ASXL1 (P = .01), showing co-occurrence of both mutations in 16% of patients. (B) In line with previous findings,15 another association was found for TET2 and RNA splicing factors (P = .001), showing co-occurrence of TET2 and SRSF2 in 17% of patients.
Mutation frequencies and patterns. At time of transplantation, 91% of patients had at least 1 mutation, and the median number of mutations was 3 (range, 0-8 mutations). (A) The most frequently mutated genes were SRSF2 (34.5%), TET2 (34.2%), ASXL1 (34.2%), RUNX1 (20.3%), NRAS (19.3%), DNMT3A (17.4%), SETBP1 (16.0%), CBL (15.4%), U2AF1 (14.4%), ZRSR2 (11.2%), KRAS (10.9%), EZH2 (9.0%), IDH1 (7.9%), SF3B1 (8.0%), JAK2 (7.8%), and TP53 (6.9%). A significant association was found for TET2 and ASXL1 (P = .01), showing co-occurrence of both mutations in 16% of patients. (B) In line with previous findings,15 another association was found for TET2 and RNA splicing factors (P = .001), showing co-occurrence of TET2 and SRSF2 in 17% of patients.
We analyzed the distribution of mutations and cytogenetic risk according to French-American-British (FAB) subtypes (dysplastic or proliferative) and WHO classification and found that mutations in NRAS (P = .003) and CBL (P = .01) were significantly associated with a proliferative subtype, whereas mutations in TP53 (P = .01) were significantly associated with CMML-0 (supplemental Table 3). Mutations were also stratified according to age groups (younger than age 60 years vs age 60 years or older) and comparisons in SETBP1, JAK2, and ZRSR2 showed higher frequencies in patients age 60 years or older. Furthermore, comparison of cytogenetic risk classification identified higher frequencies of high-risk patients in patients age 60 years or older (18%) vs those younger than age 60 years (9%).
After applying regression modeling by calculating the R2 coefficient (meaning the ratio between the explained variation and the total variation of the model), leukocyte counts were independently predicted by mutations in NRAS (P = .001) and CBL (P = .04), accounting for 0.21 and 0.17 of the variability, respectively, whereas no significant association was found for BM blasts. With respect to age, JAK2 was significantly associated with older age (P = .03), and KRAS was associated with younger ager (P = .02). The remaining mutations showed no significant association with age (supplemental Table 4).
Prognostic value of cytogenetics and mutations
In univariable analysis, current cytogenetic risk stratification was not associated with distinctive survival (P = .30), with HRs of 0.71 for the intermediate-risk and 1.19 for the high-risk groups compared with the low-risk group. Moreover, current molecular-genetic categories included in the CPSS-mol (using cytogenetic risk together with mutations in ASXL1, NRAS, SETBP1, and RUNX1) were not significantly associated with survival (P = .09); HRs were 1.01 for intermediate-1–risk, 1.20 for intermediate-2–risk, and 1.72 for high-risk groups compared with the low-risk group.
The complete univariable analysis of molecular features is summarized in Table 2. The number of mutations was not significantly associated with survival (P = .10). More than 2 mutations resulted in an HR of 1.39 (P = .08). Regarding specific mutations, ASXL1 (P = .05) and NRAS (P = .01) were significantly associated with worse survival, with HRs of 1.45 and 1.67 compared with unmutated genotypes (supplemental Figure 1). Furthermore, an interaction of mutation number and both mutations was identified (P < .001), and the association of NRAS and worse outcome was not influenced by the presence or absence of KRAS (P = .41) or KRAS/CBL/JAK2 (P = .98).
Univariable analysis of effect of molecular-genetic features on survival
| Factor | HR | 95% CI | P |
|---|---|---|---|
| Cytogenetic risk* | |||
| Low | Reference | ||
| Intermediate | 0.71 | 0.42-1.18 | .18 |
| High | 1.19 | 0.71-1.97 | .51 |
| Mutation | |||
| TET2 | 1.11 | 0.76-1.61 | .60 |
| ASXL1 | 1.45 | 1.00-2.10 | .05 |
| NRAS | 1.67 | 1.11-2.52 | .01 |
| KRAS | 1.34 | 0.78-2.32 | .29 |
| SETBP1 | 0.91 | 0.55-1.53 | .73 |
| JAK2 | 0.80 | 0.37-1.71 | .56 |
| CBL | 1.08 | 0.62-1.68 | .95 |
| DNMT3A | 0.90 | 0.57-1.44 | .68 |
| EZH2 | 1.09 | 0.62-1.91 | .76 |
| IDH1 | 1.28 | 0.68-2.38 | .44 |
| IDH2 | 0.67 | 0.25-1.83 | .44 |
| ZRSR2 | 0.74 | 0.40-1.38 | .34 |
| U2AF1 | 0.93 | 0.55-1.58 | .79 |
| SH2B3 | 1.09 | 0.48-2.48 | .83 |
| SRSF2 | 1.28 | 0.88-1.86 | .19 |
| ETV6 | 0.75 | 0.18-3.02 | .68 |
| TP53 | 1.31 | 0.70-2.42 | .40 |
| RUNX1 | 1.27 | 0.83-1.95 | .26 |
| SF3B1 | 0.86 | 0.44-1.71 | .68 |
| No. of mutations | |||
| Continuous | 1.09 | 0.98-1.22 | .10 |
| 0-2 | Reference | ||
| >2 | 1.39 | 0.97-2.01 | .08 |
| Genetic risk† | |||
| Low | Reference | ||
| Intermediate-1 | 0.96 | 0.57-1.62 | .88 |
| Intermediate-2 | 1.02 | 0.56-1.85 | .95 |
| High | 1.34 | 0.79-2.27 | .27 |
As defined in Such et al12 : low, normal and isolated -Y; intermediate, other abnormalities; and high, trisomy 8, complex karyotype (≥3 abnormalities), and abnormalities of chromosome 7.
As defined in Elenea et al15 : cytogenetic risk, presence or absence of ASXL1 and/or NRAS and/or RUNX1 and/or SETBP1 mutations.
Subsequently, when compared with an ASXL1-/NRAS-unmutated genotype, the presence of 1 (P = .01) or 2 (P = .03) mutations was significantly associated with worse survival, with HRs of 1.62 and 1.97 (supplemental Figure 1). Notably, all patients with an absent ASXL1 or NRAS mutation had none of the other sequenced mutations. The full results of the univariable analysis are provided in Table 2.
Prognostic value of clinical variables
According to WHO classification, no significant difference was identified between CMML-0 compared with CMML-1 (P = .49) and CMML-2 (P = .09), with HRs of 1.28 and 1.84. BM blasts as a continuous variable were not significantly associated with survival (P = .19), but likelihood ratio analyses identified blasts >2% as the best predictor for worse outcome (P = .008), with an HR of 1.77 compared with 0% to 2% BM blasts. Another predictor for worse outcome in univariable analysis was increasing comorbidity index, as previously defined by Sorror et al23 (P < .001), showing a continuous HR of 1.19. Categorization into 3 risk groups (0-1 vs 2-3 vs >3) did not provide benefit for prediction accuracy or discrimination. The remaining results of the univariable analysis are summarized in Table 3.
Univariable analysis of effect of clinical features on survival
| Factor | HR | 95% CI | P |
|---|---|---|---|
| Continuous age at transplant | 1.01 | 0.99-1.03 | .22 |
| Sex | |||
| Female | Reference | ||
| Male | 1.24 | 0.85-1.83 | .27 |
| WHO classification | |||
| 0 | Reference | ||
| 1 | 1.28 | 0.64-2.58 | .49 |
| 2 | 1.84 | 0.92-3.70 | .09 |
| Bone marrow blasts, % | |||
| Continuous | 1.02 | 0.99-1.06 | .19 |
| >2 | 1.77 | 1.16-2.72 | .008 |
| Hemoglobin, g/dL | 0.97 | 0.90-1.05 | .46 |
| Platelets, × 109/L | |||
| Continuous | 1.00 | 1.00-1.00 | .09 |
| ≥150 | Reference | ||
| <150 | 1.16 | 0.78-1.72 | .46 |
| Leukocytes, × 109/L (FAB) | |||
| <13 | Reference | ||
| ≥13 | 1.36 | 0.97-1.91 | .08 |
| Neutrophils, × 109/L | 1.00 | 0.98-1.02 | .95 |
| Transfusion dependency | 1.01 | 0.67-1.52 | .95 |
| Donor relation | |||
| Matched related | Reference | ||
| Matched unrelated | 0.96 | 0.62-1.48 | .86 |
| Mismatched related | 1.59 | 0.48-5.25 | .45 |
| Mismatched unrelated | 1.38 | 0.84-2.26 | .20 |
| Conditioning intensity | |||
| Myeloablative | Reference | ||
| Reduced | 1.16 | 0.83-1.65 | .37 |
| Graft type | |||
| Peripheral blood | Reference | ||
| Other | 1.68 | 0.91-3.07 | .10 |
| Pretreatment | |||
| No | Reference | ||
| Hydroxyurea | 1.02 | 0.65-1.60 | .94 |
| Hypomethylating agents | 1.13 | 0.71-1.79 | .61 |
| Other | 1.26 | 0.74-2.16 | .40 |
| Comorbidity index* | |||
| Continuous | 1.27 | 1.16-1.39 | <.001 |
| 0-1 | Reference | ||
| 2-3 | 1.44 | 0.97-2.14 | .07 |
| >3 | 2.06 | 1.35-3.15 | .001 |
As defined in Sorror et al.23
Multivariable effects on survival and development of a CMML transplant score prognostic of survival and NRM
The following variables retained independent prognostic value regarding OS: ASXL1- and/or NRAS-mutated genotype with an HR of 1.63 (P = .006), BM blasts >2% with an HR of 1.70 (P = .02), and increasing comorbidity index with an HR of 1.16 (P < .001; Table 4). The original concordance index for the model was 0.68 (95% CI, 0.63-0.73), and the corrected index was 0.67 (95% CI, 0.63-0.71). The model showed good calibration (supplemental Figure 2), and no difference in model accuracy was identified after further adjustment for age, platelet count, and FAB category.
Multivariate analysis
| Factor | Beta | HR | 95% CI | P | Points |
|---|---|---|---|---|---|
| Continuous comorbidity index | 0.15 | 1.16 | 1.07-1.25 | <.001 | 1 |
| >2 BM blasts, % | 0.53 | 1.70 | 1.11-2.61 | .02 | 4 |
| Genotype | |||||
| ASXL1- and/or NRAS-mutated | 0.49 | 1.63 | 1.15-2.31 | .006 | 4 |
| Factor | Beta | HR | 95% CI | P | Points |
|---|---|---|---|---|---|
| Continuous comorbidity index | 0.15 | 1.16 | 1.07-1.25 | <.001 | 1 |
| >2 BM blasts, % | 0.53 | 1.70 | 1.11-2.61 | .02 | 4 |
| Genotype | |||||
| ASXL1- and/or NRAS-mutated | 0.49 | 1.63 | 1.15-2.31 | .006 | 4 |
Concordance index: 0.68; corrected: 0.67.
On the basis of regression coefficients, a clinical-molecular prognostic score (the CMML transplant score) was developed, and the following points were assigned to each variable: 4 points for an ASXL1- and/or NRAS-mutated genotype and BM blasts >2% and 1 point each for an increase of 1 in the comorbidity index. The resulting score then ranged from 0 to 20 and was predictive of survival, showing a continuous HR of 1.14 (P < .001). On the basis of this score, we were able to distinguish up to 5 risk groups with a distinct risk for death after transplantation (P < .001; Figure 2A), showing a corresponding 5-year survival of 81% (95% CI, 64%-100%) for a score of 0 to 1, 49% (95% CI, 36%-66%) for a score of 2 to 4, 43% (95% CI, 30%-60%) for a score of 5 to 7, 31% (95% CI, 20%-49%) for a score of 8 to 10, and 19% (95% CI, 11%-36%) for a score of >10.
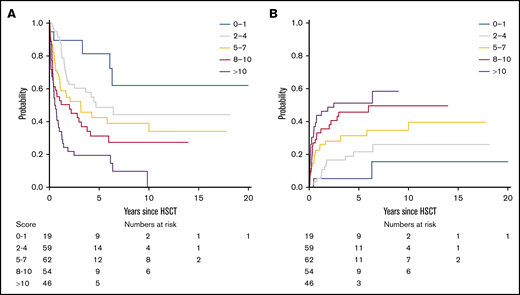
Survival and NRM according to the CMML transplant score. (A) On the basis of the CMML transplant score (range, 0-20), 5 risk groups with distinct risk for death after transplantation could be distinguished (P < .001), showing a corresponding 5-year survival of 81% (95% CI, 64%-100%) for a score of 0 to 1, 49% (95% CI, 36%-66%) for a score of 2 to 4, 43% (95% CI, 30%-60%) for a score of 5 to 7, 31% (95% CI, 20%-49%) for a score of 8 to 10, and 19% (95% CI, 11%-36%) for a score of >10. An increasing CMML transplant score was also significantly associated with higher NRM (P < .001). (B) Accordingly, the corresponding 5-year NRM was 5% (95% CI, 0%-15%) for a score of 0 to 1, 22% (95% CI, 11%-33%) for a score of 2 to 4, 31% (95% CI, 19%-43%) for a score of 5 to 7, 46% (95% CI, 32%-60%) for a score of 8 to 10, and 51% (95% CI, 36%-67%) for a score of >10.
Survival and NRM according to the CMML transplant score. (A) On the basis of the CMML transplant score (range, 0-20), 5 risk groups with distinct risk for death after transplantation could be distinguished (P < .001), showing a corresponding 5-year survival of 81% (95% CI, 64%-100%) for a score of 0 to 1, 49% (95% CI, 36%-66%) for a score of 2 to 4, 43% (95% CI, 30%-60%) for a score of 5 to 7, 31% (95% CI, 20%-49%) for a score of 8 to 10, and 19% (95% CI, 11%-36%) for a score of >10. An increasing CMML transplant score was also significantly associated with higher NRM (P < .001). (B) Accordingly, the corresponding 5-year NRM was 5% (95% CI, 0%-15%) for a score of 0 to 1, 22% (95% CI, 11%-33%) for a score of 2 to 4, 31% (95% CI, 19%-43%) for a score of 5 to 7, 46% (95% CI, 32%-60%) for a score of 8 to 10, and 51% (95% CI, 36%-67%) for a score of >10.
Next, the proposed CMML transplant score was evaluated regarding its prognostic utility for the secondary objective of NRM using a competing risks framework. The continuous hazard for death, with relapse as a competing event, was 1.14 (95% CI, 1.07-1.20) for an increasing score. An increasing CMML transplant score was thus significantly associated with higher NRM (P < .001; Figure 2B). Accordingly, the corresponding 5-year NRM was 5% (95% CI, 0%-15%) for a score of 0 to 1, 22% (95% CI, 11%-33%) for a score of 2 to 4, 31% (95% CI, 19%-43%) for a score of 5 to 7, 46% (95% CI, 32%-60%) for a score of 8 to 10, and 51% (95% CI, 36%-67%) for a score of >10. To depict general applicability of the score and utility for validation situations in which only smaller populations are available, 3 risk groups (score 0-4, 5-10, >10) provided comparable performance regarding survival and NRM (supplemental Figure 3).
Comparison with previously defined prognostic scores
We then calculated previously defined prognostic scoring systems that included mutation status (CPSS-mol, GFM, and MMM) and evaluated their ability to discriminate distinct survival (supplemental Figure A-C). The CPSS-mol (which included genetic scores, red blood cell transfusion dependency, leukocyte count, and BM blasts) showed 5-year survival for the low-risk group of 42%, whereas survival was 62% in the intermediate-1–risk group, 38% in the intermediate-2–risk group, and 37% in the high-risk group (overall P = .04). In contrast, the GFM scoring system (which included age, hemoglobin, leukocyte and platelet counts, and ASXL1 mutation), had a 5-year survival rate of 50% for the resulting low-risk group, 29% for the intermediate-risk group, and 28% for the high-risk group (overall P < .001). The MMM (which included hemoglobin, absolute monocyte count, circulating immature myeloid cell and platelet counts, and ASXL1 mutation) had a 5-year survival rate of 46% for the low-risk group, 51% for the intermediate-1–risk group, 36% for the intermediate-2–risk group, and 35% for the high-risk group (overall P = .05).
Previously established systems that included only clinical variables (CPSS and MDAPS) were also evaluated (supplemental Figure 4D-E). The CPSS (which included FAB and WHO CMML subtypes, CMML-specific cytogenetic risk classification, and red blood cell transfusion dependency) was not significantly associated with different survival rates (overall P = .20). Corresponding 5-year survival was 59% in the low-risk group, 47% in the intermediate-1–risk group, 33% in the intermediate-2–risk group, and 48% in the high-risk group. The MDAPS (which included hemoglobin level, presence of circulating immature myeloid cells, absolute lymphocyte counts, and BM blasts) was not significantly associated with different survival rates (overall P = .10) and showed 5-year survival of 43% for the low-risk group, 34% for the intermediate-1–risk group, 30% for the intermediate-2–risk group, and 28% for the high-risk group.
The comparison of current prognostic scores according to the performance evaluated by the concordance index showed that the CMML transplant score performed better, showing an original and corrected concordance index of 0.68 and 0.67 compared with previously established systems including mutation status (0.60 for the CPSS-mol, 0.60 for the GFM, and 0.59 for the MMM) as well as only clinical variables (0.56 for the CPSS and 0.58 for the MDAPS; Figure 3).
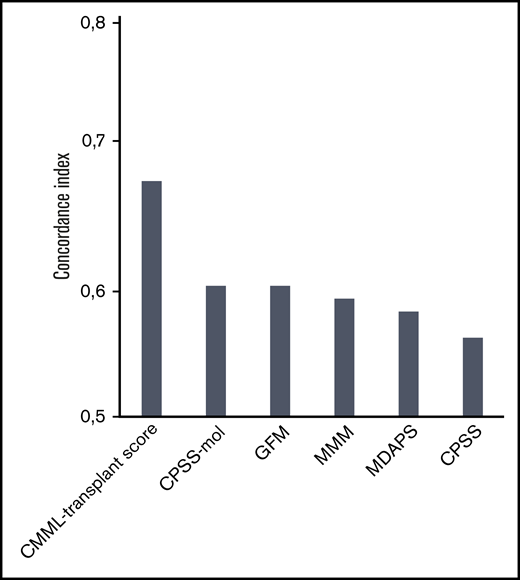
Concordance index for different prognostic scores in patients with CMML undergoing transplantation. The comparison of current prognostic scores according to the performance evaluated by the concordance index showed that the CMML transplant score performed better, showing an original concordance index of 0.68 and a corrected concordance index of 0.67 compared with previously established systems that included mutation status (0.60 for the CPSS-mol, 0.60 for the GFM, and 0.59 for the MMM) as well as clinical variables only (0.56 for the CPSS and 0.58 for the MDAPS). A concordance index of 0.5 represents agreement by chance alone, and a concordance index of 1 represents perfect discrimination.
Concordance index for different prognostic scores in patients with CMML undergoing transplantation. The comparison of current prognostic scores according to the performance evaluated by the concordance index showed that the CMML transplant score performed better, showing an original concordance index of 0.68 and a corrected concordance index of 0.67 compared with previously established systems that included mutation status (0.60 for the CPSS-mol, 0.60 for the GFM, and 0.59 for the MMM) as well as clinical variables only (0.56 for the CPSS and 0.58 for the MDAPS). A concordance index of 0.5 represents agreement by chance alone, and a concordance index of 1 represents perfect discrimination.
Finally, we generated cross tables of proposed patient classifications (rows), with classifications represented in colors on the x-axis according to previous scores including mutation status (supplemental Figure 5). We found significant differences compared with all 3 scores (P < .001 compared with CPSS-mol and GFM and P < .01 compared with MMM). The CMML transplant score and the CPSS-mol and MMM generally agreed on patients at higher risk. However, the proposed CMML transplant score resulted in significant reclassification of patients previously in the low- and intermediate-risk classifications.
Discussion
By studying an international multicenter cohort of 240 patients undergoing allo-SCT with long-term follow-up and next-generation sequencing available, we showed that BM blasts at time of transplantation, ASXL1 and/or NRAS mutations, and comorbidities can be integrated to refine risk stratification for CMML after transplantation.
Several studies have evaluated the prognostic value of clinical, hematologic, and transplant-related variables for outcomes in CMML patients undergoing transplantation,7,24-26 but results differed substantially, possibly owing to different populations and to limited data availability.10 For example, higher CPSS score at the time of transplantation was associated with worse survival in 1 study,25 but risk groups had to be combined into low/intermediate-1 and intermediate-2/high for more adequate analyses, and no association was found for CPSS score and NRM. For 20% of patients, the CPSS was unknown, which suggests some prognostic value but limited discrimination and utility for the transplant setting. Other studies found better survival for patients with higher BM blasts at time of transplantation but may have been confounded by including patients with secondary leukemia in the analyses.7,24,26
In view of the limited evidence on the specific impact of certain clinical variables in the transplant setting and because the inclusion of mutation status led to improved risk stratification in the nontransplant setting,27 we aimed to analyze the impact of mutation status in a large multicenter cohort and to evaluate its role in combination with clinical presentation of the patients. Our results underscore the rationale and better utility for integrated clinical-molecular prognostication for CMML27 by showing better performance of scores that included mutation status such as the CPSS-mol, GFM, and MMM scores when compared with scores that included only clinical variables such as the MDAPS and CPSS.28 Prognostic utility specifically for posttransplant outcome was comparable between the scores but it was still modest, with a concordance index of 0.60 for the CPSS-mol and GFM and 0.59 for the MMM compared with 0.58 for the MDAPS and 0.56 for the CPSS.
By identifying ASXL1 mutation as predictive for survival after transplantation, we could further confirm the role of this specific mutation, shared by all 3 previously defined scores as a predictor for outcome in nontransplant patients.15-17 No association of ASXL1 and TET2 mutations were identified as was recently suggested,29 but that may have been influenced by the number of patients in our cohort. The role of NRAS and the overall number of mutations on posttransplant outcome was recently shown, albeit regarding relapse.11 Here, we found a significant and consistent association of NRAS and survival, which was further refined by an interaction with ASXL1 and number of mutations.30 By focusing our analyses on survival rather than incidence of relapse, we aimed to better ensure counseling regarding long-term outcome. Furthermore, leukocyte counts were independently predicted by mutations in NRAS and CBL, which accounts for the outcome variability according to FAB subtypes. Other previously suggested mutations associated with worse survival, such as SETBP1 and RUNX1,15,16 were not predictive of posttransplant survival, with HRs of 0.91 and 1.27, respectively.
Prognostic scores for several malignancies have been shown to help patients with complex discussions regarding the risks and benefits of treatment options.31 Illustrations can significantly augment physician-patient communication and help patients participate actively in their treatment decisions.32 Patients can access calculators online and on mobile applications. Online risk calculations based upon our data are available (https://cmml-transplantscore.shinyapps.io/cmml-transplantscore/). These estimates allow clinicians and patients to establish information-based communication, thereby helping to explain the risks and benefits of an allo-SCT. Of note, the risk for NRM, especially in patients with high scores, should always be taken into account and balanced with life expectancy without transplantation and other treatment options.
We acknowledge several limitations. We cannot exclude the potential for bias in our model because we focused on CMML patients specifically screened for available information on genetics. In addition, we cannot exclude the possibility of residual confounding after threshold selection for BM blasts and mutational risk. However, previous studies and cross-validation confirmed the predictive ability of the proposed model. Conditioning regimens or intensity before transplantation were not associated with survival, and other treatment-related variables such as pretransplant therapies were not included in analyses to minimize selection and time bias.33,34 Importantly, the proposed CMML transplant score was associated with survival when stratified according to conditioning intensity (P < .001). Limited univariable comparisons of pretreatment in our cohort did not show differences in survival compared no treatment or treatment with hydroxyurea, hypomethylating agents, or other agents, in line with data from a recent randomized trial.35 More research is needed to clarify whether specific pretransplant therapies would improve outcome after transplantation.36,37 Furthermore, age was not associated with outcome, even after evaluating interactions including the age-adjusted comorbidity index and mutations,38 which overall were in line with previous analyses.24,25,37 Finally, as with any study of prognostic systems, the focus on 1 outcome, here OS, may limit translation into other outcomes. However, the proposed CMML transplant score was also associated with other secondary outcomes such as NRM and relapse-free survival (P < .001 for both). Relapse-free survival at 5 years according to risk group was 75% for a score of 0 to 1, 41% for a score of 2 to 4, 37% for a score of 5 to 7, 28% for a score of 8 to 10, and 14% for a score of >10 (supplemental Table 5; supplemental Figure 6).
Further improvements in the understanding of molecular genetics and posttransplant outcome are needed. They may be able to account for center heterogeneity and to capture the evolving management landscape and progress in transplantation techniques. Until then, implementation of our proposed simple and integrated CMML transplant score may facilitate patient counseling regarding probable benefits and risks after allo-SCT.
To request data, please send an e-mail to Nicolaus Kröger at nkroeger@uke.uni-hamburg.de.
Authorship
Contribution: N.G. and N.K. designed the study, gathered, analyzed, and interpreted data, and wrote the first draft of the manuscript; A.B. designed the panel, sequenced samples, performed variance analyses, and managed all samples for the study; F.S., C.R., H.B., A.R., V.P., R.B., M. Christopeit, M.R., and B.L.S. gathered data; A.B., D.W.B., R.B.S., F.S., C.R., H.B., A.R., V.P., R.B., M. Christopeit, Y.P., O.N., T.L., M.K., M. Corsten, M.H., J.F., G.K., U.P., M.R., and B.L.S. analyzed and interpreted data and wrote the manuscript; and all authors approved the final version of the manuscript.
Conflict-of-interest disclosure: The authors declare no competing financial interests.
Correspondence: Nicolaus Kröger, Department of Stem Cell Transplantation, University Medical Center Hamburg-Eppendorf, Martinistr 52, 20246 Hamburg, Germany; e-mail: nkroeger@uke.uni-hamburg.de.

