

Key Points
IL-6+ leukocytes in the TME of cHL correlate with inferior survival outcomes.
IL-6+ leukocytes and IL-6+ HRS cells lacked association with serum IL-6 levels.

Abstract
Interleukin-6 (IL-6) can induce therapeutic resistance for several cancer agents currently used to treat classical Hodgkin lymphoma (cHL). We aimed to investigate whether the presence of IL-6+ leukocytes and IL-6+ Hodgkin-Reed-Sternberg (HRS) cells in the tumor microenvironment (TME) was associated with adverse survival outcomes, expression of other immune markers, and serum IL-6 levels. We used a contemporarily treated cohort (n = 136), with a median follow-up of 13.8 years (range, 0.59-15.9 years). We performed immunohistochemistry with an IL-6 antibody on tissue microarrays from diagnostic biopsies of cHL patients. Patients with IL-6+ leukocytes ≥1% (n = 54 of 136) had inferior event-free survival (hazard ratio [HR] = 3.58; 95% confidence interval [CI], 1.80-7.15) and overall survival (HR = 6.71; 95% CI, 2.51-17.99). The adverse survival was maintained in multivariate Cox regression and propensity score-matched analyses, adjusting for well-known poor-prognostic covariates. The presence of IL-6+ HRS cells and high serum IL-6 levels were not associated with survival. IL-6+ leukocytes correlated with increased proportions of IL-6+ HRS cells (P < .01), CD138+ plasma cells (P < .01), CD68+ macrophages (P = .02), and tryptase-positive mast cells (P < .01). IL-6+ HRS cells correlated with increased proportions of CD68+ macrophages (P = .03), programmed death-ligand 1–positive (PD-L1+) leukocytes (P = .04), and PD-L1+ HRS cells (P < .01). Serum-IL-6 lacked correlation with IL-6 expression in the TME. This is the first study highlighting the adverse prognostic impact of IL-6+ leukocytes in the TME in a cohort of contemporarily treated adult patients with cHL.
Introduction
In classical Hodgkin lymphoma (cHL), malignant Hodgkin-Reed-Sternberg (HRS) in the tumor microenvironment (TME) sustain their survival through cytokine feedback loops with surrounding leukocytes.1,2 Even with the best available treatment, a significant percentage (10% to 30%) of cHL patients progress or relapse after first-line therapy.3 Approximately 50% of patients with disease relapse achieve subsequent long-term disease control with salvage therapies4 ; thus new prognostic factors and potential therapeutic opportunities are required.
Interleukin-6 (IL-6) is a small, 26 kDa, inflammatory cytokine5 targeted in clinical trials for multiple myeloma, solid cancers, and lymphomas.6,7 Intracellular IL-6 can promote treatment resistance for programmed death 1 (PD-1) inhibition in cancer cells8,9 and chemotherapy resistance for multiple drugs including doxorubicin and vinblastine, which are used in the treatment of cHL.10-15 Reports show that elevated serum IL-6 is associated with adverse clinical parameters like advanced disease in cHL.16-18 However, the source of serum IL-6 in cHL and its correlation to immune markers in the TME is unknown.2,16,18 Hence, there is a critical need to explore the survival implications of IL-6 in the TME of cHL and relate the findings to serum levels of IL-6.
High proportions of regulatory T cells (Tregs), mast cells, plasma cells,19-21 PD-1+ receptor leukocytes and programmed death-ligand 1–positive (PD-L1+) leukocytes22 in the TME of cHL are associated with poor prognosis. However, their association with IL-6 is still ambiguous.23 IL-6 RNA transcript, IL-6 protein, and IL-6 receptors have been identified in HRS cells, leukocytes, and stromal cells in the TME of cHL.1,2 However, previous investigations lack long-term prognostic end points, correlations to modern immune markers, and contemporarily treated adult patients.2
Using a cohort of contemporarily treated patients with long-term follow-up, we aimed to investigate whether IL-6+ leukocytes and IL-6+ HRS cells are associated with inferior survival outcomes and the following immune markers: PD-1, PD-L2, and PD-L1 expression; CD138+ plasma cells; Forkhead box P3 + (FOXP3+) Tregs; CD68+ macrophages; tryptase-positive mast cells; and granzyme B-positive activated lymphocytes. In addition, we investigated whether serum IL-6 correlated with IL-6 in the TME and prognostic outcomes.
Materials and methods
Ethical considerations
The study has ethical approval from the ethical review board (no. 2014/233) and ethical committee (no. 99-154) in Uppsala, Sweden, and was conducted in accordance with the Declaration of Helsinki.
Study patients and clinical variables
We included patients diagnosed with cHL in Sweden who participated in a multicenter population study conducted in Scandinavia between 1999 and 2002. The study, Scandinavian Lymphoma Etiology (SCALE), is described in detail elsewhere.24 Clinicopathological data such as clinical stage, according to Ann Arbor,25,26 erythrocyte sedimentation rate (ESR), International Prognostic Score (IPS) items,27 and survival data were retrieved from medical records. Detailed description of the following variables can be found elsewhere: CD138+ plasma cells,21 FOXP3+ Tregs,19 CD68+ macrophages,19 tryptase-positive mast cells,28 and granzyme B–positive activated lymphocytes.19
EBV analysis
Epstein-Barr virus (EBV) status was analyzed on HRS cells by immunohistochemical staining for EBV latent membrane protein-1 (LMP-1; Ventana Benchmark). Cases with negative or ambiguous test (n = 126) results were subjects for in situ hybridizations for EBV-encoded small RNAs (EBERs; Ventana Benchmark XT).29 A total of 133 cases were available for further analysis in the current study.
PD-1, PD-L1, and PD-L2 analysis
PD-1, PD-L1, and PD-L2 expression on leukocytes and HRS cells was scored with immunohistochemistry on TMA biopsies on an overlapping cohort, described elsewhere.22 Expression on HRS cells was assessed manually. Proportions were calculated by dividing the number of positive HRS cells by the total number of HRS cells. The proportions of PD-1+, PD-L1+, and PD-L2+ leukocytes were assessed using a digital image analysis system (Visiomorph; Visiopharm, Hørsholm, Denmark), and calculated by dividing the number of positive leukocytes by the total number of leukocytes.22
Serum IL-6
Pretreatment serum IL-6 was acquired via blood samples and analyzed in a central laboratory with the enzyme-linked immunosorbent assay method (Quantikine HS, high sensitivity; R&D Systems, Abingdon, Oxon, United Kingdom). The same technique and laboratory were used for all patients as well as healthy controls (n = 318) who were well characterized (details provided elsewhere).16,30 Data for a total of 88 cHL pretreated patients were available for further analysis and correlations with different variables within this cohort.
Tumor samples
All experiments were conducted at the Research and Development Unit of the Department of Clinical Pathology at Uppsala University Hospital, Uppsala, Sweden. Formalin-fixed paraffin-embedded tissues of diagnostic biopsies from 136 patients with cHL were used (Figure 1). Tissues with representative morphology containing HRS cells were scored, and cases with major discoloration, artifacts and fibrosis were excluded (Figure 1; n = 7). Tissue microarrays (TMAs) of 4-μm-thin sections were constructed by standard procedure technique.31 Each patient had between 2 and 4 representative tumor tissue cores with an area of 1 mm2 per core. Consistency between the representative nature of the core biopsies and whole tissue sections in terms of distribution of tumor-infiltrating leukocytes was confirmed for these study subjects in a previous investigation.32
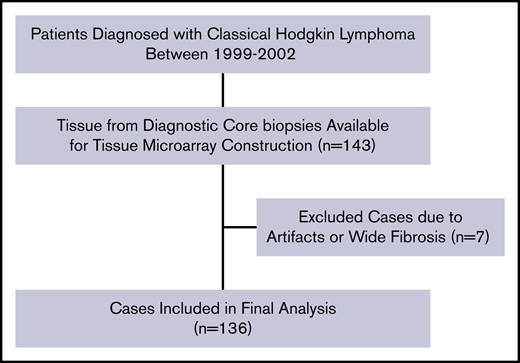
Patient selection flowchart for IL-6+leukocytes (n = 136). The same selection flow was used for the scoring of IL-6+ HRS (n = 130). TMA, tissue microarray.
Patient selection flowchart for IL-6+leukocytes (n = 136). The same selection flow was used for the scoring of IL-6+ HRS (n = 130). TMA, tissue microarray.
Immunohistochemistry
For antigen retrieval, Heat-Induced Epitope Retrieval with PT LLinker from Dako was used with low pH target solution (Dako/Agilent). A Dako automated staining system (Dako) was used for blocking, primary antibody incubation and antigen detection with the Dako EnVision Flex, High PH kit (K8000). A polyclonal rabbit antibody against human IL-6 was used, clone AHP1040 (Bio-Rad) diluted 1/2000. Counterstaining was done with Mayer hematoxylin (Mayers HTX Histolab Ab).
Immunohistochemistry assessment
Image analysis software (Visiomorph; Visiopharm) was used for tissue assessment. Two researchers, A.G. and P.H. (senior hematopathologist), analyzed the material blindly and independently. The image analysis software identified and calculated the cellular proportion of positive-stained cells in 4-6 high power fields (HPFs, 400 × [.0625 mm2]). The assessors manually controlled that the image analysis software correctly identified the immunostaining for every HPF. IL-6+ leukocytes in the TME of cHL were divided by the total number of leukocytes in the TME to give an IL-6+ leukocyte proportion score. IL-6+ HRS cells were divided by the total number of HRS cells in the TME to give an IL-6+ HRS cell proportion score.
Statistical analyses
General statistical considerations.
Nominal data between patient groups were compared with the χ2 test or Fisher exact test. The Shapiro-Wilk test was used for normality distribution analyses. Correlations between continuous variables with a nonnormal distribution were analyzed with the Spearman test (rho coefficient). Associations between a dichotomous and a continuous variable were examined using an unpaired 2-sample Wilcoxon test, also known as Mann-Whitney–Wilcoxon test. The R version 3.2.2 was used for all statistical analyses, and a 2-sided P value <.05 was considered statistically significant.
Survival analysis.
Overall survival (OS) was measured from diagnosis until death from any cause. Event-free survival (EFS) was defined from diagnosis until tumor relapse, disease progression, initiation of second-line therapy, or death from any cause. IL-6+ leukocyte and IL-6+ HRS cell sensitivity and specificity for predicting survival outcome were determined by analyzing area under the curve (AUC) in receiver operating characteristic (ROC) curves with associated P values, calculating AUC difference from .5. Propensity score matching (caliper level 0.2) was used to adjust for heterogeneity within the cohort with respect to unbalanced covariates between groups compared. The Kaplan-Meier method with the associated log-rank test was used to analyze time-to-event survival data. Cox regression was used to calculate the hazard ratio (HR), with the associated Wald test and 95% confidence interval (95% CI). Validation and diagnosis of proportional hazard assumptions were conducted and not violated. In multivariate Cox regressions, covariates with impact on survival in univariate Cox analyses at a level of P < .12 were included (supplemental Table 5).
Cutoffs for risk exposure and survival analysis
For IL-6+ leukocytes, the Youden index point was identified via ROC curves for identifying the optimal cutoff in regard to sensitivity and specificity for predicting overall survival. Different cutoffs of IL-6+ leukocyte proportions were also tested with Cox regression. For IL-6+ HRS cells, we defined risk exposure patients as previously described in Reynold et al2 with any presence of IL-6+ HRS cells in the TME. For serum IL-6, survival analysis was conducted with serum IL-6 as a continuous variable as it was used in Biggar et al.16
Results
Patient characteristics and treatment
The median age of the patients (n = 136) was 38 years (range, 18-74 years). Full patient characteristics are presented in Table 1. The median observation time was 13.8 years (range, 0.59-15.9 years). The treatment regimens used were in accordance with Swedish national guidelines (supplemental Table 1).33,34 Most patients, >80%, were treated primarily with doxorubicin, bleomycin, vinblastine, and dacarbazine (ABVD; 60%) or bleomycin, etoposide, doxorubicin, cyclophosphamide, vincristine, procarbazine, and prednisone (BEACOPP; 23%). Patients with stages I-IIA and selected patients with advanced disease (≥IIB) received consolidating radiotherapy. A small proportion of patients (<14%) was treated with cyclophosphamide, doxorubicin, vincristine, and prednisone (CHOP) or doxorubicin, bleomycin, vinblastine/doxorubicin, bleomycin, and vinblastine (ABV/MOPP). A few patients (n = 4) received involved-field radiotherapy as a single first-line treatment. Patients with disease relapse were treated with salvage chemotherapy, followed by autologous stem cell transplantation among eligible patients.
Patient characteristics
| Items | Entire cohort (N = 136), no. (%) | IL-6+ leukocytes, no. (%) | P | |
|---|---|---|---|---|
| ≥1% (n = 54) | <1% (n = 82) | |||
| Age, y | .02 | |||
| ≥45 | 40 (29) | 22 (41) | 18 (22) | |
| <45 | 96 (71) | 32 (59) | 64 (78) | |
| Missing | 0 (0) | 0 (0) | 0 (0) | |
| Sex | .98 | |||
| Male | 81 (60) | 32 (60) | 49 (60) | |
| Female | 55 (40) | 22 (40) | 33 (40) | |
| Missing | 0 (0) | 0 (0) | 0 (0) | |
| Stage | .07 | |||
| IA-IIA | 57 (42) | 17 (31) | 40 (49) | |
| IIB-IVB | 77 (57) | 36 (67) | 41 (50) | |
| Missing | 2 (1) | 1 (2) | 1 (1) | |
| B symptoms | .01 | |||
| Yes | 62 (46) | 32 (59) | 30 (37) | |
| No | 72 (53) | 21 (39) | 51 (62) | |
| Missing | 2 (1) | 1 (2) | 1 (1) | |
| IPS | .05 | |||
| >2 | 24 (18) | 15 (28) | 9 (11) | |
| <2 | 78 (57) | 29 (54) | 49 (60) | |
| Missing | 34 (25) | 10 (18) | 24 (29) | |
| EBV | .25 | |||
| Yes | 32 (24) | 16 (30) | 16 (20) | |
| No | 101 (74) | 37 (69) | 64 (78) | |
| Missing | 3 (2) | 1 (1) | 2 (2) | |
| ESR, ≥50 mm/h | <.01 | |||
| Yes | 53 (39) | 28 (52) | 25 (30) | |
| No | 71 (52) | 20 (37) | 51 (62) | |
| Missing | 12 (9) | 6 (11) | 6 (7) | |
| Albumin, <40 g/L | <.01 | |||
| Yes | 68 (50) | 36 (67) | 32 (39) | |
| No | 54 (40) | 15 (28) | 39 (48) | |
| Missing | 14 (10) | 3 (6) | 11 (13) | |
| WBC, ≥15 × 109 /L | .32 | |||
| Yes | 8 (6) | 5 (9) | 3 (4) | |
| No | 123 (90) | 46 (85) | 77 (94) | |
| Missing | 5 (4) | 3 (6) | 2 (2) | |
| Hb, <105 g/L | .68 | |||
| Yes | 17 (13) | 8 (15) | 9 (11) | |
| No | 104 (76) | 40 (74) | 64 (78) | |
| Missing | 15 (11) | 6 (11) | 9 (11) | |
| Lymph, <0.6 × 10⁹/L | .74 | |||
| Yes | 7 (4) | 2 (4) | 5 (6) | |
| No | 113 (89) | 48 (89) | 65 (79) | |
| Missing | 16 (7) | 4 (7) | 12 (15) | |
| Histological subtype | .21 | |||
| NS | 97 (71) | 34 (63) | 63 (77) | |
| MC | 24 (18) | 13 (24) | 11 (13) | |
| LC/ UC | 15 (11) | 7 (13) | 8 (10) | |
Test of independence was analyzed with the χ2 test or Fisher exact test.
EBV, Epstein-Barr virus; ESR, erythrocyte sedimentation rate; Hb, hemoglobin; IPS, International Prognostic Index; LC/UC, lymphocyte rich/depleted or unclassifiable; Lymph, peripheral lymphocyte count; MC, mixed cellularity; NS, nodular sclerosis; WBC, white blood count.
IL-6 immunohistochemistry and IL-6 expression in tumor cells and leukocytes
Immunohistochemistry staining patterns and cases are provided in Figure 2A-C. The consistency between the 2 independent assessors was high; only 2 cases were subject to reevaluation due to minor scoring differences. We found IL-6+ leukocyte proportions of ≥1% in 54 of 136 cases. Cases with IL-6+ HRS cells (48%; 63 of 130) and their proportion distribution are provided in Figure 2E. The majority of IL-6+ leukocytes had a lymphocyte morphology (>65%) or monocyte morphology (25%), and a few had plasma cell morphology (<10%) with a consistent proportional relationship in all cases. Higher IL-6+ HRS proportions correlated with higher proportions of IL-6+ leukocytes (rho = 0.49; P < .001).
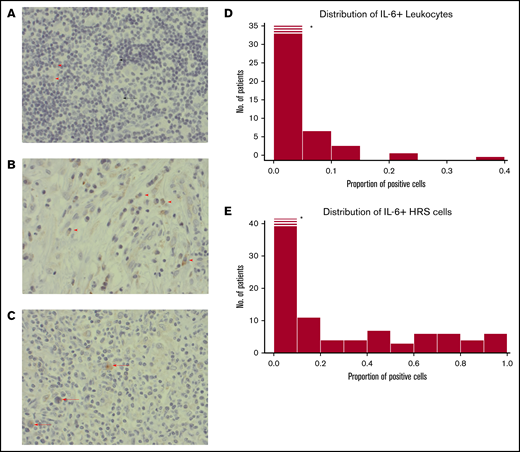
Histopathological images. (A) A case with weak staining of IL-6+ leukocytes (red arrowheads), and negative HRS cells (black arrow). (B) Example of a case with a high frequency of IL-6+ leukocytes (red arrow). No HRS cells in this image. (C) A case with several IL-6+ HRS cells (red arrowheads). (A-C) Immunohistochemical staining with IL-6 antibody; original magnification ×400. (D) Histogram for IL-6 scoring distribution for positive leukocytes. X-axis proportions of cells stained positive for IL-6 antibody in the TME of cHL. Y-axis, Frequency of patients. *The first bar is cropped for illustrative purposes. (E) The same as for panel D but for HRS cells. Histograms in panels D and E show a nonnormal distribution: the Shapiro-Wilk normality test (P = .001).
Histopathological images. (A) A case with weak staining of IL-6+ leukocytes (red arrowheads), and negative HRS cells (black arrow). (B) Example of a case with a high frequency of IL-6+ leukocytes (red arrow). No HRS cells in this image. (C) A case with several IL-6+ HRS cells (red arrowheads). (A-C) Immunohistochemical staining with IL-6 antibody; original magnification ×400. (D) Histogram for IL-6 scoring distribution for positive leukocytes. X-axis proportions of cells stained positive for IL-6 antibody in the TME of cHL. Y-axis, Frequency of patients. *The first bar is cropped for illustrative purposes. (E) The same as for panel D but for HRS cells. Histograms in panels D and E show a nonnormal distribution: the Shapiro-Wilk normality test (P = .001).
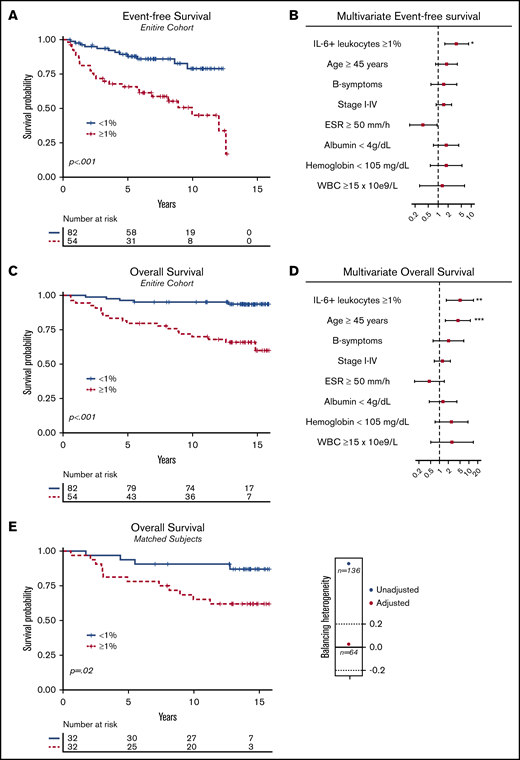
EFS and OS. (A) Kaplan-Meier with associated log-rank test for EFS for the entire cohort (P < .001; n = 136), comparing patients with a proportion of IL-6+ leukocytes ≥1% vs IL-6+ leukocytes <1%. (B) Forest plot for EFS performed with multivariate Cox regression (n = 107); 29 observations were deleted due to missing values in covariate variables. (C) The same as panel A, but for OS (n = 136; P < .001). (D) Forest plot as in panel B but for OS. (E) Kaplan-Meier for OS after propensity score matching with an illustration of unbalanced and balanced populations after adjustment (Caliper = 0.2). Adjusted items in the propensity score matching: age ≥45 years (yes/no); advanced-stage disease > IIB (yes/no); B symptoms (yes/no); albumin <4 g/L (yes/no); erythrocyte sedimentation rate (ESR) ≥50 mm/h (yes/no); IPS ≥2. After deleting missing values and balancing the covariates, a matched homogenous sample size of 32 of 32 (n = 64) was compared. WBC, white blood count.
EFS and OS. (A) Kaplan-Meier with associated log-rank test for EFS for the entire cohort (P < .001; n = 136), comparing patients with a proportion of IL-6+ leukocytes ≥1% vs IL-6+ leukocytes <1%. (B) Forest plot for EFS performed with multivariate Cox regression (n = 107); 29 observations were deleted due to missing values in covariate variables. (C) The same as panel A, but for OS (n = 136; P < .001). (D) Forest plot as in panel B but for OS. (E) Kaplan-Meier for OS after propensity score matching with an illustration of unbalanced and balanced populations after adjustment (Caliper = 0.2). Adjusted items in the propensity score matching: age ≥45 years (yes/no); advanced-stage disease > IIB (yes/no); B symptoms (yes/no); albumin <4 g/L (yes/no); erythrocyte sedimentation rate (ESR) ≥50 mm/h (yes/no); IPS ≥2. After deleting missing values and balancing the covariates, a matched homogenous sample size of 32 of 32 (n = 64) was compared. WBC, white blood count.
Associations with immune cells and clinical features
IL-6+ leukocyte proportions correlated with higher ESR (rho = 0.23; P = .04), CD138+ plasma cells (rho = 0.28; P < .01), CD68+ macrophages (rho = 0.21; P = .02), and tryptase-positive mast cells (rho = 0.23; P < .01) (supplemental Table 2). Also, IL-6+ leukocyte proportions were higher in patients with B symptoms (supplemental Table 3; P < .03). Full data and tested correlations are available in supplemental Tables 2 and 3. IL-6+ HRS cell proportions were associated with ESR (rho = 0.18; P = .04), CD68+ macrophages (rho = 0.21; P = .03), PD-L1+ HRS cells (rho = 0.27; P < .01), PD-L1+ leukocytes (rho = 0.19; P = .04), and patients with positive EBV status (P = .01). The presence of IL-6+ HRS cells and IL-6+ leukocytes did not correlate with the presence of FOXP3+ Tregs, PD-L2 expression, PD-1 expression, granzyme B–positive lymphocytes, clinical stage, sex, or histological subtype (supplemental Tables 2 and 3).
Survival implications
IL-6+ leukocytes, treated as a continuous proportion marker, were able to predict OS (supplemental Figure 1; AUC = .73; P < .001), with an optimal Youden index cutoff point at 1% (sensitivity = 79%; specificity = 69%). Different cutoffs with univariate and adjusted Cox regression also observed significant OS impact (supplemental Table 4). Patients with an IL-6+ leukocyte proportion of ≥1% (n = 54 of 136) compared with patients with an IL-6+ leukocyte proportion of <1% (n = 82 of 136) had inferior univariate EFS (Figure 3A; HR = 3.58; 95% CI, 1.80-7.15) and OS (Figure 3B; HR = 6.71; 95% CI, 2.51-17.99). When adjusting for confounding prognostic factors in a multivariate model, including age ≥45 years (yes/no) and B symptoms (yes/no), stage I-IV (ordinal rank), ESR ≥50 mm/h (yes/no), albumin <4 g/dL (yes/no), hemoglobin <105 mg/dL (yes/no), and white blood count (WBC) ≥15 × 109/L (yes/no), IL-6+ leukocyte proportions ≥1% had an independent adverse effect on EFS (Figure 3B; HR = 3.63; 95% CI, 1.59-8.30; P = .002) and OS (Figure 3D; HR = 4.96; 95% CI, 1.71-14.37; P = .003). Moreover, the adverse prognostic effect maintained significance for EFS (P = .01) and OS (Figure 3E; P = .02) after propensity score matching, adjusting for unbalanced covariates at baseline characteristics (Table 1). Furthermore, the inferior survival outcome of IL-6+ leukocytes ≥1% exposure was significant for patients treated with contemporarly regimens, ABVD/BEACOPP (supplemental Figure 2A; EFS [P < .001] and OS [P < .001]; n = 112). Full subgroup analysis of the survival effect stratified to treatment subgroups and disease stage is available in supplemental Figure 2.
IL-6+ HRS cells, as a continuous proportion marker, failed to predict OS (supplemental Figure 1; AUC = .60; P = .12). Also, patients with the presence of IL-6+ HRS cells (n = 67) were compared with patients lacking IL-6+ HRS cells (n = 63) regarding EFS (supplemental Figure 3A: HR = 1.83; 95% CI, 0.92-3.64; P = .08) and OS (supplemental Figure 3B: HR = 2.03; 95% CI, 0.86-4.7; P = .11).
Serum IL-6
The range and distribution of the pretreated serum IL-6 levels (in picograms per milliliter) showed nonnormal distribution (supplemental Figure 4A; n = 88, P < .001) (median = 5.0 pg/mL; mean = 23.6 pg/mL; range, 0.40-314 pg/mL). The median serum IL-6 in 318 healthy subjects previously described for this method in the same laboratory30 was 1.4 pg/mL (range, 0.25-23 pg/mL). ROC curves showed relatively low AUC values for both EFS and OS (supplemental Figure 4B-C), and serum IL-6 failed to have a significant prognostic impact on EFS (HR = 1.004; P = .20) and OS (HR = 1.002; P = .72). Serum IL-6 lacked correlation with IL-6 in the TME (supplemental Figure 4D-E). However, serum IL-6 levels correlated with increasing ESR (rho = 0.27; P = .02), decreasing serum albumin (rho, −0.28; P = .01) and increasing age (rho = 0.27; P < .01) (supplemental Table 2). Full data and tested correlations are available in supplemental Tables 2 and 3.
Discussion
We found that IL-6+ leukocyte proportions ≥1% were an independent marker for inferior EFS and OS and correlated with increased proportions of IL-6+ HRS cells (P < .01), CD138+ plasma cells (P < .01), CD68+ macrophages (P = .02 and tryptase-positive mast cells (P < .01). IL-6 HRS+ cells lacked significant survival implications but correlated with increased proportions of CD68+ macrophages (P = .03), PD-L1+ leukocytes (P = .04), and PD-L1+ HRS cells (P < .01). Serum IL-6 lacked significant prognostic implications and did not correlate with IL-6 expression and any investigated immune markers in the TME. This is the first study highlighting the adverse prognostic impact of IL-6+ leukocytes on contemporary treated adult patients with cHL, identifying a significant association between IL-6+ HRS cells and PD-L1 in the TME of cHL.
IL-6+ leukocytes and IL-6+ HRS cells
The distribution of IL-6+ leukocyte and IL-6+ HRS cell proportions in the TME (Figure 2) was comparable with previously reported data regarding IL-6 protein detection and IL-6 RNA expression in cHL.1,2 We observed IL-6 + HRS cells in 48% of the cases (28% in Reynolds et al2 ). Differences could be due to the different scoring methods and different antibodies used. IL-6+ leukocyte proportions were difficult to compare with other investigations due to the lack of detailed proportion distribution description for IL-6+ leukocyte cells.2
The IL-6 protein source within IL-6+ leukocytes and IL-6+ HRS cells is mainly believed to be from cellular protein synthesis; however, for IL-6+ HRS cells, paracrine uptake has also been described.1,35 In tumor tissue, lymphocytes and monocytes secrete IL-6,1,2,36 whereas healthy plasma cells mostly lack expression of IL-6 mRNA and IL-6 protein,37-39 consistent with the current study, in which most IL-6+ leukocytes had lymphocyte and monocyte morphology.
Associations with immune markers and clinical parameters
The correlation between IL-6+ HRS cells and IL-6+ leukocytes suggests that IL-6 HRS+ cells and IL-6+ leukocytes attract each other and develop paracrine feedback loops, which have been speculated as a critical tumor survival mechanism.1,40,41 The correlation of IL-6+ leukocytes and CD138+ plasma cells is consistent with the ability of IL-6 to support plasma cell differentiation and survival.39,42 CCL5 can induce IL-6 production,43 and can, in turn, recruit mast cells in cHL44 as well as macrophages during inflammation,45 which further supports the correlation observed between IL-6 expression and CD68+macrophages and tryptase-positive mast cells in the current study. We could unfortunately not assign which phenotype of macrophages this correlation was reflecting. Studies have shown that IL-6 can promote the polarization of macrophages to a suppressive (M2) phenotype.46 Even though it is suggested that IL-6 can downregulate Tregs,47 we did not see any correlation between Tregs or IL-6+ HRS cells and IL-6+ leukocytes. IL-6+ HRS cells, IL-6+ leukocytes, and serum IL- 6 correlated with ESR, in line with the established association between IL-6 and increased acute-phase proteins.5,48 IL-6+ HRS cell association with EBV+ cases could be explained by the ability of EBV-associated latent membrane protein 1 (LMP1) to induce IL-6 production.49 Interestingly, IL-6+ HRS cells correlated with PD-L1 expression in HRS cells and leukocytes, aligned with reports showing that IL-6 can induce PD-L1 in immune cells.50,51
Serum IL-6
There are several studies on serum IL-6 in cHL.16-18,52,53 All of these reports request an unmet need to investigate the source of elevated IL-6. Serum IL-6 can be elevated years before the development of cHL,54 and even though HRS cells produce IL-6 in a paracrine and autocrine manner,1 it still unknown whether the increased serum IL-6 in cHL is derived from HRS cells or leukocytes in the TME or activated lymphocytes/monocytes in the circulating blood, reacting to HRS cells54 or circulating DNA.55,56 A direct correlation analysis between the percentage of IL-6+ cells and serum-IL-6 levels has limitations. The quantity of IL-6 production can be independent of the percentage of IL-6+ cells and rely on their proximity to vessels and secretory ability, which we did not measure in this cohort. Notably, we did not find any correlation between serum IL-6 and CD138+ cells or other immune markers in the TME.
Previous investigations show significant associations between serum IL-6 and the presence of B symptoms,16 decreased hemoglobin,57 advanced-stage disease, and survival end points.16 The lack of significant correlation to these variables in the current study could be due to the low number of patients in this study (n = 88) with available pretreatment serum IL-6. However, we observed a significant correlation between serum IL-6 and decreasing albumin, and increasing ESR, in line with the inclination that elevated serum IL-6 correlates with clinical patterns expected during chronic inflammation.16-18,57
Survival implications of IL-6 in the TME
IL-6+ HRS cells did not have significant survival implications, whereas the presence of IL-6+ leukocytes had a significant adverse prognostic impact. The results maintained significance for contemporary-treated subgroups and adjusted analysis, indicating that the survival implications were not likely due to other prognostic factors. The prognostic implications were observed already with relatively low proportions of IL-6+ leukocytes ≥1% (supplemental Figure 4) but were also seen with increasing cutoff levels. Previous studies on multiple myeloma indicate that between 1 and 2 cells of IL-6–producing cells in proximity to tumor cells are sufficient to promote tumor progression.36
Although this was a moderately sized study, our results are in line with recent evidence generation. A study of 110 pediatric Hodgkin lymphoma patients58 found that IL-6+ leukocytes were an independent prognostic factor for inferior survival, consistent with the findings in this study. However, the study lacked adult patients and important clinical prognostic markers. An investigation from 2002 (n = 97) analyzed IL-6 expression in the TME of adult cHL. Reynolds et al2 reported that cases with IL-6+ HRS cells had a nonsignificant adverse impact on the prognostic outcome, congruent with our observations. However, they did not find any significant correlations between nonmalignant IL-6+ cells and their study variables; in-depth data regarding the analysis were not provided.2 The differences in the survival analysis outcome could be the moderate size of patient samples in both studies and lack of long-term follow-up time in Reynolds et al.2 Moreover, in Reynolds et al,2 the study subjects received outdated treatment regimens not used in modern clinical settings. Because IL-6 can induce chemoresistance for multiple drugs,10-15 their study could miss any indirect therapeutic-resistance mechanism of IL-6 in the TME for patients treated with ABVD/BEACOPP.2,59 Most patients in our study were treated with what are still considered to be contemporary first-line therapies, for example, ABVD and BEACOPP.34,59
Translational relevance and mechanism of action
IL-6 cytokine downstream signaling pathways include mainly JAK/STAT3, phosphatidylinositol-3 kinase (PI3K)/protein kinase B (Akt), and Ras-MAPK.1,7,60 These pathways induce upregulation of several genes that promote tumor progression1,7,60 and chemotherapy resistance.10-15 The interest in IL-6 derived from nonmalignant cells in the TME has recently increased. One report showed that IL-6 produced by cancer-associated fibroblasts in prostate cancer inhibits doxorubicin-induced cell death.12 Another report in lung cancer cell lines showed that IL-6–producing nonmalignant cells are a predictor for tumor control with IL-6 blockade.61 Moreover, several emerging oncologic clinical studies are targeting IL-6–activated downstream pathways.7 Inhibition of the PI3K pathway is currently undergoing a phase 2 clinical trial for relapsed cHL.62 Interestingly, intracellular IL-6 has been shown to induce PI3K blockade resistance in different lymphomas.63 Thus, together with current study results, these findings suggest that IL-6 in the TME is an important potential predictive marker in future therapeutic approaches targeting IL-6–associated pathways in cHL. Additionally, there is an unmet need to identify good-risk patients and refractory patients for PD-1 inhibitors in cHL.64 Recent reports show that IL-6 can induce PD-L1 expression in immune cells50,51 and induce treatment resistance for PD-1/PD-L1 inhibition.8,9 Furthermore, simultaneous blockade of PD-1 and IL-6 pathway shows promising results for overcoming PD-1/PDL-1 inhibition resistance.9 Our study is the first to identify a correlation between PD-L1 expression and IL-6+ HRS cells in a clinicopathological setting in cHL, which further opens research opportunities to improve personalized medicine in cHL.
Study limitations and strengths
The study is of moderate size (n = 136) and would benefit from an external validating cohort. The strengths of our cohort include long-term follow-up, contemporary treatments, and access to multiple potential prognostic variables, as well as multiple immune markers. Even though propensity score matching and multivariate Cox regression are great tools for adjusting for covariate differences between groups, our investigation was retrospective in nature, and therefore still vulnerable to unknown confounding factors. Moreover, there is an increased risk of generating false-positive results with multiple testing65 and using several covariates in Cox regression.66 However, to minimize this error, we only selected covariates with prognostic relevance to increase the accuracy of the multivariate Cox regression analysis. To minimize interpersonal pitfalls in immunohistochemistry assessments and increase the reproducibility of the study, we used image analysis software with excellent concordance between 2 independently blinded researchers (A.G. and senior hematopathologist P.H.). An important question is whether the TMA core biopsies analyzed in this study represent the full nature of the tumor, particularly in cancer with heterogenic TME.67 A critical strength of this study is that the TMA biopsies had previously been validated regarding their concordance compared with whole-tissue sections.32
Conclusions
This study provides new evidence regarding IL-6+ HRS cell and IL-6+ leukocyte prognostic and clinicopathological implications and their correlations to several immune cells and PD-L1 in the TME. In a contemporarily treated cohort with long follow-up, IL-6+ leukocytes were an independent marker for inferior EFS and OS and correlated to key clinical parameters and immune cells in the TME. IL-6+ HRS cells lacked significant prognostic value but correlated with higher IL-6+ leukocyte proportions and PD-L1 expression. Serum IL-6 lacked association with IL-6+ leukocytes+ and IL-6+ HRS cells. These findings open new investigational opportunities in the era of emerging therapies targeting IL-6–associated pathways.
For data sharing, please contact the corresponding author, Alex Reza Gholiha, at alex.gholiha@gmail.com.
Acknowledgments
The authors give special thanks to Anders Berglund in medical epidemiology and biostatistics, and senior medical statistic consultant at Statistikakademin, for discussions and statistical calculations.
Authorship
Contribution: A.R.G. designed the study, performed the research, analyzed the data, and wrote the paper; P.H., R.-M.A., and G.E. designed the study, conducted research, and guided and reviewed the production of the manuscript; D.M., I.G., K.E.S., H.H., J.H., and G.H. designed the study and reviewed and revised the primary data and the manuscript; and all authors approved the manuscript and the interpretation of the data.
Conflict-of-interest disclosure: The authors declare no competing financial interests. A.R.G. is an employee of Novocure. I.G. received honoraria from Janssen Cilag. D.M. received honoraria from Roche, Merck, Bristol Myers Squibb, and Takeda. All collaborations were unrelated to the current study.
Correspondence: Alex Gholiha, Experimental and Clinical Oncology, Department of Immunology, Genetics and Pathology, Uppsala University, SE-751 85 Uppsala, Sweden; e-mail: alex.gholiha@gmail.com.

