

Key Points
At CML diagnosis, additional chromosomal lesions beyond the Ph translocation confer a higher risk of later disease progression.
The adverse effect of these lesions is independent of the widely used Sokal and ELTS risk scores.

Abstract
At diagnosis of chronic-phase chronic myeloid leukemia (CML), there are conflicting data as to whether additional cytogenetic abnormalities (ACAs) beyond a standard Philadelphia (Ph) translocation confer a higher risk of subsequent disease progression. In the United Kingdom SPIRIT2 trial comparing imatinib 400 mg daily with dasatinib 100 mg daily, diagnostic karyotypes were available in 763 of the 814 patients recruited. Of these, 27 had ACAs in either/both the original 4 major route group (trisomy 8 or 19, iso17q or a second Ph) or the 5 additional lesions recently described (trisomy 21, 3q26.2, monosomy 7/7q−, 11q23, and complex karyotypes), and their progression rate was significantly higher (22.2%) than in patients without one of these ACAs (2.2%; P < .001). Patients with ACAs had worse progression-free survival (PFS; hazard ratio [HR], 5.21; 95% confidence interval [CI], 2.59-10.50; P < .001) and freedom from progression (FFP; HR, 12.66; 95% CI, 4.95-32.37; P < .001) compared with patients without ACAs. No association was seen between the Sokal or European Treatment and Outcome Study long-term survival (ELTS) scores and the presence of ACAs. Univariate analysis showed that higher Sokal and ELTS scores and the presence of ACAs were associated with poorer PFS, though only ACAs and high-risk ELTS scores were associated with poorer FFP. Multivariable models identified both the Sokal/ELTS score and ACAs as significant independent factors for PFS but only ELTS score and ACAs as significant independent factors for FFP. The data support the view that certain ACAs are predictive of disease progression independently of Sokal or ELTS scores.
Introduction
In chronic myeloid leukemia (CML), disease progression to blast crisis may be accompanied by additional cytogenetic abnormalities (ACAs) beyond the standard t(9;22) Philadelphia (Ph) translocation. The most common new lesions include trisomy 8, an additional Ph translocation, isochromosome 17q, and trisomy 19.1-3 However, the prognostic significance at chronic phase diagnosis of these 4 “major route” lesions for disease progression is less clear. Although emerging clones may be transient and not associated with disease progression,4 early reports correlate the appearance of ACAs with clinical deterioration,5 and patients with ACAs present at diagnosis had a shorter survival.6
Since the advent of tyrosine kinase inhibitor (TKI) therapy, progression is much less common, and the significance of ACAs is less clear. ACAs emerging during imatinib treatment may be an independent adverse survival factor,7 and patients on imatinib following interferon failure who developed ACAs are at increased risk of hematological relapse.8 The significance of certain ACAs emerging during treatment was confirmed in a 2326-patient study,9 which identified several adverse ACAs beyond the original 4 major route lesions. However, the significance of ACAs already present at initial diagnosis is not as well characterized. In the German/Swiss CML 4 study, the 4 major route ACAs at diagnosis correlate with poor survival and a sixfold increased risk of disease progression.10,11 However, this adverse effect was not confirmed in a study of TKIs in chronic phase,12 and clonal evolution did not alter overall and event-free survival (EFS) in second-generation TKI recipients.13 The CML 4 study identified 5 additional lesions (trisomy 21, 3q26.2, monosomy 7/7q−, 11q23, and complex karyotypes) beyond the 4 major route lesions, which also confer an increased risk of death from CML.14 Current European LeukemiaNet recommendations suggest that any of these 9 lesions should be regarded as increasing the risk of disease progression,15 and the National Comprehensive Cancer Network guidelines also recommend close follow-up of patients with ACAs.16 However, only ∼3% of patients have ACAs at diagnosis, and further studies are needed to confirm the predictive value of ACAs and their independence from other progression risk factors.
Several scores derived from simple demographic and diagnostic data can predict survival,17-19 including the European Treatment and Outcome Study long-term survival (ELTS) score, derived from a large TKI-treated population and examining parameters associated with death from CML, and validated in several large independent cohorts.20-22
Here, we present details of diagnostic ACAs and their significance in the recent SPIRIT2 study, focusing on the 9 lesions described above, and correlate these with the Sokal and ELTS scores.
Patients and methods
The SPIRIT2 clinical trial recruited 814 newly diagnosed patients with chronic-phase CML between 2008 and 2013 across 146 United Kingdom (UK) sites (www.clinicaltrials.gov; study identifier #NCT01460693). It was approved by the National Research Ethics Committee (London Central Office) and the UK Medicines and Healthcare Products Regulatory Agency. Informed consent was obtained from patients prior to their inclusion. The study was sponsored by Newcastle Hospitals National Health Service (NHS) Trust.
Patients were randomized 1:1 to either dasatinib 100 mg or imatinib 400 mg, each once daily, and followed up monthly for 3 months, every 3 months until 12 months, and then every 6 months until 5 years or therapy change due to either intolerance or resistance, as described elsewhere.23 On each occasion, the BCR-ABL1:ABL1 ratio was assessed centrally (Imperial College Healthcare NHS Trust). The primary end point was 5-year EFS.
On entry, marrow cytogenetics with G-banding were carried out. Since recording the components of the various prognostic scoring systems was not mandatory at trial entry, 308 of the 763 patients with available diagnostic cytogenetics could not be allocated Sokal or ELTS scores.
Definitions of outcome end points
Progression-free survival (PFS) was defined as the time from trial entry to disease progression to either accelerated phase or blast crisis or death from any cause, whichever was earlier. Freedom from progression (FFP) was defined as the time from entry to progression alone. Times from entry to molecular response (MR) end points MR2 (<1% BCR-ABL1), MR3 (<0.1% BCR-ABL1), MR4 (<0.01% BCR-ABL1). and MR4.5 (<0.0032% BCR-ABL1) were also examined.
Statistical analysis
Survival analysis was performed for PFS, FFP, and time to molecular end points. Survival distributions were estimated using the Kaplan-Meier method and compared between the subgroups of interest with the log-rank test. Cox proportional hazard regression was used to explore the prognostic factors in both univariable and multivariable settings, where backward selection based on the Akaike information criterion was used for selecting the best model.24 The Cox models results are presented as hazard ratios (HRs) with 95% confidence intervals (CIs) alongside the coefficient estimate with its standard error. The proportional hazard assumption was assessed via the Schoenfeld residuals.25 Patients with ACAs and progression were summarized as frequencies of counts and percentages and compared using Fisher’s exact test. Associations between Sokal or ELTS scores and ACAs were explored with Fisher’s exact or Wilcoxon-Mann-Whitney tests. A 5% significance level was used to determine statistical significance. All analyses were performed using R version 3.5.1 and STATA v.15 (StatCorp, College Station, TX).
Results
SPIRIT2 recruited 814 patients, but 2 never received their allocated drug (1 incorrect diagnosis, 1 consent withdrawal) and are excluded. Table 1 presents diagnostic cytogenetic data for 812 patients, with rates of disease progression. Overall, 23 patients progressed (12 received dasatinib and 11 imatinib). Diagnostic cytogenetics were unavailable in 49 patients (1 with progression and 48 without progression). Of 763 patients with cytogenetic data, 640 had a single t(9;22) Ph translocation only, and 15 (2.3%) of these patients progressed. Fifty-five patients (one of whom progressed) had a 3-way variant Ph translocation, and 5 patients had a 4-way variant Ph (one of whom also had a 3-way Ph variant). Seventeen of 467 male patients with available diagnostic cytogenetics had Y chromosome loss; none of these patients progressed. Although trial entry required Ph positivity, 6 cytogenetically normal (but BCR-ABL1-positive) patients were inadvertently recruited; none of these patients progressed.
Diagnostic karyotypic data for 812 assessable patients according to whether they progressed
| Lesion | No progression | Progression | Percentage progressing |
|---|---|---|---|
| Normal (no Ph) | 6 | 0 | |
| Ph only | 625 | 15 | 2.3 |
| 3-way Ph* | 54 | 1 | 1.9 |
| 4-way Ph* | 5 | 0 | |
| Loss of Y | 17 | 0 | |
| Original major route lesion | 14 | 3 | 17.6 |
| Trisomy 8 | 5† | 2‡ | |
| Additional Ph | 3 | 1‡ | |
| Isochromosome 17q | 6 | 1 | |
| Trisomy 19 | 1† | 0 | |
| Additional lesions | 9 | 5 | 35.7 |
| Trisomy 21 | 0 | 0 | |
| 3q26.2 lesion | 0 | 1 | |
| Monosomy 7/7q− | 2§ | 0 | |
| 11q23 lesion | 2 | 1 | |
| Complex karyotype | 7§ | 3§ | |
| Other lesion | 20 | 0 | |
| Total unique patients† | 741 | 22 | 2.9 |
| Karyotype unavailable | 48 | 1 | 2.0 |
Two patients of the original 814 who never received trial drug are excluded.
One patient had both a 3-way and a 4-way Ph translocation.
One nonprogressing patient had both trisomy 8 and trisomy 19.
One progressing patient had both trisomy 8 and a second Ph translocation.
Of patients with complex karyotypes, 2 nonprogressing patients also had monosomy 7 (one of whom also had isochromosome 17q); furthermore, 1 patient without progression had trisomy 8 and 19, and 2 progressing patients also had trisomy 8 (one of whom had a second Ph translocation as well).
Table 1 provides details of the observed ACAs. Seventeen patients had ≥1 of the 4 major route lesions described above (2 patients had 2 such lesions each, detailed in the legend to Table 1), and of these, 3 patients (17.6%) progressed. Similarly, 14 patients had ≥1 of the 5 additional lesions described by Hehlmann et al,14 of whom 5 (35.7%) progressed. These are hereafter labeled the “original major route” and the “additional lesions” groups.
Effect of ACAs on progression and time to MR
Of the 736 patients without any of the 9 original major route or additional lesion ACAs, 16 (2.2%) progressed. Table 2 shows that progression is higher with original major route lesions (17.6%; P = .011), with additional lesions (35.7%; P < .001), and in the 27 patients with ≥1 of the 9 lesions (22.2%; P < .001). In the 6 patients with ≥1 of these 9 ACAs who progressed, 3 had received imatinib and 3 dasatinib.
Progression rates according to presence or absence of ACAs at diagnostic cytogenetics
| Group | No progression | Progression | Percentage progressing | P |
|---|---|---|---|---|
| Original major route lesion | ||||
| Yes | 14 | 3 | 17.6 | .011 |
| No | 727 | 19 | 2.5 | |
| Additional lesions | ||||
| Yes | 9 | 5 | 35.7 | <.001 |
| No | 732 | 17 | 2.3 | |
| Combined group | ||||
| Yes | 21 | 6 | 22.2 | <.001 |
| No | 720 | 16 | 2.2 |
Original major route and additional lesions groups are as defined in Table 1 and the text. The combined group comprises patients with ≥1 of any of the 9 lesions in either the original major route or the additional lesions group. P values were evaluated by Fisher’s exact test.
Figure 1 shows the 5-year PFS for patients with an original major route lesion is 67% (95% CI, 38-85), which is significantly worse than the 91% (95% CI, 89-93; P < .001) in patients without such lesions (Figure 1A). Figure 1B-C gives similar results for additional lesions (60% [32-80] vs 91% [89-93]) and these groups combined (68% [46-83] vs 92% [89-93]). Median survival was not reached in any ACA group. However, the 71 PFS events are dominated by the 49 deaths without progression, from causes unrelated to CML. Figure 2 therefore shows the FFP, in which the only event is progression, stratified as for Figure 1. Each panel again shows that ACAs confer significantly worse FFP (80% [51-93] vs 97% [96-98] for original major route lesions [Figure 2A], 66% [36-84] vs 97% [96-99] for additional lesions [Figure 2B], and 76% [54-88] vs 98% [96-99] for these groups combined [Figure 2C]). Original major route lesions, additional lesions, or these combined had no effect on the time to MR2, MR3, MR4, or MR4.5 (data not shown).
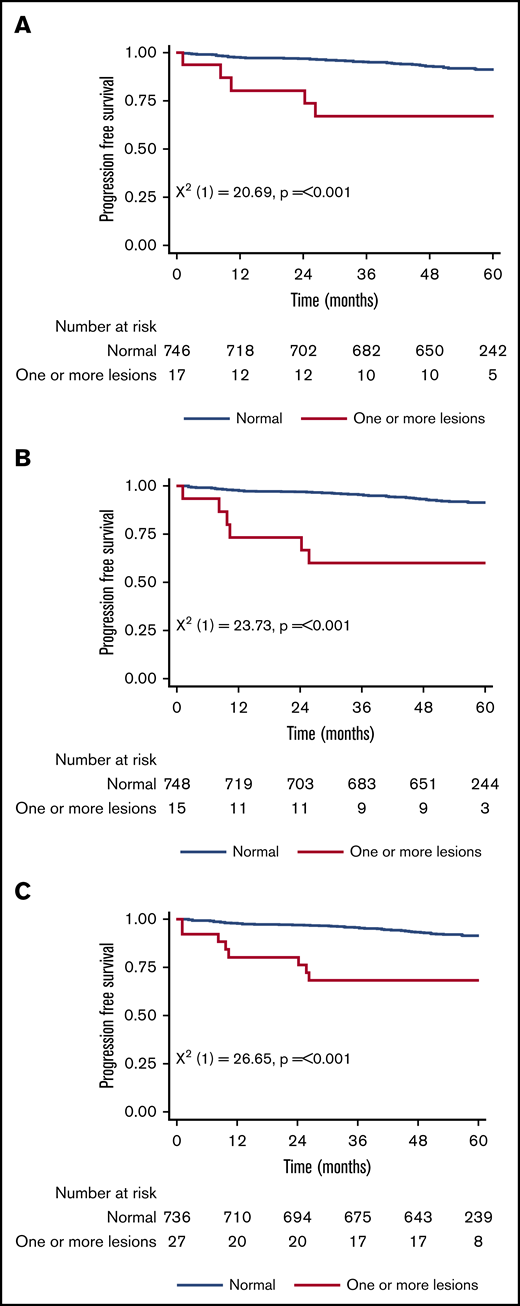
Patient PFS. Stratified by presence/absence of original major route ACAs (A), additional lesions (B), and combined 9 lesions (C).
Patient PFS. Stratified by presence/absence of original major route ACAs (A), additional lesions (B), and combined 9 lesions (C).
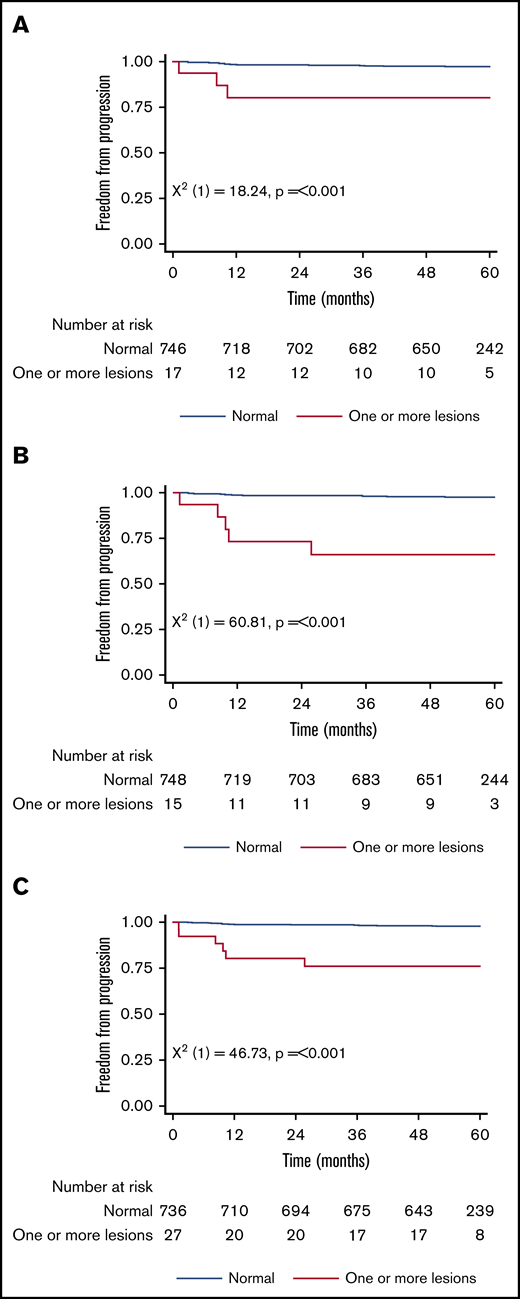
Patient FFP. Stratified by presence/absence of original major route ACAs (A), additional lesions (B), and combined 9 lesions (C).
Patient FFP. Stratified by presence/absence of original major route ACAs (A), additional lesions (B), and combined 9 lesions (C).
ACAs do not correlate with Sokal or ELTS score
Sokal and ELTS scores were available in 455 of the 763 patients with diagnostic cytogenetics. Of these, 167 patients had low, 168 had intermediate, and 120 had high Sokal scores. Supplemental Figure 1A shows a significant difference in the PFS among these 3 groups, though no difference was seen in FFP (data not shown). However, no association was seen between the presence/absence at diagnosis of original major route lesions, additional lesions, or these combined and the Sokal score when expressed either as categorical variables (low/intermediate/high; Fisher’s exact test) or as a continuous variable (Wilcoxon-Mann-Whitney test). Similarly, 252 patients had low, 137 had intermediate, and 66 had high ELTS scores, and there is a significant difference in both the PFS (supplemental Figure 1B) and FFP (data not shown) among these risk groups. However, again, no association was seen between the presence/absence of original major route lesions, additional lesions, or these combined and the ELTS score expressed either as categorical or continuous variable (Wilcoxon-Mann-Whitney test).
Both ACAs and Sokal/ELTS scores independently predict PFS
Although no association was seen between Sokal or ELTS scores and either original major route or additional lesion ACAs (or these combined), the ability of each of these to independently predict PFS was tested by univariate Cox regression. Table 3 shows that all 5 variables were predictive of PFS. They were then examined in multivariable models using ACAs summarized as combined lesions to maximize occurrences and thus provide more accurate estimates than separate ACA groups. The results for the models are given in Table 3 (using combined lesions and Sokal score as covariates and combined lesions and ELTS score). In both cases, the model including the lesions and the score was selected as best model, indicating that both the Sokal/ELTS score and combined lesions are independent predictive factors of PFS.
Cox regression examining the effect of scoring systems and ACAs on predicting PFS
| Covariate | Score levels | Estimate (SE) | HR (95% CI) | P |
|---|---|---|---|---|
| Univariate analysis | ||||
| Sokal score | Low | Reference | Reference | |
| Intermediate | 0.91 (0.418) | 2.49 (1.091, 5.624) | .03 | |
| High | 0.99 (0.438) | 2.68 (1.137, 6.325) | .024 | |
| ELTS score | Low | Reference | Reference | |
| Intermediate | 1.15 (0.383) | 3.15 (1.488, 6.676) | .003 | |
| High | 1.63 (0.403) | 5.11 (2.32, 11.276) | <.001 | |
| Original major route lesions | No lesions | Reference | Reference | — |
| Lesions | 1.8 (0.526) | 6.03 (2.149, 16.9) | .001 | |
| Additional lesions | No lesions | Reference | Reference | — |
| Lesions | 1.57 (0.526) | 4.85 (1.711, 13.449) | .003 | |
| Combined group | No lesions | Reference | Reference | — |
| Lesions | 1.61 (0.441) | 5.0 (2.106, 11.872) | <.001 | |
| Multivariable Cox regression model (Sokal score) | ||||
| Combined lesions | No lesions | Reference | Reference | — |
| Lesions | 1.55 (0.442) | 4.73 (1.989, 11.252) | <.001 | |
| Sokal score | Low | Reference | Reference | — |
| Intermediate | 0.86 (0.419) | 2.37 (1.044, 5.395) | .039 | |
| High | 0.96 (0.438) | 2.62 (1.1, 6.18) | .028 | |
| Multivariable Cox regression model (ELTS score) | ||||
| Combined lesions | No lesions | Reference | Reference | — |
| Lesions | 1.48 (0.443) | 4.37 (1.836, 10.427) | .001 | |
| ELTS score | Low | Reference | Reference | — |
| Intermediate | 1.09 (0.384) | 2.99 (1.408, 6.342) | .004 | |
| High | 1.59 (0.404) | 4.92 (2.23, 10.868) | <.001 |
SE, standard error.
ACAs and the ELTS score, but not the Sokal score, predict FFP
The predictive value of the scores and ACAs on FFP is given in Table 4, which shows that in univariate analysis, the Sokal score was not predictive of FFP, but original major route lesions, additional lesions, and these combined were all related to poorer FFP, and high ELTS scores were associated with inferior FFP when compared with low ELTS scores. In multivariable models, adding the Sokal score did not improve the predictive value of combined lesions, but both the ELTS score and combined lesions were independent predictive factors for FFP.
Cox regression examining the effect of scoring systems and ACAs on predicting FFP
| Covariate | Score levels | Estimate (SE) | HR (95% CI) | P |
|---|---|---|---|---|
| Univariate analysis | ||||
| Sokal score | Low | Reference | Reference | |
| Intermediate | 0.28 (0.764) | 1.32 (0.296, 5.9) | .716 | |
| High | 1.2 (0.69) | 3.31 (0.856, 12.806) | .083 | |
| ELTS score | Low | Reference | Reference | |
| Intermediate | 0.86 (0.671) | 2.35 (0.632, 8.764) | .202 | |
| High | 1.61 (0.671) | 5.0 (1.341, 18.604) | .017 | |
| Original major route lesions | No lesions | Reference | Reference | — |
| Lesions | 2.15 (0.764) | 8.56 (1.915, 38.304) | .005 | |
| Additional lesions | No lesions | Reference | Reference | — |
| Lesions | 2.45 (0.652) | 11.6 (3.233, 41.612) | <.001 | |
| Combined group | No lesions | Reference | Reference | — |
| Lesions | 2.42 (0.592) | 11.21 (3.512, 35.754) | <.001 | |
| Multivariable Cox regression model (Sokal score) | ||||
| Combined lesions | No lesions | Reference | Reference | — |
| Lesions | 2.32 (0.596) | 10.22 (3.18, 32.833) | <.001 | |
| Sokal score | Low | Reference | Reference | — |
| Intermediate | 0.19 (0.765) | 1.21 (0.27, 5.412) | .805 | |
| High | 1.06 (0.694) | 2.89 (0.741, 11.24) | .127 | |
| Multivariable Cox regression model (ELTS score) | ||||
| Combined lesions | No lesions | Reference | Reference | — |
| Lesions | 2.23 (0.599) | 9.33 (2.886, 30.153) | <.001 | |
| ELTS score | Low | Reference | Reference | — |
| Intermediate | 0.73 (0.674) | 2.08 (0.556, 7.804) | .276 | |
| High | 1.42 (0.678) | 4.14 (1.096, 15.636) | .036 |
Discussion
Data from the German/Swiss CML 4 trial suggest that certain ACAs at diagnosis might identify patients at high risk of progression. Additional data on this are needed from large trials. The present data from the recent 814-patient UK SPIRIT2 study may therefore be helpful. The progression rate at the end of follow-up in the 27 patients with ≥1 of the 9 lesions identified in CML 410,11,14 is ∼10-fold higher, at 22.2%, and PFS is significantly worse than in patients without these lesions. This finding is broadly similar to CML 4 and supports the notion that the 9 ACAs reported in CML 4 represent a group of adverse ACAs. Although 20 further patients (listed as “other” in Table 1) had an additional cytogenetic lesion beyond Ph, these additional lesions were all unique (except for 47 XYY in 2 of the 467 male cases; this is typically constitutional, but this was not investigated here). We cannot therefore determine whether further ACAs might also confer useful information about outcome, despite the size of the present study. Meta-analyses across several studies will be needed to address this question.
Secondly, the presence of ACAs is not correlated with the Sokal or ELTS score, suggesting that ACAs may give additional information beyond simple demographic and diagnostic hematological data. Multivariable models confirm that for predicting progression, a high ELTS score (though not the Sokal score) may add to the value of ACAs. A composite score combining ACAs with ELTS score might give a more powerful prediction of progression, but we cannot determine this, because despite 812 assessable entrants, there were only 22 progressions with a diagnostic karyotype.
As there are more than twice as many non-CML deaths as progressions (49 vs 22), we have also reanalyzed the FFP data using non-CML death as a competing risk. The statistically significant differences for the cumulative incidence of progression remain unchanged for the original 4 major route lesions, the 5 additional lesions, and the combined 9 ACAs. Similarly, the univariate analyses are unchanged, and furthermore, the multivariable modeling produces the same findings, namely that in the model including “combined” ACAs and Sokal score, only the combined ACA was predictive of progression, but in the model including combined ACAs and ELTS score, both the ACA and the ELTS score were statistically significant predictors.
The emergence of ACA in Ph-negative cells (ie, clonal cytogenetic evolution) may occasionally occur during TKI treatment.26-31 The most common abnormalities include trisomy 8 and loss of the Y chromosome. In the initial version of the SPIRIT2 protocol, repeat marrow cytogenetics were requested at 12 and 24 months, but these proved unpopular in patients with adequate MRs, similar to other contemporary studies, and were abandoned midtrial in a protocol revision. We cannot therefore comment on the evolution of the ACA identified here or on the acquisition of new ACAs that were absent at initial diagnosis and may be an unfavorable feature.9,32 However, in the 47 patients with a chromosomal abnormality beyond Ph at diagnosis (27 with ≥1 of the 9 ACAs of interest and 20 with a different lesion), all their lesions were in Ph-positive cells.
Finally, only 23 of the 812 assessable patients progressed (of whom 12 received dasatinib and 11 imatinib; 1 patient had missing cytogenetics), a happy consequence of successful modern TKI therapy. Despite the statistically significant findings, there are only 6 unique patients with ≥1 of the 9 ACAs of interest who progressed. In exploratory analysis, if only 5 unique cases progressed, the significance of the findings would not change. Nevertheless, we advise caution in overinterpreting the data. In defining the significance of ACAs, it is unlikely that a single study or national group will be able to avoid this same problem, though a meta-analysis with other large studies would be of considerable interest.
Subject to the approval of Newcastle University, the authors will in principle be pleased to share the dataset with bona fide researchers in the field by contacting the corresponding author, Richard E. Clark (clarkre@liverpool.ac.uk).
Acknowledgments
The authors gratefully acknowledge Newcastle University (chief investigator: Stephen O’Brien) for access to SPIRIT2 trial data.
J.F.A. is a National Institute for Health Research Senior Investigator and acknowledges the support of the Imperial College National Institute for Health Research-Biomedical Research Centre.
Authorship
Contribution: R.E.C. designed this study, was a member of the SPIRIT2 trial management group, entered patients, carried out analyses, and wrote the manuscript; J.F.A. and M.C. were members of the SPIRIT2 trial management group and entered patients; S.C. carried out the statistical analyses and cowrote the manuscript; and all authors approved the final version of the manuscript.
Conflict-of-interest disclosure: R.E.C. declares research support and honoraria from Novartis and Bristol Myers Squibb (BMS) and honoraria from Pfizer in the past 3 years. J.F.A. declares research support and honoraria from Incyte, Novartis, and Pfizer and honoraria from BMS in the past 3 years. M.C. declares research support from Cyclacel, Novartis, BMS, and Incyte; advisory board membership for BMS, Novartis, Incyte, Pfizer, and Daiichi Sankyo; and honoraria from Astellas, BMS, Novartis, Incyte, Pfizer, Takeda, and Celgene. S.C. declares no competing financial interests.
Correspondence: Richard E. Clark, University of Liverpool, Room 150, 1st Floor Sherrington Building, Ashton St, Liverpool L69 3GE, United Kingdom; e-mail: clarkre@liverpool.ac.uk.

