

Key Points
Lineage output of mouse fetal liver HSC is dependent on Gpr56; on Gpr56 deletion, Gpr97 is upregulated and HSC myeloid bias increases.
Mouse Gpr97 rescues HS/PC generation in gpr56 morphant zebrafish; deletion of both Gpr56 and Gpr97 in mouse ESC abolishes HPC production.

Abstract
Integrated molecular signals regulate cell fate decisions in the embryonic aortic endothelium to drive hematopoietic stem cell (HSC) generation during development. The G-protein–coupled receptor 56 (Gpr56, also called Adgrg1) is the most highly upregulated receptor gene in cells that take on hematopoietic fate and is expressed by adult bone marrow HSCs. Despite the requirement for Gpr56 in hematopoietic stem/progenitor cell (HS/PC) generation in zebrafish embryos and the highly upregulated expression of GPR56 in treatment-resistant leukemic patients, its function in normal mammalian hematopoiesis remains unclear. Here, we examine the role of Gpr56 in HS/PC development in Gpr56 conditional knockout (cKO) mouse embryos and Gpr knockout (KO) embryonic stem cell (ESC) hematopoietic differentiation cultures. Our results show a bias toward myeloid differentiation of Gpr56 cKO fetal liver HSCs and an increased definitive myeloid progenitor cell frequency in Gpr56KO ESC differentiation cultures. Surprisingly, we find that mouse Gpr97 can rescue Gpr56 morphant zebrafish hematopoietic generation, and that Gpr97 expression is upregulated in mouse Gpr56 deletion models. When both Gpr56 and Gpr97 are deleted in ESCs, no or few hematopoietic PCs (HPCs) are generated upon ESC differentiation. Together, our results reveal novel and redundant functions for these 2 G-protein coupled receptors in normal mammalian hematopoietic cell development and differentiation.
Introduction
Hematopoietic stem cells (HSCs) are rare, self-renewing cells that sustain lifelong blood production. In vertebrate embryos, HSCs arise in the aorta-gonad mesonephros (AGM) region from hemogenic endothelial cells that undergo a highly conserved “endothelial-to-hematopoietic transition” (EHT) process.1-4 Transcriptomics and loss-of-function studies have identified candidate regulators in transitioning cells.5-11
We identified Gpr56 as the highest upregulated receptor gene during mouse EHT and localized its expression to emerging hematopoietic cells.12 Gpr56 is an adhesion G-protein–coupled receptor that mediates cell–cell and cell–matrix interactions.13 It is well-conserved across vertebrate species and contains 4 domains (external-N-terminal, GPCR-autoproteolysis-Inducing, 7-transmembrane, C-terminal-cytoplasmic).14 Upon ligand-binding, an autoproteolytic cleavage divides the protein in 2 noncovalently linked fragments. The cytoplasmic domain signals through RhoA/ROCK to trigger downstream cellular functions.15-17
Gpr56 function is well-characterized in central nervous system (CNS) development and its dysfunction is linked to human genetic disorders. Gpr56 deletion in the mouse causes a severe reduction in CNS myelination,16,18 and mutations in human GPR56 cause a recessive brain malformation, defective cerebral cortex, and CNS hypomyelination.19,20 Interestingly, aberrant expression of GPR56 in leukemic stem cells is associated with high-risk/treatment resistance in patients with AML.21-24 However, its role in normal hematopoiesis is uncertain.
Gpr56 knockdown zebrafish embryos suffer dramatic reductions in aortic hematopoietic stem/progenitor cell (HS/PC) generation during EHT.12 This deficiency could be rescued by zebrafish gpr56 (also mouse Gpr56) messenger RNA (mRNA) injection. Thus, gpr56 is necessary for zebrafish aortic HS/PC development.12 In contrast, although Gpr56 is highly expressed by mouse HS/PCs,25 1 mouse germline Gpr56 (exon2-3) deletion study showed surprisingly small changes in hematopoietic progenitor cell (HPC) numbers and HSC-repopulating activity,25 whereas another26 showed reduced HSC self-renewal. Because some Gpr56 protein was detected in this mouse model (possibly a failure to delete the S4 splice variant25 ), a role for Gpr56 in normal mammalian hematopoietic development remains controversial.
Here, we examine the role of Gpr56 in vivo and in vitro during mouse hematopoietic development. We show that in vivo transplanted Gpr56 conditional knockout mouse fetal liver (FL) HSCs and Gpr56−/− mouse embryonic stem cell (ESC)-derived HPCs are myeloid-biased, that mouse Gpr97 mRNA can rescue HS/PC generation in gpr56 morphant zebrafish embryos, and that deletion of Gpr56 in mouse FL HSCs and ESC-derived HPCs results in upregulated Gpr97 expression. Deletion of both Gpr56 and Gpr97 in mouse ESC results in almost complete loss of HPC production, revealing previously unrecognized and important redundant roles for these 2 GPCRs in mouse hematopoietic development.
Materials and methods
Mice
Gpr56fl,27 VavCre,28 and VECCre29 mice were maintained and embryos generated by mating Gpr56fl(C57BL/6) and VavCre:loxGpr56 or VECCre:loxGpr56 (C57BL/6HsdJOla) mice (2-6 months). Vaginal plug discovery was embryonic day 0 (E0). Staging was by somite counts. Ly5.1 mice (B6.SJL-PtprcaPepcb/BoyCrl, 2-4 months) were transplant recipients. Mice were maintained in University of Edinburgh animal facilities in compliance with a Home Office UK Project License.
Flow cytometry
Yolk sacs (YS) and AGMs were digested (37°C, 45 minutes) in 0.125% collagenaseT1 (C0130, Sigma-Aldrich) in phosphate-buffered saline (PBS) + 10% fetal bovine serum. FL cells were dispersed (5×) through a 30G needle. YS and AGM cells were stained with CD41-eFluor450, CD31-BV605, CD16/32-PE, c-Kit-APC, and CD45-AF450 and FL with Lin−Sca1+c-Kit+ (LSK)-SLAM markers (CD3−B220−Gr1−Ter119−NK1.1−CD48−, Sca1+cKit+CD150+) (supplemental Table 1) and analyzed (LSR Fortessa/FlowJo, v10; Becton Dickinson).
EBs were PBS-washed; dissociated (37°C, 5-10 minutes) in 500 μL TrypLE Express (Gibco) and anti-CD41, CD45, CD16/32 and c-Kit stained (4°C, 30 minutes). Dead cell exclusion was by Hoechst 33342 (Invitrogen) and gates set with unstained wild-type (WT) and fluorescent-minus-1 controls. Sorted cells (Aria II/Fusion/FlowJo, v10) were collected in 50% fetal bovine serum/PBS.
Hematopoietic assays
YS, AGM, ESCs or LSK-SLAM FL cells were cultured in methylcellulose (M3434, 37°C, 5% CO2, 10 days; Stem Cell Technologies) and colony forming unit-culture (CFU-C) scored.
LSK-SLAM FL cells (1 FL/recipient or 3, 10, or 30 cells/recipient) were injected intravenously into recipients (2 × 4.5 Gy γ-irradiation). Peripheral blood was analyzed by CD45.1/CD45.2-flow cytometry (4, 16, or 23 weeks) and multilineage analysis on tissues was performed at 23 weeks. Recipients with ≥5% donor-derived cells were considered reconstituted.
Molecular analyses
DNA was extracted from individual CFU-C, ear notches, or sorted cells in polymerase chain reaction (PCR) buffer (50 mM KCl, 10 mM TrisHCl, pH 8.3, 2.5 mM MgCl2, 0.1 mg/mL gelatin, 0.45% [v/v] Igepal/NP40, 0.45% [v/v] Tween20) + Proteinase K (10 mg/mL, 1 hour, 55°C) and heat-inactivated (95°C, 10 minutes); 1 µL was used for Gpr56 PCR.
RNA was isolated (RNeasyMicroKit; Qiagen), complementary DNA synthesized (oligodT, Invitrogen; SuperScriptIII, LifeTechnologies) and reverse transcription (RT)-PCR performed with FastSybrGreen (LifeTechnologies) and primers (supplemental Table 2).
Western blotting: 106 ESCs were washed (2× PBS), resuspended in ice-cold RIPA buffer + protease + phosphatase inhibitors (Thermo Fisher Scientific), incubated (30 minutes, ice), sonicated, centrifuged (maximum speed, 15 minutes), and protein quantified (BSA Kit; BioRad). Samples were boiled (95°C, 5 minutes, sodium dodecyl sulfate buffer, BioRad), sodium dodecyl sulfate-polyacrylamide gel (NuSTep) separated, transferred (30 minutes, 20 V) to nitrocellulose (Amersham). Membranes were blocked (5% semiskimmed milk:Tris-buffered saline-Tween20), blotted (ON; 4°C, 1.5% for Gpr56; RT, 2 hours for β-actin; supplemental Table 1) and washed (3 × 5 minutes, Tris-buffered saline-Tween), blotted with horseradish peroxidase-conjugated secondary antibodies (RT, 1 hour) and analyzed by OdysseyFC (Li-Cor) using ImageStudioLite.
ESC cells
IB10 embyonic stem cells (WT, G2V, G2V.56KO, G2V.56KO:97KO) were cultured (37°C, 5% CO2) on irradiated mouse embryonic fibroblasts (MEFs) in ES medium; Dulbecco’s modified Eagle medium (Lonza), 15% fetal calf serum (HyClone), 2 mM GlutaMAX, 1 mM Na-pyruvate, 1% P/S, 50 mM β-mercaptoethanol (all Gibco), 0.1 mM nonessential amino acids (Lonza), and 1000 U/mL LIF (Sigma-Aldrich). Cells were trypsinized and MEFs depleted by 30 minutes of incubation in Embryoid Body formation medium (Iscove modified Dulbecco medium, 15% fetal calf serum, 1% P/S. EB induction (40 rpm; 25 × 103cells/mL) was in EB medium, 2 mM GlutaMAX (Gibco), 50 mg/mL ascorbic acid (Sigma-Aldrich), 4 × 10⁻⁴ M monothioglycerol (Sigma-Aldrich), 300 mg/mL transferrin (Roche) and supplemented (day 3) with 5% proteome-free hybridoma medium (Gibco). From day 6, 100 ng/mL stem cell factor, 1 ng/mL interleukin-3, 5 ng/mL interleukin-11 (Peprotech); from day 4, 10 μM Y-27632 ROCK inhibitor and 0.84 nM Collagen3a were added. Reagents were refreshed every other day.
Mouse G2V.Gpr56 knockout ESCs were CRISPR/Cas930 generated (supplemental Figure 5). Guide RNAs (gRNAs) (supplemental Table 2; http://www.e-crisp.org/E-CRISP/designcrispr.html) were cloned into pSp-Cas9(BB)-2A-GFP (Addgene: 48138). Mouse G2V ESCs31,32 were transfected (DreamFect, OZBiosciences), GFP+ cells seeded on MEFs at 48 hours, expanded, and screened. Mouse G2V.Gpr56 cells were used for generating the Gpr97 knockout ESCs (supplemental Figure 6).
Zebrafish
Zebrafish (Danio rerio) embryos were raised at 28.5°C.12 Heterozygous 6.0itga2b:EGFP (CD41-GFP33 ) and -0.8flt1:RFP (Flt1:RFP)34 zebrafish were maintained by crosses with WT. Embryos imaged on a LeicaSP5. All mRNA in vitro expression constructs were generated by amplification of complementary DNA with specific primers (supplemental Table 2). PCR products were cloned (p-GEM-T), sequence verified, and mRNA generated (Ambion sp6/T7 kit). Antisense morpholino against the splice site of the second intron (supplemental Table 2; Gene Tools) was dissolved in Milli-Q water to 1 mM (1 nL MO was injected in a 1/5 concentration in 0.1 M KCl and phenol red). For mRNA rescue experiments, 1 nL of 50 ng/μL mRNA and 200 μM was injected.
Statistical analysis
Graphs were generated using GraphPadPrism. One-way analysis of variance corrected by Bonferroni test was used to compare >2 groups, and the Student t test for 2-group comparisons. The Fisher exact test determined nonrandom associations in lineage-bias analysis (*P ≤ .05, **P ≤ .01, ***P ≤ .001).
Results
Gpr56 conditionally deleted embryos have fewer YS hematopoietic progenitors
A conditional knockout (cKO) approach was taken to delete all isoforms (exons 4, 5, 6) of Gpr5627 in mouse embryonic cells expressing vascular endothelial-cadherin (VEC) or Vav before and following HSC generation, respectively. YS isolated from E9 VECCre:loxGpr56 cKO and WT littermates (Figure 1A) contained equivalent cell numbers (supplemental Figure 1A). CD31+ cKO YS cells showed a significant decrease in relative Gpr56 mRNA compared with WT (Figure 1B); Gpr56 deletion was verified by DNA-PCR (supplemental Figure 1B, top). In vitro CFU-C assays revealed a significantly lower number of HPCs (CFU-C/YS) in the cKO compared with WT (Figure 1C) and 18/19 individual cKO colonies showed both Gpr56 alleles recombined (supplemental Figure 1B, bottom). cKit+ cell percentages were significantly decreased in cKO YS compared with WT, but only slight reductions were found in the percentages of erythromyeloid progenitor (EMP; CD41+cKit+CD16/32+) and other (CD31+cKit+, CD45+cKit+) cells (Figure 1D; supplemental Figure 1C).
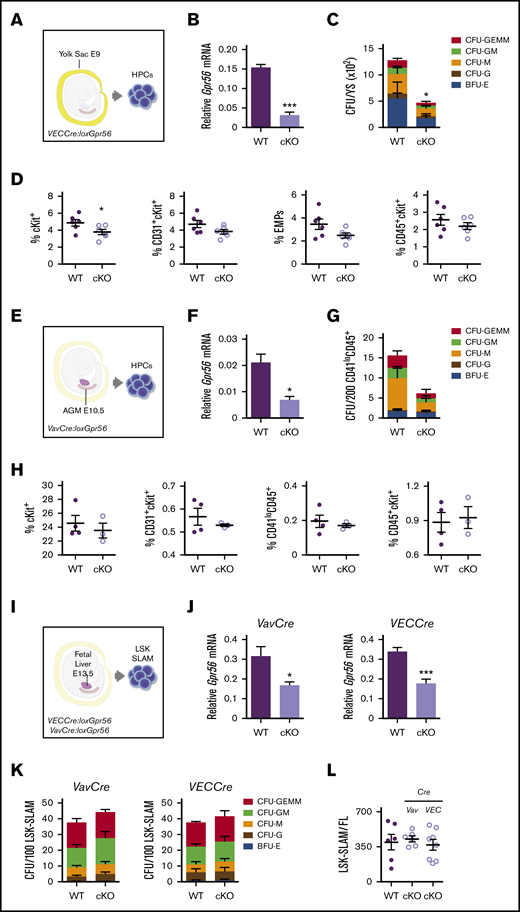
Gpr56 deficiency effects early hematopoietic development in mouse embryos. Experimental setup for E9 YS (21-25 somite pairs) (A), E10.5 AGM (34-37 somite pairs) (E), and E13.5 FL HPC analyses (I). (B) Relative expression of Gpr56 in WT and VECCre:loxGpr56 cKO E9 YS cells normalized to β-actin by RT-PCR analysis (n = 3). (C) Number of CFU per WT and cKO E9 YS (n = 3). (D) Percentages of cKit+, CD31+cKit+, CD41+cKit+CD16/32+ (EMP), and CD45+ckit+ cells in WT and cKO E9 YS (n = 6). Flow cytometric gating strategy shown in supplemental Figure 1. (F) Relative expression of Gpr56 in WT and VavCre:loxGpr56 cKO E10.5 AGM cells normalized to β-actin by RT-PCR analysis (n = 3). (G) Number of CFU per WT and cKO E10.5 AGM (n = 3). (H) Percentages of cKit+, CD31+cKit+, CD41loCD45+, and CD45+ckit+ cells in WT and cKO E10.5 AGMs (n = 6). (J) Relative expression of Gpr56 in WT and VavCre: and VECCre:loxGpr56 cKO LSK SLAM sorted E13.5 FL cells normalized to β-actin by RT-PCR analysis (n = 5). *P ≤ .05. (K) Number of CFU per WT and Vav and VECCre cKO E13.5 FL LSK SLAM cells (n = 4). (L) Number of LSK SLAM cells per WT and Vav and VECCre cKO E13.5 FL (n = 6). Distinct colony types are indicated. Mean ± standard error of the mean (SEM) is shown.
Gpr56 deficiency effects early hematopoietic development in mouse embryos. Experimental setup for E9 YS (21-25 somite pairs) (A), E10.5 AGM (34-37 somite pairs) (E), and E13.5 FL HPC analyses (I). (B) Relative expression of Gpr56 in WT and VECCre:loxGpr56 cKO E9 YS cells normalized to β-actin by RT-PCR analysis (n = 3). (C) Number of CFU per WT and cKO E9 YS (n = 3). (D) Percentages of cKit+, CD31+cKit+, CD41+cKit+CD16/32+ (EMP), and CD45+ckit+ cells in WT and cKO E9 YS (n = 6). Flow cytometric gating strategy shown in supplemental Figure 1. (F) Relative expression of Gpr56 in WT and VavCre:loxGpr56 cKO E10.5 AGM cells normalized to β-actin by RT-PCR analysis (n = 3). (G) Number of CFU per WT and cKO E10.5 AGM (n = 3). (H) Percentages of cKit+, CD31+cKit+, CD41loCD45+, and CD45+ckit+ cells in WT and cKO E10.5 AGMs (n = 6). (J) Relative expression of Gpr56 in WT and VavCre: and VECCre:loxGpr56 cKO LSK SLAM sorted E13.5 FL cells normalized to β-actin by RT-PCR analysis (n = 5). *P ≤ .05. (K) Number of CFU per WT and Vav and VECCre cKO E13.5 FL LSK SLAM cells (n = 4). (L) Number of LSK SLAM cells per WT and Vav and VECCre cKO E13.5 FL (n = 6). Distinct colony types are indicated. Mean ± standard error of the mean (SEM) is shown.
E9 AGM cells from this cohort of VECCre:loxGpr56 cKO embryos were significantly reduced in cKit+ cell percentages and showed slight reductions in EMPs and other progenitors (supplemental Figure 1D). In contrast, E10.5 VECCre:loxGpr56 cKO AGM cells had no reductions in percentages of cKit+, EMPs, or other progenitor cells (supplemental Figure 1E). E10.5 VavCre:loxGpr56 cKO AGM cells (CD41lo/CD45+; Figure 1E; supplemental Figure 1F) were similarly examined. A significant decrease in relative Gpr56 mRNA was found in the cKO cells compared with WT (Figure 1F). Gpr56 deletion was verified by DNA-PCR (supplemental Figure 1G). Although there appears to be a trend toward reduced CFU-C numbers in CD41lo/CD45+ cKO AGM cells, it was not significant (Figure 1G) and the percentages of phenotypic hematopoietic cells in the E10.5 cKO AGM were unchanged (Figure 1H). Together, these data indicate that loss of Gpr56 affects HPCs in the E9 YS, but has little to no effect on E10.5 AGM hematopoiesis.
Hematopoietic function in E13.5 Gpr56 cKO fetal liver
To examine whether Gpr56 loss affects FL definitive HSCs and HPCs, LSK-SLAM cells were isolated from E13.5 VavCre:loxGpr56 and VECCre:loxGpr56 cKO embryos (Figure 1I). Gpr56 transcripts were reduced in cKO cells compared with WT (Figure 1J) and Gpr56 deletion was confirmed (supplemental Figure 2A, top). The frequency of cKO HPCs (CFU-C/100 LSK-SLAM; Figure 1K) and number of LSK-SLAM cells per E13.5 FL (Figure 1L) in cKO lines were unchanged as compared with WT. A total of 14/14 individual CFU-Cs tested from VavCre:loxGpr56 FL (supplemental Figure 2A, bottom) and 28/29 colonies from VECCre:loxGpr56 FL (supplemental Figure 2B) showed both Gpr56 alleles recombined. Thus, Gpr56 is dispensable for FL HPC growth and function.
E13.5 FL VavCre:loxGpr56 cKO LSK-SLAM cells were examined for HSC activity by in vivo transplantation (Figure 2A). Adult irradiated recipients injected with 1 FL-equivalent of LSK-SLAM cells (∼100 HSCs35 ) from cKO and WT donors showed no difference in the percentage of mice engrafted or peripheral blood (PB) donor-chimerism (4 and 16 weeks postinjection; Figure 2B). Donor chimerism in the bone marrow (BM), spleen (Sp), thymus (Thy), and lymph nodes (LN) of cKO recipients at 18 weeks (Figure 2C) was equivalent to WT. Thus, Gpr56 appears dispensable for engraftment by large numbers of FL HSCs.
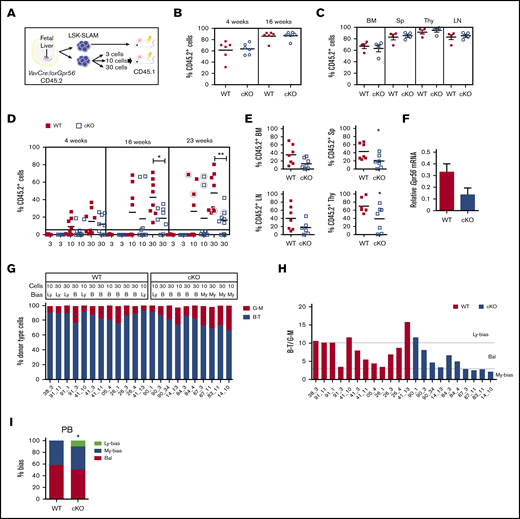
Clonal LSK SLAM fetal liver cell in vivo transplantations reveal decreased engraftment levels and myeloid-lineage bias for Gpr56 deficient HSCs. (A) Experimental setup for in vivo transplantation of E13.5 FL-sorted LSK SLAM cells. (B-C) One FL equivalent of LSK SLAM sorted E13.5 cells from WT and VavCre:loxGpr56 cKO embryos (Ly5.2) were injected into adult irradiated recipients (Ly5.1). Donor cell chimerism in recipient PB at week 4 and 16 posttransplant (B) and hematopoietic tissues at week 18 posttransplant (C). Analysis is by Ly5.1/Ly5.2 flow cytometry. Mean ± SEM is shown. n = 6 per group. (D) Limiting dilution clonal HSC transplantation. Percentage of donor cell engraftment of individual adult irradiated recipient mice as measured by Ly5.1/Ly5.2 flow cytometry of PB at 4, 16, and 23 weeks postinjection of 3, 10, and 30 LSK SLAM E13.5 FL cells. WT controls (red squares) and VavCre:loxGpr56 knockout (cKO, blue empty squares). n = 8 per group. Horizontal line at 5% indicates cutoff for reconstitution. Horizontal lines indicate average percentage engraftment. Circled individual symbols indicate mice used for secondary transplantations. *P ≤ .05; **P ≤ .01. (E) Percentage of donor cell engraftment at 23 weeks postinjection as measured by Ly5.1/Ly5.2 flow cytometry of BM, Sp, LN, and Thy cells from 7 recipient mice injected with 30 LSK-SLAM FL cells. *P ≤ .05. (F) RT-PCR relative expression of Gpr56 normalized to β-actin in LSK BM cells from primary recipients injected with WT and VavCre:loxGpr56 cKO sorted E13.5 FL cells (n = 5). Mean ± SEM are shown. (G) Percentage of lymphoid and myeloid cell contribution in PB of 22 individual adult irradiated recipient mice as measured by flow cytometry of peripheral blood at 23 weeks postinjection of 10 and 30 LSK-SLAM WT control and VavCre:loxGpr56 cKO E13.5 FL cells. (H) Ratio of B-T lymphoid and G-M myeloid for cohort of recipients in panel G with indicators for limits of lymphoid-biased, balanced and myeloid-biased HSC outputs. B, balanced; Ly, lymphoid bias; My, myeloid bias. >87% B-T=Ly; 75% to 87% B-T=B; <75% B-T=My. (I) Percentages of lymphoid-biased, balanced and myeloid-biased HSC engrafted recipients from panel H. Fisher exact test determined statistically significant differences in the My-bias fraction. *P ≤ .05.
Clonal LSK SLAM fetal liver cell in vivo transplantations reveal decreased engraftment levels and myeloid-lineage bias for Gpr56 deficient HSCs. (A) Experimental setup for in vivo transplantation of E13.5 FL-sorted LSK SLAM cells. (B-C) One FL equivalent of LSK SLAM sorted E13.5 cells from WT and VavCre:loxGpr56 cKO embryos (Ly5.2) were injected into adult irradiated recipients (Ly5.1). Donor cell chimerism in recipient PB at week 4 and 16 posttransplant (B) and hematopoietic tissues at week 18 posttransplant (C). Analysis is by Ly5.1/Ly5.2 flow cytometry. Mean ± SEM is shown. n = 6 per group. (D) Limiting dilution clonal HSC transplantation. Percentage of donor cell engraftment of individual adult irradiated recipient mice as measured by Ly5.1/Ly5.2 flow cytometry of PB at 4, 16, and 23 weeks postinjection of 3, 10, and 30 LSK SLAM E13.5 FL cells. WT controls (red squares) and VavCre:loxGpr56 knockout (cKO, blue empty squares). n = 8 per group. Horizontal line at 5% indicates cutoff for reconstitution. Horizontal lines indicate average percentage engraftment. Circled individual symbols indicate mice used for secondary transplantations. *P ≤ .05; **P ≤ .01. (E) Percentage of donor cell engraftment at 23 weeks postinjection as measured by Ly5.1/Ly5.2 flow cytometry of BM, Sp, LN, and Thy cells from 7 recipient mice injected with 30 LSK-SLAM FL cells. *P ≤ .05. (F) RT-PCR relative expression of Gpr56 normalized to β-actin in LSK BM cells from primary recipients injected with WT and VavCre:loxGpr56 cKO sorted E13.5 FL cells (n = 5). Mean ± SEM are shown. (G) Percentage of lymphoid and myeloid cell contribution in PB of 22 individual adult irradiated recipient mice as measured by flow cytometry of peripheral blood at 23 weeks postinjection of 10 and 30 LSK-SLAM WT control and VavCre:loxGpr56 cKO E13.5 FL cells. (H) Ratio of B-T lymphoid and G-M myeloid for cohort of recipients in panel G with indicators for limits of lymphoid-biased, balanced and myeloid-biased HSC outputs. B, balanced; Ly, lymphoid bias; My, myeloid bias. >87% B-T=Ly; 75% to 87% B-T=B; <75% B-T=My. (I) Percentages of lymphoid-biased, balanced and myeloid-biased HSC engrafted recipients from panel H. Fisher exact test determined statistically significant differences in the My-bias fraction. *P ≤ .05.
Clonal transplantation reveals a role for Gpr56 in FL HSC lineage bias
To test if Gpr56 affects HSC quality in clonal in vivo transplantation, 3, 10, and 30 LSK-SLAM FL cells from E13.5 VavCre:loxGpr56 and WT littermates were transplanted (Figure 2D). Injection of 3 LSK-SLAM cells failed to reconstitute. Injection of 10 or 30 WT cells led to long-term (23-week) reconstitution (≥5% donor chimerism) in 75% (12/16) of recipients, whereas only 50% (8/16) of recipients receiving cKO cells showed reconstitution. The average percentage PB donor chimerism in recipients of 30 cKO cells (at 16 and 23 weeks) was significantly decreased compared with WT, as was the donor chimerism in the BM, spleen, LN, and Thy (Figure 2E). Gpr56 transcripts were decreased in CD45.2+ LSK cells from the BM (Figure 2F), confirming Gpr56-related HSC dysfunction.
The donor-derived lymphoid-myeloid ratio36 was examined in the PB of cKO and WT E13.5 LSK-SLAM FL reconstituted recipients at 23 weeks (Figure 2G). Lineage output was determined by B plus T lymphoid cell percentages to granulocyte plus macrophage percentages (B+Tvalue/G+Mvalue), with ratios of >10, 10 to 3, and 3 to 0 considered lymphoid-biased, balanced, or myeloid-biased, respectively (Figure 2H). The 12 WT HSC recipients showed 5 with lymphoid-biased and 7 with balanced outputs. In contrast, the 10 cKO HSC recipients showed 1 lymphoid-biased, 5 balanced, and 4 myeloid-biased (Figure 2H). The increase in myeloid-biased HSCs was significant (Figure 2I). The BM cell lineage output of some of this cohort (supplemental Figure 2C-D) showed a similar but not significant myeloid bias in cKO HSC recipients. These data suggest that Gpr56 maintains the in vivo quality of HSCs, preserving lymphoid-biased and balanced HSC lineage output.
Gpr56 is expressed in ESC-derived hematopoietic cells
To further examine Gpr56 during development, we used Gata2Venus (G2V) mouse reporter ESCs,31 which facilitate the isolation of HS/PCs in the Venus-expressing (V+) cell fraction31,32 (Figure S3; gating and fluorescent-minus 1). G2V ESCs were differentiated and harvested at several time points (Figure 3A). RT-PCR analysis on cells from day 0, 6, 10, and 12 cultures showed significant increases in Gpr56 transcript levels, peaking at day 10 and day 12 in unsorted (supplemental Figure 4A) and V+ cells (supplemental Figure 4B). A low level of Gpr56 expression was found in nonhematopoietic V− cells, as expected.16 Western blotting of whole cell extracts from unsorted differentiated G2V ESCs showed high-level Gpr56 protein expression at day 12 compared with day 0 (supplemental Figure 4C, left) and in day 12 V+ compared with V− cells (supplemental Figure 4C, right). Thus, G2V ESCs are a suitable platform to examine the role of Gpr56.
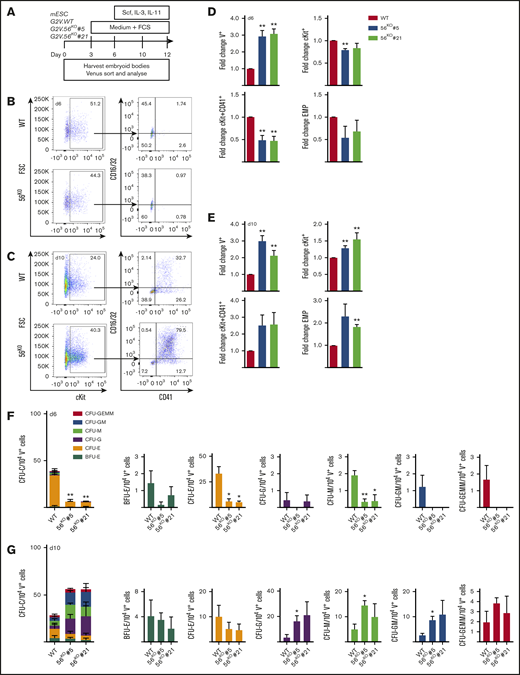
Gpr56 affects hematopoietic output in vitro. (A) ESC differentiation culture methodology. Mouse Gata2Venus (mG2V) ESC (WT and 56KO) were differentiated in hematopoietic factor-containing medium for several days and unsorted/sorted V+ and V− cells were examined for Gpr56 mRNA (RT-PCR) and Gpr56 protein (WB, western blot) expression. (B-C) Representative flow cytometric plots of day 6 (B) and day 10 (C) G2V.WT and G2V.56KO differentiation cultures showing percentages of CD16/32 and CD41 cells in Venus+cKit+ gate. CD41+cKit+ CD16/32+ = EMP (erythromyeloid progenitors). (D-E) Fold change in the percentages (mean ± SEM) of Venus+, cKit+, cKit+CD41+, and EMPs in day 6 (D) and day 10 (E) G2V.WT and G2V.56KO (clones #5 and #21) differentiation cultures. n = 3. (F-G) Hematopoietic potential of G2V.WT and G2V.56KO (clones #5 and #21) HPCs was determined at day 6 (F) and day 10 (G) of differentiation by CFU-C assay. CFU-C per 10 000 V+ plated cells is shown. Distinct colony types are indicated by color. n = 3; mean ± SEM.
Gpr56 affects hematopoietic output in vitro. (A) ESC differentiation culture methodology. Mouse Gata2Venus (mG2V) ESC (WT and 56KO) were differentiated in hematopoietic factor-containing medium for several days and unsorted/sorted V+ and V− cells were examined for Gpr56 mRNA (RT-PCR) and Gpr56 protein (WB, western blot) expression. (B-C) Representative flow cytometric plots of day 6 (B) and day 10 (C) G2V.WT and G2V.56KO differentiation cultures showing percentages of CD16/32 and CD41 cells in Venus+cKit+ gate. CD41+cKit+ CD16/32+ = EMP (erythromyeloid progenitors). (D-E) Fold change in the percentages (mean ± SEM) of Venus+, cKit+, cKit+CD41+, and EMPs in day 6 (D) and day 10 (E) G2V.WT and G2V.56KO (clones #5 and #21) differentiation cultures. n = 3. (F-G) Hematopoietic potential of G2V.WT and G2V.56KO (clones #5 and #21) HPCs was determined at day 6 (F) and day 10 (G) of differentiation by CFU-C assay. CFU-C per 10 000 V+ plated cells is shown. Distinct colony types are indicated by color. n = 3; mean ± SEM.
Gpr56 deletion affects hematopoietic output during ESC differentiation
Gpr56 deleted G2V ESC lines (56KO) were generated by CRISPR/Cas9 editing. gRNAs to exon 2 (common to all transcript variants; supplemental Figure 5A) were cloned (pSP-Cas9-2A-GFP) and transfected into G2V ESCs (supplemental Figure 5B). At 48 hours posttransfection, ∼10% of G2V ESCs were GFP+ (supplemental Figure 5C-D). Undifferentiated G2V clones (#5, #21) showed a complete lack of Gpr56 protein (supplemental Figure 4D) compared with WT (#1, #2). The total absence of Gpr56 transcripts in clone #5 compared with WT ESC was verified during timecourse in vitro differentiation (supplemental Figure 4E), confirming the successful knockout of Gpr56.
Phenotypic HPC37 and CFU-C analyses were performed on cells from day 6 (Figure 3B,D,F) and day 10 (Figure 3C,E,G) 56KO and WT ESC cultures. The percentage of V+ cells in both the day 6 and day 10 56KO (#5 and #21) cultures was significantly increased (2.8 ± 0.95 fold) compared with WT (Figure 3D-E). Despite this increase, at day 6, a significant decrease in the percentage of cKit+ (#5) and cKit+CD41+ cells in the V+ fraction (#5 and #21) of 56KO cultures was found compared with WT (Figure 3D). In contrast, at day 10, a significant increase in cKit+ (#5 and #21; 1.3 ± 0.2) and phenotypic EMP percentages (#21; 1.82 ± 0.1) was found (Figure 3E).
When day 6 V+ cells were tested for HPC function (Figure 3F), both 56KO clones were significantly reduced (fourfold) in CFU-C/104 V+ cells compared with WT. The significant decrease was in CFU-erythroid and CFU-megakaryocyte (CFU-M). In contrast, V+ cells from day 10 56KO (#5, #21) cultures (Figure 3G) revealed a trend (P = .33, P = .68) toward increased CFU-C/104 cells compared with WT V+ cells. Significant increases in CFU-granulocyte (CFU-G), CFU-macrophage (CFU-M), and CFU granulocyte–macrophage (CFU-GM) frequencies for clone #5 were observed. Hence, the reduction in day 6 early HPCs and the contrasting increase in myeloid lineage progenitors at day 10 of 56KO ESC differentiation agrees with in vivo Gpr56 cKO results and suggests that Gpr56 plays distinct roles during hematopoietic development/differentiation.
In the developing brain, Col3a1 is a Gpr56 ligand15,27 and Gpr56 signals intracellularly through Rho/ROCK.16 To test these routes of activation in hematopoietic cells, Col3a1 or ROCK inhibitor Y-27632 were added to in vitro differentiating G2V ESCs. Cultures (day 12) showed no changes in the number of ESC-derived V+ hematopoietic cells for either condition (Figure 4A). When HPC activity was analyzed, a trend toward reduced total CFU-C numbers was found with the ROCK inhibitor, whereas an increased trend was found with Col3a1 (Figure 4B). Examination of specific colony types revealed a significant increase in CFU-M and CFU granulocyte, erythroid, megakaryocyte (GEMM) in the presence of Col3a1 (Figure 4C). The ROCK inhibitor decreased burst forming unit-erythroid (BFU-E), CFU-M, and CFU-GM (Figure 4C). Our single-cell RNAseq dataset38 of HSCs, HPCs, and endothelial cells in E10.5/11.5 intra-aortic cluster (CD31+G2VmedcKithi) was examined for Col3a1, Gpr56, and Arrb239,40 (effector of Gpr56 activation) (Figure 4D). Gpr56 was found highly expressed in the hematopoietic cluster (HC1) whereas Col3a1 was highly expressed in the endothelial-like cluster. Arrb2 was expressed at varying levels in both. These data agree with published expression analysis of AGM hematopoietic and niche populations41 and support the notion that Col3a1 could be a ligand for Gpr56 in hematopoietic development.
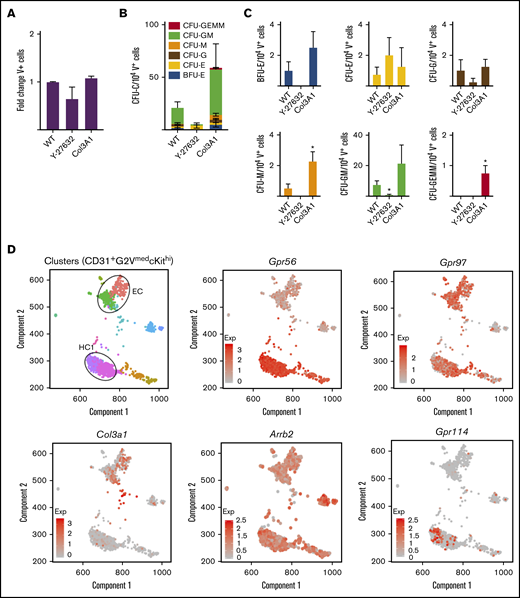
Functional and gene expression analyses of Gpr56 downstream effectors. (A-C) Frequency of Venus+ cells (A) and CFU-C colonies of day 12 V+ sorted cells (B-C) treated with ROCK inhibitor (Y-27632) and collagen (Col3a1). (D) Spring analysis of AGM-derived HSPCs38 displays the differential expression of Gpr56, collagen (Col3a1), β arrestin (Arrb2), Gpr97, and Gpr114 in the 2 cell clusters (EC and HC1) of highly enriched HSPCs (CD31+G2VmedcKithi) from E10.5/11.5 AGM IAHC cells.
Functional and gene expression analyses of Gpr56 downstream effectors. (A-C) Frequency of Venus+ cells (A) and CFU-C colonies of day 12 V+ sorted cells (B-C) treated with ROCK inhibitor (Y-27632) and collagen (Col3a1). (D) Spring analysis of AGM-derived HSPCs38 displays the differential expression of Gpr56, collagen (Col3a1), β arrestin (Arrb2), Gpr97, and Gpr114 in the 2 cell clusters (EC and HC1) of highly enriched HSPCs (CD31+G2VmedcKithi) from E10.5/11.5 AGM IAHC cells.
Mouse Gpr97 rescues HS/PC generation in zebrafish gpr56 morphants
The discrepancy between the essential role for Gpr56 in zebrafish HS/PC development and the rather minor role in the mouse was puzzling.12 In the mouse, 3 closely related Gpr genes (5′-Gpr114;Gpr56;Gpr97-3′) are contained within a single 122-Kb locus. In zebrafish gpr56 and gpr97 are separated by 36 Mb (Figure 5A). Because mouse Gpr97 and Gpr114 are highly homologous to Gpr56, they may compensate for Gpr56 loss. To test for functional redundancy, mouse (m)Gpr56, Gpr97, and Gpr114 mRNA was injected into zebrafish embryos along with gpr56 morpholino (MO) (Figure 5B-C). Morphant gpr56 embryos co-injected with zgpr56, mGpr56 and mGpr97 mRNA showed hematopoietic rescue as quantitated by cmyb in situ hybridization signal, whereas mouse Gpr114 mRNA did not. Additionally, transgenic zebrafish embryos (CD41GFP:Flt1RFP report HS/PC generation) were injected with the gpr56 MO alone or in combination with zgpr56 or mGpr56, mGpr97, or mGpr114 RNA. Double expressing CD41dimFlt1+ (GFP+RFP+) HS/PCs in the caudal hematopoietic cell tissue at 48 hpf were counted (Figure 5D-E). Significant increases in the average number of HS/PCs were found in the morphants injected with zgpr56, mGpr56, and mGpr97 mRNA vs control morphants, and HS/PC numbers were equivalent to those in noninjected controls. mGpr114 mRNA did not restore production of HS/PC. Alignment comparisons revealed a high degree of homology between mouse Gpr97 and both zebrafish gpr56 and mouse Gpr56 in all 4 protein domains (Figure 5F), suggesting that Gpr97 may function redundantly in the mouse embryos in the absence of Gpr56.
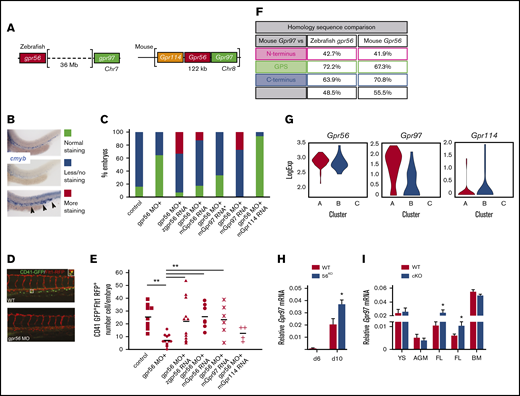
Redundant function of mouse Gpr97 in Gpr56 morphant zebrafish and Gpr97 expression in mouse ESCs and embryonic tissues. (A) Schematic of the Gpr56 locus in zebrafish and mouse. Two highly homologous genes, Gpr114 and Gpr97, are located 5′ and 3′, respectively, within the mouse Gpr56 locus. (B) Zebrafish cmyb in situ staining controls (30 hpf) used for rescue experiments showing normal (green), less/no (blue), and more (red) staining. More staining was classified based on both intensity of staining compared with controls and ectopic cmyb expressing cells in the posterior cardinal vein and caudal hematopoietic tissue as indicated by arrowheads. (C) In situ hybridization with the HSC marker cmyb at 30 hpf. Histogram shows number of embryos in test groups classified as normal, less or no, and more staining. cmyb staining performed on zebrafish control embryos or embryos injected with gpr56 morpholino, or gpr56 morpholino with zebrafish (z)gpr56, mouse (m)Gpr56, mGrp97 (30 ng*), mGpr97, or mGpr114 mRNA (all with 50 ng except *). Number of experiments = 4, 4, 3, 3, 1, 1, and 1, respectively; number of embryos per condition = 92, 67, 56, 65, 15, 22, and 17. (D) Representative images of CD41GFPdimFlt1RFP+ cells (yellow fluorescence) in the caudal hematopoietic tissue (CHT) of gpr56 MO injected and control (WT) double transgenic zebrafish embryos at 48 hpf. CD41, green; Flt1, red; double positive definitive HS/PC, yellow (left). (E) Rescue of HS/PC production as determined by the number of CD41GFPdimFlt1RFP+ cells in the CHT of 48 hpf control, gpr56 morphant zebrafish, and gpr56 morphant zebrafish injected with zgpr56, mGpr56, mGpr97, and mGpr114 RNA was injected. Number of experiments = 2; number of injected and analyzed embryos = 9, 12, 12, 7, 6, and 4, respectively; bars = mean; **P < .01. (F) Percentage of amino acid sequence homology of the 4 domains of mouse Gpr97 vs zebrafish gpr56 and mouse Gpr56. (G) Violin plots showing logExp of Gpr56, Gpr97, and Gpr114 in the 85 CD27+ cells within HC1 (Figure 4F) generated from Vink et al, 2020 single-cell RNA database.38 HC1 CD27+ cells are segregated into subclusters A, B, and C. (H) RT-PCR analysis of relative Gpr97 expression (normalized to β-actin) in days 6 and 10 diferentiated G2V WT and G2V.56KO ESCs from hematopoietic differentiation cultures (same V+cKit+ samples as shown in supplemental Figure 4B for relative Gpr56 expression). n = 3. Mean ± SEM. (I) RT-PCR analysis of relative Gpr97 expression in E9 VECCre:loxGpr56 cKO YS cells (n = 3), E10.5 VavCre:loxGpr56 AGM cells (n = 3), VavCre:loxGpr56 and VECCre:loxGpr56 cKO FL cells (n = 5 and n = 8, respectively) and LSK bone marrow cells (n = 5) from primary recipients of VavCre:loxGpr56 cKO cells. *P ≤ .05.
Redundant function of mouse Gpr97 in Gpr56 morphant zebrafish and Gpr97 expression in mouse ESCs and embryonic tissues. (A) Schematic of the Gpr56 locus in zebrafish and mouse. Two highly homologous genes, Gpr114 and Gpr97, are located 5′ and 3′, respectively, within the mouse Gpr56 locus. (B) Zebrafish cmyb in situ staining controls (30 hpf) used for rescue experiments showing normal (green), less/no (blue), and more (red) staining. More staining was classified based on both intensity of staining compared with controls and ectopic cmyb expressing cells in the posterior cardinal vein and caudal hematopoietic tissue as indicated by arrowheads. (C) In situ hybridization with the HSC marker cmyb at 30 hpf. Histogram shows number of embryos in test groups classified as normal, less or no, and more staining. cmyb staining performed on zebrafish control embryos or embryos injected with gpr56 morpholino, or gpr56 morpholino with zebrafish (z)gpr56, mouse (m)Gpr56, mGrp97 (30 ng*), mGpr97, or mGpr114 mRNA (all with 50 ng except *). Number of experiments = 4, 4, 3, 3, 1, 1, and 1, respectively; number of embryos per condition = 92, 67, 56, 65, 15, 22, and 17. (D) Representative images of CD41GFPdimFlt1RFP+ cells (yellow fluorescence) in the caudal hematopoietic tissue (CHT) of gpr56 MO injected and control (WT) double transgenic zebrafish embryos at 48 hpf. CD41, green; Flt1, red; double positive definitive HS/PC, yellow (left). (E) Rescue of HS/PC production as determined by the number of CD41GFPdimFlt1RFP+ cells in the CHT of 48 hpf control, gpr56 morphant zebrafish, and gpr56 morphant zebrafish injected with zgpr56, mGpr56, mGpr97, and mGpr114 RNA was injected. Number of experiments = 2; number of injected and analyzed embryos = 9, 12, 12, 7, 6, and 4, respectively; bars = mean; **P < .01. (F) Percentage of amino acid sequence homology of the 4 domains of mouse Gpr97 vs zebrafish gpr56 and mouse Gpr56. (G) Violin plots showing logExp of Gpr56, Gpr97, and Gpr114 in the 85 CD27+ cells within HC1 (Figure 4F) generated from Vink et al, 2020 single-cell RNA database.38 HC1 CD27+ cells are segregated into subclusters A, B, and C. (H) RT-PCR analysis of relative Gpr97 expression (normalized to β-actin) in days 6 and 10 diferentiated G2V WT and G2V.56KO ESCs from hematopoietic differentiation cultures (same V+cKit+ samples as shown in supplemental Figure 4B for relative Gpr56 expression). n = 3. Mean ± SEM. (I) RT-PCR analysis of relative Gpr97 expression in E9 VECCre:loxGpr56 cKO YS cells (n = 3), E10.5 VavCre:loxGpr56 AGM cells (n = 3), VavCre:loxGpr56 and VECCre:loxGpr56 cKO FL cells (n = 5 and n = 8, respectively) and LSK bone marrow cells (n = 5) from primary recipients of VavCre:loxGpr56 cKO cells. *P ≤ .05.
Gpr97 expression is upregulated in the absence of Gpr56 in vivo and in vitro
Mouse G2V.WT ESCs examined by Gpr97 RT-PCR during in vitro hematopoietic differentiation showed significantly increased expression from day 6 to day 12 in the V+ fraction (supplemental Figure 4F). Violin plots generated from single-cell RNA sequencing datasets of enriched AGM HS/PCs38 (Figure 5G) show high expression of Gpr56 in the 85 CD27+ cells in HC1. These cells separate into 3 subclusters (A, B, C), with cluster B containing all HSC activity.38 Compared with Gpr56 logExp, Gpr97 transcripts are 10-fold lower in A and 100-fold lower in B, and Gpr114 transcripts are barely detectable. Spring analysis (Figure 4D) shows coexpression of Gpr97 in many Gpr56-expressing cells in HC1, with only very few coexpressing Gpr114. Thus, low Gpr97 expression overlaps with high Gpr56 expression in some enriched HS/PCs in mouse intra-aortic hematopoietic clusters (IAHCs).
Gpr97 levels were examined in in vitro differentiated Gpr56KO ESCs (Figure 5H) and in vivo VECCre:loxGpr56 and VavCre:loxGpr56 cKO YS, AGM FL, and BM hematopoietic cells (Figure 5I). When compared with differentiated WT G2V.ESCs, significantly increased expression of Gpr97 expression was found in the day 10 (but not day 6) V+ fraction. E9 YS CD31+ cells and E10.5 CD41lo/CD45+ AGM cells showed similar levels of Gpr97 expression in WT and Gpr56 cKO cells. In contrast, E13.5 FL LSK-SLAM cells showed a significant upregulated expression of Gpr97 in Gpr56 cKO (∼1.5-fold) vs WT cells. The donor-derived LSK BM cells from transplant recipients of 10 or 30 cKO E13.5 LSK-SLAM FL cells showed comparable levels of relative Gpr97 expression to WT LSK BM cells. Thus, Gpr97 may function redundantly in the definitive stage of hematopoietic development both in vitro (day 10) and in vivo (FL), but not in early development or in BM of transplant recipients.
Deletion of both Gpr56 and Gpr97 impairs ESC-derived hematopoiesis
To explore the functional contribution of Gpr97 during in vitro differentiation upon loss of Gpr56, we generated a mouse G2V.56KO97KO ESC line (Figure 6A; supplemental Figure 6). CRISPR/Cas9 editing with gRNAs targeting Gpr97 exons 2 and 10 was used to knockout all potential isoforms and/or decay RNA transcripts. Clone B3 (56KO97KO) was used for further studies. The absence of Gpr97 transcripts in B3 (days 6 and 10) cells was confirmed by RT-PCR (Figure 6B). When the hematopoietic output of day 10 56KO97KO, 56KO, and WT ESCs was examined (Figure 6C) all showed >90% viable cells (Figure 6D). The fold increase of V+ cells in the 56KO cultures was significant, but 56KO97KO cultures showed no significant changes in V+ cells compared with WT (Figure 6D). However, significant fold decreases in CD45+ cells and CD41+cKit+CD16/32+ (EMP) cells were observed in the 56KO97KO differentiated cells compared with WT. This suggests that both Gpr56 and Gpr97 are involved in HPC generation and/or differentiation.
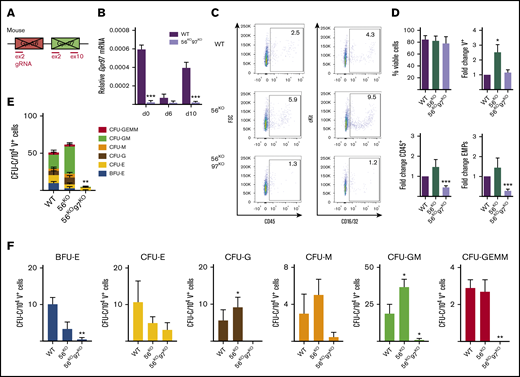
Decreased production of HPCs in the absence of Gpr56 and Gpr97. (A) Schematic of Gpr56 and Gpr97 deletion in mouse Gpr56 locus. (B) RT-PCR analysis of time course hematopoietic differentiation cultures of G2V WT and G2V.56KO97KO ESCs. Relative Gpr97 expression (normalized to β-actin). (C) Representative flow cytometry plots for CD45+ hematopoietic cells and EMPs (CD41+cKit+CD16/32+) from day 10 differentiated G2V WT, G2V.56KO, and G2V.56KO97KO ESC cultures. Percentages shown in each quadrant. (D) Percentage of viable cells and fold change in percentages of V+, CD45+, and EMPs from day 10 differentiated G2V WT, G2V.56KO, and G2V.56KO97KO ESC cultures. n = 3. Mean ± SEM. (E) Frequency of CFU-C in day 10 differentiated G2V WT, G2V.56KO, and G2V.56KO97KO ESC cultures. CFU-C per 104 V+ cells is shown with colony types indicated by color. Mean ± SEM. (F) Output of CFU-C per 104 V+ in the different colony types: BFU-erythroid, CFU- E, -G, -M, -GM, -GEMM. *P ≤ .05; **P ≤ .01; ***P ≤ .001.
Decreased production of HPCs in the absence of Gpr56 and Gpr97. (A) Schematic of Gpr56 and Gpr97 deletion in mouse Gpr56 locus. (B) RT-PCR analysis of time course hematopoietic differentiation cultures of G2V WT and G2V.56KO97KO ESCs. Relative Gpr97 expression (normalized to β-actin). (C) Representative flow cytometry plots for CD45+ hematopoietic cells and EMPs (CD41+cKit+CD16/32+) from day 10 differentiated G2V WT, G2V.56KO, and G2V.56KO97KO ESC cultures. Percentages shown in each quadrant. (D) Percentage of viable cells and fold change in percentages of V+, CD45+, and EMPs from day 10 differentiated G2V WT, G2V.56KO, and G2V.56KO97KO ESC cultures. n = 3. Mean ± SEM. (E) Frequency of CFU-C in day 10 differentiated G2V WT, G2V.56KO, and G2V.56KO97KO ESC cultures. CFU-C per 104 V+ cells is shown with colony types indicated by color. Mean ± SEM. (F) Output of CFU-C per 104 V+ in the different colony types: BFU-erythroid, CFU- E, -G, -M, -GM, -GEMM. *P ≤ .05; **P ≤ .01; ***P ≤ .001.
CFU-C assays were performed to quantitate HPC production in the V+ fraction of day 10 56KO97KO, 56KO, and WT ESCs. In contrast to 56KO V+ cells in which total CFU-C frequency was similar or slightly increased to WT V+ cells, 56KO97KO V+ cells showed a significant large reduction in total CFU-Cs (Figure 6E). Moreover, there was a significant reduction in the frequency of 56KO97KO-derived BFU-E, CFU-GM, and CFU-GEMM (Figure 6F) compared with WT. Thus, we conclude that definitive HPC production is dependent on expression of Gpr56 and Gpr97.
Discussion
Our demonstration that ESC-derived definitive hematopoiesis is severely reduced in the absence of both Gpr56 and Gpr97 strongly supports functional redundancy in vitro in development. The knockout of Gpr56 alone in mouse ESCs partially affects HPC production and biases output to the myeloid lineage. Moreover, Gpr56-deleted FL HSCs show myeloid lineage bias in vivo. Together, these data support a role for Gpr56 in enforcing multilineage potential on HSCs in the embryo, reveal a developmental stage-dependent redundant function for Gpr97, and suggest that Gpr97 upregulation promotes the myeloid bias of HS/PCs.
Gpr56 deletion provides new insights into the regulation of mammalian hematopoiesis
Despite the high expression of Gpr56 in quiescent adult BM HSCs,25 the function of this adhesion-GPCR in HSCs has been controversial. Whereas a study in human leukemic cell lines and a germline Gpr56−/− mouse model claimed that EVI1-regulated GPR56 maintains the HSC pool in BM niches,26 others reported that this same germline knockout mouse was not impaired in BM HS/PC maintenance or function during homeostasis or stress.25 This was suggested to be due to a hypomorphic Gpr56 allele (low expression of S4 splice variant) or to the mouse background. Our finding of upregulated Gpr56 expression in mouse embryo IAHC cells and the impairment of aortic HS/PC generation in Gpr56 morphant zebrafish embryos12 prompted examination of Gpr56 function during mouse hematopoietic development.
In our studies, Gpr56 was conditionally deleted (exons 4, 5, 6 floxed allele27 ) in HPCs and HSCs of embryos with VECCre and VavCre. E9 YS HPC numbers were reduced, but E10.5 AGM HPC and E13.5 FL LSK-SLAM HPC and HSC numbers were unaffected. The lack of observable differences in AGM HPCs and FL HPCs and HSCs could be due to differences in recombination efficiency of VEC- and Vav-Cre in individual embryos, leading to variable amounts of residual Gpr56. Additionally, it is uncertain whether in some cases aberrant Gpr56 transcripts are present. However, clonal in vivo transplantations of FL LSK-SLAM cells revealed qualitative changes in HSCs. In these clonal experiments, Gpr56 loss was confirmed and affected the lineage-bias of FL HSCs. In vitro Gpr56KO ESC hematopoietic differentiation cultures at day 6 were decreased in phenotypic and functional HPCs, similar to E9 cKO YS. However, day 10 Gpr56KO ESCs were slightly increased in phenotypic and functional HPCs and, like E13.5 cKO FL HSCs, showed significant myeloid bias compared with the control. Hence, Gpr56 likely affects early embryonic hematopoietic generation quantitatively; at later developmental times and/or in distinct microenvironments, it has a role in HSC quality.
Gpr97 influences hematopoietic development in the absence of Gpr56
Compared with the requirement of Gpr56 for HS/PC generation in zebrafish embryos, if Gpr56 was essential for mouse HS/PC generation, embryonic lethality would be expected. Instead, homozygous Gpr56 mutant adults thrive and the characteristics of mutant BM HS/PCs appeared minimal.25,26 Our rescue of Gpr56 morphant zebrafish HS/PCs with mouse Gpr56 and Gpr97 mRNA raises the possibility of receptor redundancy. The linkage of Gpr56 and Gpr97 and the coexpression of these highly homologous receptors in the mouse, together with the loss of genomic synteny in zebrafish allowed us to identify this redundancy. Importantly, gpr97 is not expressed in the zebrafish embryos at the time of HPSC generation.42
Similar to mice, the human GPR56 locus contains highly homologous GPR114 and GPR97 genes in the same 5′ to 3′ configuration. The evolutionary conservation of mouse and human genes/proteins, together with similarities in the embryonic development of mouse and human hematopoietic systems, suggests an overlap in the functions of Gpr56 and Gpr97. Redundancy is supported by our results showing Gpr97 expression in cells of E9 YS, E13.5 FL, and adult BM, and also in cells of days 6 and 10 ESC differentiation cultures. Importantly, in the absence of Gpr56, Gpr97 expression was upregulated in E13.5 FL LSK SLAM cells and day 10 differentiated ESC-derived V+cKit+ hematopoietic cells. No changes were found in Gpr97 expression in Gpr56 cKO E9 YS, E9 AGM, or adult BM. Thus, in the mouse embryo and only in the definitive HSC stage the loss of Gpr56 function is compensated by Gpr97.
Positive role of Gpr97 or negative role of Gpr56 for myeloid bias?
Myeloid bias was observed in cells from in vitro differentiated Gpr56KO ESC cultures and in vivo in the recipients of Gpr56 cKO FL HSCs. Previously, lineage-biased output of HSCs has been reported as an age-related characteristic.43-46 As measured by long-term in vivo clonal transplantation, BM HSCs from young mice yield lymphoid-biased and balanced output. BM from aged mice show a higher frequency of myeloid-biased HSC. Our data showing the myeloid bias of Gpr56 cKO FL HSCs support a qualitative role(s) for Gpr56 in HSC lineage output. Indeed, this qualitative property is established in midgestation mouse embryos when the first adult-repopulating HSCs are generated.2,3 Highly upregulated Gpr56 expression localizes to emerging E10.5/11.5 IAHC cells as they transition from endothelial cells,12 and we show the coexpression of Gpr97 and Gpr56 in single highly enriched AGM HSCs.38
Whether Gpr56 functions to retain multipotency or represses myeloid-bias, or whether Gpr97 (especially its upregulated expression in the absence of Gpr56) activates myeloid-bias is uncertain. In human NK cells, GPR56 negatively regulates immediate effector functions.47 Human polymorphonuclear cells highly express GPR97, whereas monocytes and lymphocytes do not.48 These results highlight a likely balance of these GPCRs in specific subsets of hematopoietic cells as an important factor impacting cellular functions. As we have demonstrated here that ESC-derived hematopoiesis is severely reduced in the absence of both Gpr56 and Gpr97, the specific functions of these 2 closely related receptors can only be addressed through the generation of a double-knockout mouse or human cell line model. Our attempts to generate a Gpr56−/−Gpr97−/− germline mouse have been unsuccessful, likely because of embryonic lethality. Future studies aim to understand the individual roles of these receptors during HSC development by generating a cKO model across both genes and comparing effects with single cKOs and/or individual rescue of Gpr56 and Gpr97.
Send data sharing requests via e-mail to the corresponding authors, Samanta A. Mariani (s.mariani@ed.ac.uk) and Elaine Dzierzak (elaine.dzierzak@ed.ac.uk).
Acknowledgments
The authors thank A. Rossi, F. Glykofrydis, and laboratory members for assistance and critical discussions concerning this study. They acknowledge the assistance of the Queens Medical Research Institute (QMRI) Flow Cytometry facility (S. Johnston, W. Ramsay, and M. George) and the Bioresearch & Veterinary Services (BVS) service staff.
These studies were supported by European Research Council (ERC) AdG (341096), Blood Cancer UK (18010), ZonMW TOP (91211068), and the National Institutes of Health, National Institute of Diabetes and Digestive and Kidney Diseases (RO37 DK54077).
Authorship
Contribution: E.D., A.M., S.A.M., and E.d.P. conceived the project and designed the experiments; E.D. and S.A.M. directed the project; A.M., S.A.M., and E.d.P. performed the experiments; X.P. provided the loxGpr56 mice; C.S.V. and S.A.M. performed hematopoietic transplantation experiments and A.M. and C.R.-S. performed in vitro culturing and HPC assays; M.-L.L helped generate the Gpr56KO embryonic stem cells; A.M. and S.A.M. generated CRISPR/Cas9 constructs; A.M., S.A.M., and C.R.-S. performed molecular analyses; and E.D., A.M., and S.A.M. wrote the manuscript.
Conflict-of-interest disclosure: The authors declare no competing financial interests.
Correspondence: Samanta A. Mariani, University of Edinburgh, Centre for Inflammation Research, Queens Medical Research Institute, 47 Little France Crescent, Edinburgh, EH16 4TJ, United Kingdom; e-mail: s.mariani@ed.ac.uk; and Elaine Dzierzak, University of Edinburgh, Centre for Inflammation Research, Queens Medical Research Institute, 47 Little France Crescent, Edinburgh, EH16 4TJ, United Kingdom; e-mail: elaine.dzierzak@ed.ac.uk.

