

Key Points
T-ALL presents an addiction to AK2.
AK2 targeting provokes mitochondrial dysfunction in T-ALL leading to blast eradication.

Abstract
T-cell acute lymphoblastic leukemia (T-ALL) represents the malignant expansion of immature T cells blocked in their differentiation. T-ALL is still associated with a poor prognosis, mainly related to occurrence of relapse or refractory disease. A critical medical need therefore exists for new therapies to improve the disease prognosis. Adenylate kinase 2 (AK2) is a mitochondrial kinase involved in adenine nucleotide homeostasis recently reported as essential in normal T-cell development, as defective AK2 signaling pathway results in a severe combined immunodeficiency with a complete absence of T-cell differentiation. In this study, we show that AK2 is constitutively expressed in T-ALL to varying levels, irrespective of the stage of maturation arrest or the underlying oncogenetic features. T-ALL cell lines and patient T-ALL–derived xenografts present addiction to AK2, whereas B-cell precursor ALL cells do not. Indeed, AK2 knockdown leads to early and massive apoptosis of T-ALL cells that could not be rescued by the cytosolic isoform AK1. Mechanistically, AK2 depletion results in mitochondrial dysfunction marked by early mitochondrial depolarization and reactive oxygen species production, together with the depletion of antiapoptotic molecules (BCL-2 and BCL-XL). Finally, T-ALL exposure to a BCL-2 inhibitor (ABT-199 [venetoclax]) significantly enhances the cytotoxic effects of AK2 depletion. We also show that AK2 depletion disrupts the oxidative phosphorylation pathway. Combined with pharmaceutical inhibition of glycolysis, AK2 silencing prevents T-ALL metabolic adaptation, resulting in dramatic apoptosis. Altogether, we pinpoint AK2 as a genuine and promising therapeutic target in T-ALL.
Introduction
T-cell acute lymphoblastic leukemia (T-ALL) is an aggressive hematologic malignancy resulting from the oncogenic transformation of T-cell progenitors blocked at various stages of T-cell development. T-ALL accounts for 10% to 15% of pediatric ALL cases and 25% of adult ALL cases. Although T-ALL outcomes have improved with current therapy, survival rates only remain around 50% and 70% after 5 years in adult and pediatric T-ALL, respectively, highlighting the urgent medical need for new therapeutics.1-3 Cytogenetics and global transcriptomic analyses led to the classification of T-ALL into molecular groups characterized by the abnormal expression of specific transcription factors (TAL, LMO1/2, TLX1/3, LYL, HOXA, and MEF2c).4,5 Additional recurrent genetic abnormalities are frequent, irrespective of the maturation stage of arrest, including the loss of key tumor suppressive–genes (eg, inactivating mutations of PTEN and of the CDKN2A tumor suppressor locus) and activation of oncogenic pathways (eg, gain-of-function mutations in NOTCH1 and IL7R/JAK).6,7 To date, this knowledge contributed to the identification of a few candidates eligible for targeted molecular therapies to improve treatment.
AK2 is a mitochondrial adenylate kinase functioning as a rheostat to maintain a constant concentration and a fixed ratio of adenine nucleotides and to monitor the cellular energy equilibrium through nucleotide sensing.8-11 Biallelic inactivating mutations of AK2 have been identified; they result in reticular dysgenesis, accounting for severe congenital immunodeficiency in humans.12-15 All patients studied presented major hematopoietic defects with severe neutropenia and complete arrest of T-cell differentiation. This observation led us to hypothesize that its pathologic counterpart, namely T-ALL, could present addiction to AK2, suggesting this kinase as a potential druggable target to tackle T-ALL maintenance. We performed a descriptive and functional analysis of AK2 in a large set of human primary T-ALL samples. We found that AK2 was broadly expressed across all T-ALL subtypes. Importantly, T-ALL cells were addicted to AK2 with no possible rescue by the alternative cytosolic isoform AK1 in contrast to other cell lineages. Altogether, our results suggest that targeting AK2 could represent a promising new therapeutic tool in T-ALL.
Methods
Patients and surgical samples
Diagnostic peripheral blood or bone marrow samples from 146 adults with T-ALL were analyzed after informed consent was obtained at diagnosis according to the Declaration of Helsinki. Patients were included in the GRAALL 03/05 trials; both were registered at www.clinicaltrials.gov (GRAALL-2003, #NCT00222027; GRAALL-2005, #NCT00327678).
Normal thymic samples were obtained from children who underwent cardiac surgery at the Necker-Enfants-Malades Hospital, with informed consent from the parents. Thymi were dissociated until the single-cell suspension. Specific subpopulations were purified by sorting using FACS ARIA III (BD Biosciences) as previously reported.16 Final purity after sorting was >95%. For total thymi, the presence of rare infiltrating B cells was always found to be <0.5%.17
Hematopoietic stem cells were obtained from cord blood of pregnant women who gave birth at the Saint-Louis Hospital, and the blood was collected after delivery with informed consent of the women. Human CD34+ umbilical cord blood cells were isolated from cord blood and purified by sorting with FACS ARIA III as previously reported.16 The final purity was >98% to 99% of CD34+ umbilical cord blood cells further considered as an enriched population of hematopoietic stem cells and referred to as such.
Molecular analysis
The oncogenetic features of the patients were determined by targeted pan-exon sequencing on Nextera Capture technology (Illumina).
Real-time quantitative polymerase chain reaction
AK2 and AK1 transcript expression was quantified by real-time quantitative polymerase chain reaction (TaqMan System) in an unselected series of 146 T-ALL samples with available complementary DNA. AK2 primers and probe sequences are as follows: AK2 forward, 5′ AAG-AGT-GGC-CGT-TCC-TAC-CA 3′; AK2 reverse, 5′ CCC-CGG-TGA-TGT-CAT-CTT-TC 3′; AK2 probe, 5′ AGG-AGT-TCA-ACC-CTC-CAA-AAG-AGC-CCA 3′. AK1 TaqMan assay was provided by Thermo Fisher Scientific (Hs00176119_m1). AK2 and AK1 transcript levels were calculated with the ΔΔCt method, using Abelson (ABL) as a reference gene.
Cell lines and culture conditions
The JURKAT, PEER, RPMI 8402, CEM, and MOLT4 T-ALL cell lines and RAJI, BV173, RCH-ACV, and REH B-cell lines were grown in RPMI 1640 supplemented with 50 µg/mL streptomycin, 50 IU penicillin, 4 mM l-glutamine, and 10% or 20% fetal bovine serum. Cell cultures were maintained at 37°C in a humidified atmosphere containing 5% carbon dioxide. Cell lines were authenticated by the ATCC and were monitored by in-house immunophenotyping. The immunophenotype status of the cell lines used in this study is provided in supplemental Table 1.
Primary cells and patient-derived xenografts
Patient-derived xenografts (PDXs) were generated from primary T-ALL samples as previously described.22 Briefly, 106 viable cells were xenografted per mouse by intravenous retro-orbital injection. Leukemia development was monitored weekly by blood sample collection to determine the blast infiltration by flow cytometry. Mice were euthanized whenever the tumor burden reached 80% in the blood. Bone marrow from their tibiae, hip, femora, and vertebrae was collected for subsequent ex vivo experiments.
Western blotting
T-ALL cell lines and primary T-ALL samples at diagnosis were washed in phosphate-buffered saline (PBS) and lysed in RIPA buffer (20 mM Tris-HCl, pH 7.5, 150 mM NaCl, 1 mM Na2EDTA, 1 mM EGTA, 1% NP-40, 1% sodium deoxycholate, 2.5 mM sodium pyrophosphate, 1 mM β-glycerophosphate, 1 mM Na3VO4) supplemented with protease and phosphatase inhibitors (Halt Protease and Phosphatase Inhibitor Cocktail; Thermo Fisher Scientific). Cell lysates were separated by 12% sodium dodecyl sulfate–polyacrylamide gel electrophoresis (Mini-PROTEAN; Bio-Rad) and transferred onto nitrocellulose membranes. After blocking 1 hour in Tween-PBS 5% non-fat milk, membranes were incubated overnight at 4°C with the primary antibodies in blocking buffer (anti-AK2 [H-65]; Santa Cruz Biotechnology), anti-AK1 (H-90; Santa Cruz Biotechnology), and anti-actin (Santa Cruz Biotechnology). After washes with Tween-PBS, membranes were incubated for 30 minutes at room temperature with the appropriate secondary antibodies coupled to horseradish peroxidase in blocking buffer. Chemiluminescence signals were detected by using the West Dura SuperSignal or West Femto SuperSignal kits (GE Healthcare Bio-Sciences) on a ChemiDoc XRS from Bio-Rad. Quantitation of protein expression was computed by measuring pixel intensities normalized by the housekeeping signal.
Short hairpin RNA–mediated AK2 knock-down and complementary DNA constructs
Constructions of short hairpin RNA (shRNA) AK2 (shAK2) and the negative control Scramble shRNA (shScramble) have been described elsewhere (shAK2 #2 with the following target sequence: GAAACTGGTGAGTGATGAAAT).23 A pLKO backbone allows shRNA expression through a U6 promoter and coexpression of green fluorescent protein (GFP) under the control of a PGK promoter. pWPI vectors were used for the expression of AK1, AK2A, and AK2B.12,23 The latter vectors enable coexpression of GFP under the control of an EF1α promoter. A similar vector allowing the expression of a shAK2-resistant AK2 variant was generated and kindly provided by E. Six and C. Lagresle. For cell line transduction, vectors were packaged into a vesicular stomatitis virus G (VSVG) envelope, and transductions were performed by spinoculation of the cells for 1 hour at room temperature. For PDX cells, vectors were packaged into a baboon envelope pseudotyped lentivirus (BaEV-LV) and transductions were performed as previously described.24
Conditional induction of AK2 shRNA
Conditional AK2 knockdown experiments were performed with an isopropyl β-D-1-thiogalactopyranoside (IPTG)-inducible AK2 shRNA vector (purchased from Sigma-Aldrich). The AK2 shRNA sequence used in this vector was identical to the sequence of the AK2 shRNA described earlier.23 The inducible vector is a modified PLKO.1 backbone that allows expression of the shRNA only by the addition of IPTG in the medium. This vector also contains a constitutionally expressed GFP as a reporter. A similar construct containing a nontargeting control scramble was used as a negative control in this experiment. These vectors were introduced into a VSVG retroviral package, and the resulting retroviral transduction particles were used to transduce the JURKAT cell line. Highly expressing GFP+ JURKAT cells were then sorted by flow cytometry (FACS ARIA III) 24 hours after the transduction, and the collected cells were used for the conditional induction experiments. The minimal IPTG concentration required to induce the AK2 shRNA expression was determined by a dose–response test performed on the transduced JURKAT cell line. The minimal efficient IPTG concentration determined by this method was found to be 5 mM. Briefly, the sorted JURKAT cells with inducible shScramble or inducible AK2 shRNA were kept in the same culture medium as described earlier, supplemented with 5 mM IPTG or an equal volume of PBS. Every 48 hours, cells were washed in PBS, and fresh media supplemented with 5 mM IPTG or PBS was added. Apoptosis was assessed by flow cytometry using Annexin V-APC and propidium iodide staining at days 2, 5, 9, and 12. The efficiency of the inducible AK2 shRNA vs shScramble was determined by western blotting and real-time quantitative polymerase chain reaction.
Apoptosis, cell cycle analysis, and growth curves
Apoptosis was assessed by flow cytometry using Annexin V-APC and propidium iodide (BD Pharmingen) staining. Cell cycle analysis was performed by flow cytometry using EdU/7-AAD staining purchased from Invitrogen, according to the manufacturer's instructions. Cell viability and cell count were measured with Trypan Blue exclusion using a hemocytometer or an automated cell counter (CASY; Roche Diagnostics).
Mitochondrial depolarization and reactive oxygen species production
Changes in the mitochondrial membrane potential were assessed at sequential time points by using a compound dye that accumulates primarily in mitochondria with active membrane potentials (DilC; Thermo Fisher Scientific). Carbonyl cyanide 3-chlorophenylhydrazone was used as an internal positive control that disrupts the mitochondrial membrane potential. Reactive oxygen species (ROS) were detected by using the CellROX probe (Thermo Fisher Scientific) according to the manufacturer’s recommendations.
Apoptosis profiling assay
The relative level of 35 apoptotic-related proteins was assessed by using the Proteome Profiler Human Apoptosis Array Kit from R&D Systems. JURKAT cells were transduced by using either the AK2 shRNA or the shScramble vectors, as previously described. GFP+ cells were then sorted by flow cytometry (FACS ARIA III) and suspended in the same culture media. The resulting cells were collected 3 days after transduction and washed in PBS; cells were then treated following the manufacturer’s recommendations for the Apoptosis Array Kit. Imaging of the Apoptosis Array Kit was performed on a ChemiDoc XRS, and the results were analyzed with the built-in analysis software. Data are presented as the level of apoptotic-related proteins in JURKAT shAK2 relative to shScramble.
N-acetyl cysteine rescue treatment of AK2 knocked-down cell lines
Drug treatments of AK2 knocked-down cell lines
The BCL-2 inhibitor venetoclax (ABT-199) was purchased from Selleck Chemicals. The glycolytic inhibitor 2-deoxy-d-glucose (2-DG) was purchased from Sigma-Aldrich. CEM, JURKAT, MOLT4, and RPMI 8402 cell lines were electroporated and GFP+ cells sorted as noted earlier. The collected cells were then split into equal numbers and resuspended in complete medium supplemented with dimethyl sulfoxide or increasing concentrations of ABT-199, and one group of cells was supplemented with 2.5 mM of 2-DG. Apoptosis was assessed at day 3 post-electroporation by flow cytometry using Annexin V-APC and propidium iodide staining.
Statistical analysis
Statistical analyses were performed with either a Student t test or analysis of variance according to the nature of the data set by using GraphPad Prism 7 software. Normality tests were applied to determine if the data sets were eligible for either parametric or nonparametric testing. The following symbols were used to indicate significant differences: P > .05 (not significant); *P < .05; **P < .01; and ***P< .001.
Results
AK2 is robustly expressed in T-ALL
We analyzed the transcriptional levels of AK1 and AK2 in T-ALL cell lines and in an extensive series of 146 unselected primary T-ALL samples. Normalized expression was compared with B-cell precursor ALL (BCP-ALL), acute myeloid leukemia, and normal human thymocytes (Figure 1A-B; supplemental Figure 1A-B). AK1 expression levels were significantly lower than those of AK2 in T-ALL samples compared with BCP-ALL (P < .05). Of note, BCP-ALL cell lines also displayed elevated protein levels of AK2 but differed from T-ALL by higher AK1 protein expression (Figure 1C). AK2 protein was found overexpressed in T-ALL cell lines compared with Th96 and Th97 thymi. Expression levels of AK1 and AK2 in T-ALL were relatively stable according to the stage of maturation arrest (supplemental Figure 1C-D). By contrast, AK2 expression varied in normal thymocytes subsets, as it was predominant in immature thymic precursors (CD34+1a+ and CD34+1a- fractions) (supplemental Figure 2), compared with more mature subsets. AK2 expression in T-ALL was further confirmed in 7 primary samples, showing stable AK2 expression with versatile AK1 levels (Figure 1D). The differential expression between AK1 and AK2 in T-ALL was further confirmed by RNA-sequencing of 47 primary T-ALL patients, in whom AK2 transcript levels were found to be significantly higher than those of AK1 (Figure 1E). Taken together, these data suggest that AK2 is robustly expressed in T-ALL in contrast to the isoenzyme AK1, irrespective of the maturation stage.

AK2 isoform exhibit robust expression in T-ALL. (A-B) Transcriptional expression of AK2 (A) and AK1 (B) in thymic subpopulations, total thymus, T-ALL, B-cell ALL (B-ALL), and acute myeloid leukemia (AML) primary cells and lines. Mean ± standard deviation are represented. (C-D) Western blot showing AK2 and AK1 expression in T-ALL cell lines (JURKAT, MOLT4, and CEM), B-ALL cell lines (REH and RCH-ACV), and total thymus (Th96 and Th97) (C) andprimary cells from T-ALL samples (UPN#1-UPN#7) (D). The AK2/actin or AK1/actin ratios are represented under each band. (E) AK1 and AK2 transcriptional expression assessed by RNA sequencing in 47 T-ALL primary samples. *P < .05; **P < .01; ***P < .001. 4ISP, CD4-immature single positive; DP, double positive; ns, not significant; SP, simple positive.
AK2 isoform exhibit robust expression in T-ALL. (A-B) Transcriptional expression of AK2 (A) and AK1 (B) in thymic subpopulations, total thymus, T-ALL, B-cell ALL (B-ALL), and acute myeloid leukemia (AML) primary cells and lines. Mean ± standard deviation are represented. (C-D) Western blot showing AK2 and AK1 expression in T-ALL cell lines (JURKAT, MOLT4, and CEM), B-ALL cell lines (REH and RCH-ACV), and total thymus (Th96 and Th97) (C) andprimary cells from T-ALL samples (UPN#1-UPN#7) (D). The AK2/actin or AK1/actin ratios are represented under each band. (E) AK1 and AK2 transcriptional expression assessed by RNA sequencing in 47 T-ALL primary samples. *P < .05; **P < .01; ***P < .001. 4ISP, CD4-immature single positive; DP, double positive; ns, not significant; SP, simple positive.
Transcriptional AK2 expression displayed no significant difference between oncogenic lesions except T-ALL–bearing SIL-TAL microdeletions that exhibited lower AK2 levels (supplemental Table 2; supplemental Figure 3). In line with this finding, early T-cell precursor–ALL did not exhibit any specific AK2 expression level compared with other T-ALLs.
Although AK2 expression seemed to be a consistent feature in T-ALL, AK2 expression level ranged over 2 log10 of relative expression. We thus compared AK2 expression level across the oncogenetic subtypes. Patients were stratified into 4 groups based on quartiles of AK2 expression. Slight differences were observed in the representation of the immunophenotypic subclasses according to AK2 expression. Notably, T-ALL cases with the lowest AK2 expression tended to be more classified as alpha/beta, when T-ALL from the second quartile contains more early T-cell precursor–ALL (supplemental Table 2).
We also analyzed clinical characteristics of patients with T-ALL according to AK2 expression levels. No difference was seen in terms of age, sex, white blood cell count, or central nervous system infiltration (supplemental Table 2). No differences were observed in terms of response to treatment (corticosensitivity and chemosensitivity, minimal residual disease) and outcome, except a worse overall survival for quartile 1 patients vs quartile 2 to quartile 4 cases. Overall, AK2 expression did not correlate with any specific clinical behavior or oncogenetic characteristic except with a lower expression in the SIL-TAL subgroup.
AK2 knock-down induces apoptosis in T-ALL but not in BCP-ALL
The elevated expression of AK2 in T-ALL regarding normal hematologic tissues suggests that this kinase plays key roles in leukemic cells. To test whether AK2 is required for T-ALL survival, we transduced shRNA targeting AK2 into T-ALL and BCP-ALL cell lines. AK2 silencing was efficient in shAK2-transduced cells compared with shScramble (supplemental Figure 4). AK2 depletion induced an early and massive apoptosis in the JURKAT cell line, with a significantly higher rate of apoptotic cells at day 2 posttransduction (Figure 2A,C).

AK2 knockdown induces early and massive apoptosis in T-ALL cell lines but not in B-cell ALL (B-ALL) cell lines. (A-B) Representative FACS graphs showing the percentage of Annexin V (AnnV) and propidium iodide (PI)-positive cells at day 2 (D2) and day 4 (D4) after shAK2 or shScramble transduction in JURKAT (A) and REH (B) cell lines. (C) Percentage of AnnV and PI-positive cells relative to control every 2 days from D2 post-shAK2 transduction to D8 in 5 T-ALL cell lines (red) and 2 B-ALL cell lines (blue). (D) Relative proliferation as a function of time. (E) Analysis of the different phases of the cell cycle (G0/G1, S, or G2/M) at D2 in the shAK2 or shScramble condition after transduction in 5 T-ALL lines (JURKAT, RPMI-8402, PEER, MOLT4, and CEM) and 2 B-ALL lines (REH and RCH-ACV). (F) Relative proliferation to day 0 of five PDX T-ALL samples after transduction by shScramble (black) or shAK2 (red), measured with a CASY cell counter. (G) Percentage of AnnV and PI-positive cells at day 3 (D3) and day 7 (D7) performed on 5 PDXT-ALL samples after transduction by shScramble (black) or shAK2 (red). (H) Comparison of apoptosis induction between AK2-depleted PDX T-ALL (shAK2) and AK2-expressing cells (shsc) at D3 and D7 performed on 5 PDX T-ALL samples. All experiments were made in technical triplicates for cell lines and in technical duplicates for PDXs. *P < .05; **P < .01; ***P < .001. ns, not significant.
AK2 knockdown induces early and massive apoptosis in T-ALL cell lines but not in B-cell ALL (B-ALL) cell lines. (A-B) Representative FACS graphs showing the percentage of Annexin V (AnnV) and propidium iodide (PI)-positive cells at day 2 (D2) and day 4 (D4) after shAK2 or shScramble transduction in JURKAT (A) and REH (B) cell lines. (C) Percentage of AnnV and PI-positive cells relative to control every 2 days from D2 post-shAK2 transduction to D8 in 5 T-ALL cell lines (red) and 2 B-ALL cell lines (blue). (D) Relative proliferation as a function of time. (E) Analysis of the different phases of the cell cycle (G0/G1, S, or G2/M) at D2 in the shAK2 or shScramble condition after transduction in 5 T-ALL lines (JURKAT, RPMI-8402, PEER, MOLT4, and CEM) and 2 B-ALL lines (REH and RCH-ACV). (F) Relative proliferation to day 0 of five PDX T-ALL samples after transduction by shScramble (black) or shAK2 (red), measured with a CASY cell counter. (G) Percentage of AnnV and PI-positive cells at day 3 (D3) and day 7 (D7) performed on 5 PDXT-ALL samples after transduction by shScramble (black) or shAK2 (red). (H) Comparison of apoptosis induction between AK2-depleted PDX T-ALL (shAK2) and AK2-expressing cells (shsc) at D3 and D7 performed on 5 PDX T-ALL samples. All experiments were made in technical triplicates for cell lines and in technical duplicates for PDXs. *P < .05; **P < .01; ***P < .001. ns, not significant.
This effect was absent in the BCP-ALL REH cell line (Figure 2B). Keeping with this finding, proliferation was dramatically reduced (89%, 92%, and 95% of inhibition in PEER, RPMI 8402, and MOLT4 cells, respectively, at day 8 [D8] posttransduction) (Figure 2D) in all the tested cell lines. We observed that AK2 silencing resulted in a significantly disrupted cell cycle in the JURKAT cell line. An increase in cells in the G0/G1 phase and a decreased proportion in the S phase were reported (Figure 2E). Similar results were obtained with 3 other T-ALL cell lines, RPMI 8402, PEER, and MOLT4 (Figure 2C), even though apoptosis was induced to a lesser extent in RPMI 8402 and PEER. Of note, AK2 depletion in the CEM and BCP-ALL cell lines did not induce apoptosis even though cell proliferation was impaired (Figure 2B-D).
To address whether these results obtained using cell lines could be translated to primary T-ALL, we inactivated AK2 in PDXs obtained from T-ALL samples. AK2 inactivation in PDX T-ALL samples led to a dramatic decrease in proliferation (22% in shScramble cells against 73% in shAK2 cells at D7; P < .05) (Figure 2F). More importantly, AK2 inactivation also resulted in rapid and robust induction of apoptosis (19.8% of apoptotic cells in shScramble cells vs 50.6% at day 3, P < .05; and 19.8% vs 66% at day 7, P < .05) (Figure 2G-H) on 5 independent primary PDX T-ALL samples.
To confirm the on-target effect of AK2 silencing, we first used an inducible model of AK2 inactivation in the JURKAT cell line. This led to significantly reduced AK2 protein expression (supplemental Figure 5). The conditional inducible AK2 knock-down also resulted in a dramatic decrease in cell survival at day 9 postinduction (Figure 3A). We then expressed AK2 isoforms (AK2A/B) generated to be resistant to the shAK2. As expected, the AK2 protein expression was maintained in both lines despite shAK2 inactivation (Figure 3B). Significantly, the overexpression of AK2A/B in the JURKAT and RPMI 8402 cell lines restored cell proliferation induced by AK2 inactivation (Figure 3C-D). Keeping with this scenario, the overexpression of AK2A and AK2B isoforms rescued these cell lines from apoptosis (84% of apoptotic cells in shAK2 JURKAT cells vs 18% in AK2A+B+–overexpressing cells at D8) (Figure 3E). Of note, complementation by AK1 did not rescue apoptosis in T-ALL after AK2 inhibition, suggesting an additional mechanism for the lineage specificity of cell death in T-ALL (supplemental Figure 6).
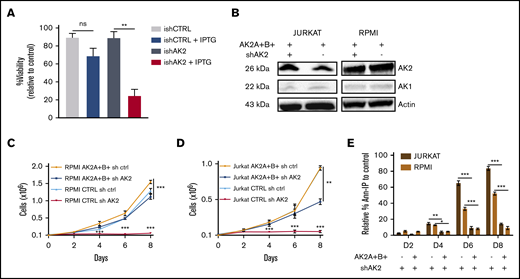
Overexpression of sh-resistant AK2 isoform rescues T-ALL apoptosis. (A) Percentage of Annexin V and propidium iodide (Ann-PI)–negative cells at day 5 post-IPTG induction of JURKAT cells transduced by an inducible shAK2 vector. (B) Western blots of AK2 and AK1 in JURKAT and RPMI 8402 cell lines overexpressing 2 AK2 isoforms resistant to shAK2, AK2A, and AK2B with or without shAK2. (C-D) Absolute number of cells expressing either AK2A and AK2B isoforms or shAK2 or both in JURKAT (C) and RPMI 8402 (D) cell lines over time posttransduction. (E) Percentage of Ann-PI–positive cells expressing either AK2A and AK2B isoforms and shAK2 or shAK2 alone in JURKAT and RPMI 8402 cell lines every 2 days from day 2 (D2) post-shAK2 transduction to D8. All experiments were made in technical duplicates. ns, not significant. *P < .05; **P < .01; ***P < .001. ns, not significant.
Overexpression of sh-resistant AK2 isoform rescues T-ALL apoptosis. (A) Percentage of Annexin V and propidium iodide (Ann-PI)–negative cells at day 5 post-IPTG induction of JURKAT cells transduced by an inducible shAK2 vector. (B) Western blots of AK2 and AK1 in JURKAT and RPMI 8402 cell lines overexpressing 2 AK2 isoforms resistant to shAK2, AK2A, and AK2B with or without shAK2. (C-D) Absolute number of cells expressing either AK2A and AK2B isoforms or shAK2 or both in JURKAT (C) and RPMI 8402 (D) cell lines over time posttransduction. (E) Percentage of Ann-PI–positive cells expressing either AK2A and AK2B isoforms and shAK2 or shAK2 alone in JURKAT and RPMI 8402 cell lines every 2 days from day 2 (D2) post-shAK2 transduction to D8. All experiments were made in technical duplicates. ns, not significant. *P < .05; **P < .01; ***P < .001. ns, not significant.
Altogether, these data highlight the specificity of AK2 knock-down, ruling out off-target effects, thereby supporting the dependency of both T-ALL cell lines and PDXs on AK2.
AK2-depleted T-ALL blasts display mitochondrial apoptosis
We hypothesized that apoptosis induced by AK2 knock-down could be related to mitochondrial dysfunction, given that AK2 is a mitochondrial enzyme. Seventy-two hours posttransduction, AK2-downregulated cells harbored an early mitochondrial depolarization compared with AK2-expressing cells in both the JURKAT and RPMI 8402 cell lines (Figure 4A-B). Cell depolarization was associated with a delayed and substantial increase in ROS in AK2-depleted cells (Figure 4D-E). Interestingly, AK2 knock-down failed to induce both mitochondrial depolarization and ROS generation in the BCP-ALL cell line (Figure 4C,F). We then tried to rescue depolarization and apoptosis with the antioxidant NAC. The addition of NAC to AK2-deficient cells efficiently decreased ROS levels in both the JURKAT and RPMI 8402 cell lines. However, NAC failed to rescue cells from apoptosis (3.2% viable cells in JURKAT shAK2 without NAC vs 3.85% with NAC at D8) (supplemental Figure 7).
![Description of AK2-depleted T-ALL blast apoptosis. (A-C) Mitochondrial depolarization was analyzed by using MitoProbe DilC (5) reagent in JURKAT (A), RPMI 8402 (B), and REH (C) cells transduced with shScramble (gray) or shAK2 (red) with a positive control of depolarization in the presence of carbonyl cyanide 3-chlorophenylhydrazone (CCCP) (green). (D-F) ROS levels in JURKAT (D), RPMI 8402 (E), and REH (F) cell lines transduced with shScramble (gray) or shAK2 (red) detected by using the CellROX probe, in the presence of a positive control of ROS production (hydrogen peroxide [H2O2]; green) and a positive control of inhibitor of ROS (NAC; blue). (G) Apoptosis array showing relative levels of the main proteins upregulated (red) or downregulated (blue) implicated in the apoptotic process in the JURKAT cell line transduced by shAK2 or shScramble at day 3 posttransduction. All experiments were performed in technical duplicates.](https://ash.silverchair-cdn.com/ash/content_public/journal/bloodadvances/5/3/10.1182_bloodadvances.2020002700/2/m_advancesadv2020002700f4.png?Expires=1769889196&Signature=Y8UWbS1dHUjymE6N-Dk2RZsb2Q6PHIKYddMlYrIopxJ8yqG6fd1rNFVmX2QNcOjX1vTixRpPMizN7958uUhh36cPcJSc-lNZKYMGSat7s7CySof7wWm7HFtEx3mfe99ITchNnAOSPmuVim3dTsLricZfJOit1cC9CQprr3r3sIgLJ6fPQju0px41iTVuRyKamlGmG4fhvCC9Lf0-6y6pyi6W5cKcD8abhfKDwnywFUAaZ5v~EGaX5v5FhWAl6usUCi9-23rH1TqxxT0Wmdl6B2jPNGsg9vihH4NTP2ZJlDR2suhB57dwrZu8TnJEhmRfiDKzoWeo0uTA~7g6d0YT4A__&Key-Pair-Id=APKAIE5G5CRDK6RD3PGA)
Description of AK2-depleted T-ALL blast apoptosis. (A-C) Mitochondrial depolarization was analyzed by using MitoProbe DilC (5) reagent in JURKAT (A), RPMI 8402 (B), and REH (C) cells transduced with shScramble (gray) or shAK2 (red) with a positive control of depolarization in the presence of carbonyl cyanide 3-chlorophenylhydrazone (CCCP) (green). (D-F) ROS levels in JURKAT (D), RPMI 8402 (E), and REH (F) cell lines transduced with shScramble (gray) or shAK2 (red) detected by using the CellROX probe, in the presence of a positive control of ROS production (hydrogen peroxide [H2O2]; green) and a positive control of inhibitor of ROS (NAC; blue). (G) Apoptosis array showing relative levels of the main proteins upregulated (red) or downregulated (blue) implicated in the apoptotic process in the JURKAT cell line transduced by shAK2 or shScramble at day 3 posttransduction. All experiments were performed in technical duplicates.
Description of AK2-depleted T-ALL blast apoptosis. (A-C) Mitochondrial depolarization was analyzed by using MitoProbe DilC (5) reagent in JURKAT (A), RPMI 8402 (B), and REH (C) cells transduced with shScramble (gray) or shAK2 (red) with a positive control of depolarization in the presence of carbonyl cyanide 3-chlorophenylhydrazone (CCCP) (green). (D-F) ROS levels in JURKAT (D), RPMI 8402 (E), and REH (F) cell lines transduced with shScramble (gray) or shAK2 (red) detected by using the CellROX probe, in the presence of a positive control of ROS production (hydrogen peroxide [H2O2]; green) and a positive control of inhibitor of ROS (NAC; blue). (G) Apoptosis array showing relative levels of the main proteins upregulated (red) or downregulated (blue) implicated in the apoptotic process in the JURKAT cell line transduced by shAK2 or shScramble at day 3 posttransduction. All experiments were performed in technical duplicates.
To further investigate the role of AK2 depletion, we performed a protein profiling assay to measure the expression of apoptotic-related proteins on AK2 knocked-down JURKAT cells. This analysis revealed a decrease in antiapoptotic proteins embedded in the mitochondrial membrane such as BCL-2 and BCL-XL (75% and 78% inhibition of protein levels, respectively) (Figure 4G) and an induction of proapoptotic proteins such as cleaved caspase-3 and cytochrome c (142% and 49% induction of protein levels, respectively). Taken together, these results suggest that AK2 depletion alters the mitochondrial apoptotic pathway balance.
Apoptosis induced by AK2 depletion is potentiated by BCL-2 inhibition
We then questioned whether AK2 depletion–related apoptosis could be enhanced by BCL-2 inhibition in T-ALL cells. Four AK2 knocked-down T-ALL cell lines and their respective controls were treated with increasing concentrations of venetoclax (ABT-199), a BCL-2 inhibitor. Increased dose–response apoptosis was observed in all the tested cell lines after drug exposure compared with the control (Figure 5A). Specifically, venetoclax 5 µM significantly altered cell survival upon AK2 depletion (Figure 5B-C). These results suggest that BCL-2 inhibition by venetoclax may potentiate the effect of AK2 silencing by disrupting the mitochondrial function and triggering apoptosis.
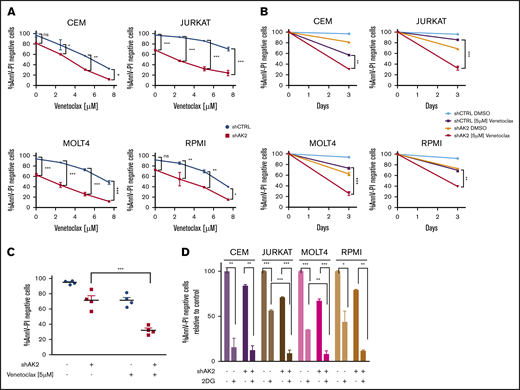
Dual targeting of the mitochondrial pathway or glycolytic pathway enhances AK2-depleted phenotype in T-ALL cells. (A) Survival curves at day 3 of the CEM, JURKAT, MOLT4, and RPMI 8402 cell lines transfected with either shScramble (blue) or shAK2 (red), treated with dimethyl sulfoxide (DMSO) or increasing concentrations of venetoclax (ABT-199). Viability is shown as the percentage of Annexin V and propidium iodide (AnnV-PI)–negative cells for each condition. (B) Survival rate for each of the 4 transduced cell lines treated with either DMSO or venetoclax 5 µM at day 3 (same experiment as panel A). (C) Mean survival rate of the 4 transduced cell lines treated with either DMSO or venetoclax 5 µM at day 3 (same experiment as in panel A). (D) Survival rate at day 3 of the CEM, JURKAT, MOLT4, and RPMI 8402 cell lines transfected with either shScramble (blue) or shAK2 (red), treated with DMSO or 2.5 mM of 2-DG; viability is shown as the percentage of AnnV-PI–negative cells for each condition. All experiments were performed in technical duplicates. *P < .05; **P < .01; ***P < .001. ns, not significant.
Dual targeting of the mitochondrial pathway or glycolytic pathway enhances AK2-depleted phenotype in T-ALL cells. (A) Survival curves at day 3 of the CEM, JURKAT, MOLT4, and RPMI 8402 cell lines transfected with either shScramble (blue) or shAK2 (red), treated with dimethyl sulfoxide (DMSO) or increasing concentrations of venetoclax (ABT-199). Viability is shown as the percentage of Annexin V and propidium iodide (AnnV-PI)–negative cells for each condition. (B) Survival rate for each of the 4 transduced cell lines treated with either DMSO or venetoclax 5 µM at day 3 (same experiment as panel A). (C) Mean survival rate of the 4 transduced cell lines treated with either DMSO or venetoclax 5 µM at day 3 (same experiment as in panel A). (D) Survival rate at day 3 of the CEM, JURKAT, MOLT4, and RPMI 8402 cell lines transfected with either shScramble (blue) or shAK2 (red), treated with DMSO or 2.5 mM of 2-DG; viability is shown as the percentage of AnnV-PI–negative cells for each condition. All experiments were performed in technical duplicates. *P < .05; **P < .01; ***P < .001. ns, not significant.
We speculated if AK2 expression could predict the response to venetoclax. To assess this question, 18 independent primary samples were treated with a single dose of 1 µM of venetoclax, and survival was monitored (supplemental Figure 8). The AK2 expression level was also determined for these primary samples by quantitative polymerase chain reaction. No correlation was found between AK2 expression and the sensibility to venetoclax. However, AK2 loss of function potentiated BCL-2 inhibition, thus reinforcing that AK2 activity, rather than its expression, is essential to T-ALL survival.
AK2 silencing confers sensitivity to glycolysis inhibition
Because AK2 is a critical regulator of oxidative phosphorylation and energy metabolism,11 we next wondered whether T-ALL blasts could switch their metabolic dependencies toward glycolysis in the context of AK2 depletion as a salvage pathway for the cells to survive. We therefore tested whether glycolysis inhibition could synergize with AK2 inactivation to induce cell death. To test this hypothesis, T-ALL cell lines and their respective controls were treated with 2-DG, a glycolysis inhibitor. 2-DG induced a cytotoxic effect on all tested cell lines, indicating that glycolysis is a critical pathway for energy production (Figure 5D). Of note, the CEM cell line, previously identified as resistant to AK2 knock-down, was the most sensitive to 2-DG. Conversely, the JURKAT cell line, whose survival was highly dependent on AK2, was less sensitive to 2-DG. The addition of 2-DG to AK2-knocked-down cell lines induced early and massive cell death in all the cell lines tested. These observations suggest that the high sensitivity of the JURKAT cell line to AK2 knockdown could be explained by a strong dependency to the oxidative phosphorylation pathway, in contrast to CEM, which seems to strongly depend on glycolysis. Altogether, these data suggest that AK2 inactivation leads to mitochondrial dysfunction and massive cell apoptosis in T-ALL, which can be further enhanced by cotargeting the glycolytic pathway.
Discussion
The observation of a complete T-cell differentiation inhibition12,13 in patients with reticular dysgenesis was recently confirmed in a larger cohort by Hoenig et al.15 These data led us to propose that AK2 could be involved in one or more steps essential to the survival of immature T-cell phenotype tumors. Here, we show that T-ALL blasts are addicted to AK2 in vitro in contrast to BCP-ALL (Figures 2 and 3), used as a relevant control to compare the role of AK2 in a lymphoid context. Mechanistically, T-cell precursors depleted for AK2 exhibit mitochondrial depolarization11 associated with significant oxidative stress23,25 (Figure 4). We reproduced this result ex vivo in T-ALL PDX cells. In contrast to other models, we found that antioxidant exposure did not rescue cell death induction.25 Because AK2 plays a key role in regulating mitochondrial energy supply by converting adenosine 5′-diphosphate into adenosine triphosphate at the intermembrane space level,11 it has been shown that the kinase plays an important role in activating oxidative phosphorylation. In this context, we showed that AK2-deficient leukemic cells exhibited an altered oxidative phosphorylation function as reported23 and may rely more on glycolysis to maintain their energy needs, as shown by the synergistic effect of glycolysis targeting and AK2 depletion.
Of note, the BCL-2 inhibitor venetoclax has been shown to inhibit oxidative phosphorylation26,27 and therefore can potentiate AK2 depletion to alter mitochondrial metabolism (Figure 5). Moreover, a functional AK2 has been shown to be necessary for the unfold protein response, which is essential for proper protein folding.28 A metabolic study of cells inactivated or not for AK2 could be conducted to confirm that oxidative phosphorylation is essential for survival of T-ALL blasts, as previously reported in other tumor models.29 In addition, a role for AK2 in acute myeloid leukemia cannot be ruled out given its similar pattern of expression (Figure 1) and the preponderance of the mitochondrial function in this disease.26,27 However, it has been shown that some subtypes of T-ALL have a higher glycolytic metabolism,30 which may represent a salvage pathway for T-ALL cell survival. Thereby, it could explain the resistance of some types of T-ALL to AK2 deficiency, as observed for the CEM line, which is found to rely heavily on glycolysis (Figure 5D). Supporting this statement, the combined inhibition of AK2 and glycolysis led to dramatic apoptosis in all the T-ALL cell lines tested, underscoring the importance of these 2 metabolic pathways for energy production.
AK2 has also been associated with proliferation and apoptosis monitoring in T-cell tumors. It has been proposed to interact with the proapoptotic complex FADD/caspase-10 or with the phosphatase DUSP26.31,32 Interaction studies in T cells could clarify the role of AK2 in this context. The observation that the overexpression of another isoenzyme (AK1) upon AK2 downregulation in T-ALL does not rescue cells from death might uncover other unique functions of AK2 essential for T-cell survival that remain obscure.
In the current study, we identified that the AK2 adenylate kinase is highly expressed in a large set of T-ALL, and we showed that T-ALL cells are addicted to this kinase. Unfortunately, neither a clinical-grade nor research-grade AK2 inhibitor is currently available, to the best of our knowledge. However, there is a rising effort in finding inhibitory compounds against AK2, such as neoandrographolide, as AK2 seems to be implicated in the progression or maintenance of other diseases, including other types of cancer.33,34 This study provides a unique opportunity to tackle leukemic cell maintenance and to induce T-ALL apoptosis. Although the loss of AK2 expression in reticular dysgenesis is linked to sensorineural deafness and profound neutropenia, we believe that these issues can be clinically managed and should not impede treating T-ALL patients with an AK2 inhibitor. Our data should therefore encourage the pharmaceutical industry to develop AK2 inhibitors to improve the poor prognosis of T-ALL, for which new therapeutic strategies are urgently needed. A key advantage of such targeted therapy is the ubiquitous expression of AK2 in T-ALL, suggesting that any T-ALL subtype could benefit from such targeting, irrespective of their maturation stage or underlying oncogenetic features. Altogether, our study pinpoints a potential therapeutic target in T-ALL for which pharmacologic developments are required.
Acknowledgments
This work was supported by grants to the Necker Laboratory from the “Association Laurette Fugain,” the “Comité Départemental de la Ligue Contre le Cancer,” and the Institut National du Cancer. Samples were collected and processed by the Assistance Publique-Hôpitaux de Paris (AP-HP) “Direction de Recherche Clinique” Tumor Bank at Necker-Enfants Malades. The authors thank Marie-Émilie Dourthe for her technical assistance in the production of revised material. This work was supported in the Necker Hematology Department by grants from Association Laurette Fugain, Fondation Association pour la Recherche contre le Cancer and Force Hemato. N.M. was supported by INSERM. G.P.A. was supported by a grant from Fondation de France.
Authorship
Contribution: N.M. developed the methodology, performed the investigation, analysis, validation, and curated the data; M.L. performed the investigation, analysis, and prepared, reviewed, and edited the paper; V.A. conceptualized the study, developed the methodology, validation, gathered resources, curated the data, reviewed and edited the paper, supervised, administered the project, and acquired the funding; M.F. and N.B. performed the investigation and analysis; T.S. performed the analysis; E.S., E.M. and C.L.-P. performed the investigation, and reviewed and edited the paper; E.V. gathered resources; L.L. developed the methodology, curated the data, supervised, prepared the original draft, and reviewed and edited the paper; and G.P.A. visualized, conceptualized, and supervised the study, developed the methodology, performed analysis, validation, curated the data, and prepared the original draft, and reviewed and edited the paper.
Conflict-of-interest disclosure: The authors declare no competing financial interests.
Correspondence: Ludovic Lhermitte, Hôpital Necker Enfants Malades, Laboratoire d’Hématologie, 149 Rue de Sèvres, 75015 Paris, France; e-mail: ludovic.lhermitte@aphp.fr; or Guillaume P. Andrieu, Hôpital Necker Enfants Malades, Laboratoire d’Hématologie, 149 Rue de Sèvres, 75015 Paris, France; guillaume.andrieu@inserm.fr.

