

Key Points
Patients with AML who received IC were compared with those who received ven to investigate predictors of outcomes.
Presence of RUNX1 mutations is associated with better outcomes for ven/aza compared with IC.

Abstract
Venetoclax (ven) plus azacitidine (aza) is the standard of care for patients with newly diagnosed acute myeloid leukemia (AML) who are not candidates for intensive chemotherapy (IC). Some patients who are IC candidates instead receive ven/aza. We retrospectively analyzed patients with newly diagnosed AML who received ven/aza (n = 143) or IC (n = 149) to compare outcomes, seek variables that could predict response to 1 therapy or the other, and ascertain whether treatment recommendations could be refined. The response rates were 76.9% for ven/aza and 70.5% for IC. The median overall survival (OS) was 884 days for IC compared with 483 days for ven/aza (P = .0020). A propensity-matched cohort was used to compare outcomes in the setting of equivalent baseline variables, and when matched for age, biological risk, and transplantation, the median OS was 705 days for IC compared with not reached for ven/aza (P = .0667). Variables that favored response to ven/aza over IC included older age, secondary AML, and RUNX1 mutations. AML M5 favored response to IC over ven/aza. In the propensity-matched cohort analyzing OS, older age, adverse risk, and RUNX1 mutations favored ven/aza over IC, whereas intermediate risk favored IC over ven/aza. In conclusion, patients receiving IC have improved OS compared with those receiving ven/aza. However, in a propensity-matched cohort of patients with equivalent baseline factors, there was a trend toward favorable OS for ven/aza. Specific variables, such as RUNX1 mutations, reported here for the first time, can be identified that favor ven/aza or IC, helping to guide treatment decisions for patients who may be eligible candidates for either therapy.
Introduction
Venetoclax (ven) plus azacitidine (aza) is superior to aza alone for patients with newly diagnosed acute myeloid leukemia (AML) who are unsuitable candidates for intensive chemotherapy (IC).1 Ven/aza is a well-tolerated regimen with high response rates and the potential for deep and durable remissions,2-5 prompting questions related to whether it should be used for select patients who are IC candidates.6-8 Some AML risk factors, considered adverse in the context of IC, have no such association in the context of ven/aza,2,9 suggesting certain characteristics could be identified in patients deemed fit for IC that would nonetheless lead to a recommendation for ven/aza instead. We sought to retrospectively compare a large, single-center cohort of patients with newly diagnosed AML who received ven/aza or IC, with the hypothesis that a subset of patients fit for IC might be identified who would derive more benefit from ven/aza.
Methods
A total of 846 patients with a diagnosis of nonacute promyelocytic AML seen at the University of Colorado from January 2007 to August 2020 were identified. Of these patients, 395 had the following characteristics: no prior therapy, a diagnostic procedure, at least one dose of a disease-modifying treatment, and follow-up to a response assessment or death. Patients with core binding factor cytogenetic abnormalities (n = 36) were excluded because of their well-established favorable prognosis with IC.10 Three hundred fifty-nine patients who met the above criteria were analyzed. The choice of initial therapy for each patient was determined through discussion with the patient and clinician and was based on available agents, patient goals and comorbidities, and clinician experience and judgment. One hundred forty-three received ven/aza, defined as the simultaneous combination of ven and aza at any dose or schedule, and 149 received IC, defined as a multiday cytarabine-containing regimen at ≥100 mg/m2 per day (supplemental Table 1). Sixty-seven patients were treated with other therapies. Baseline cytogenetic testing was available for 290 (99.3%) of 292 patients. Diagnostic next-generation sequencing using a panel of ∼50 genes began in 2015; this was performed for 219 (75.0%) of 292 patients, and European LeukemiaNet (ELN) risk group classification was possible for 248 (84.9%) of 292 patients.10 RAS pathway included NRAS, KRAS, PTPN11, and CBL. Splice gene included SF3B1, U2AF1, SRSF2, and ZRSR2. Older age was defined as ≥65 years. Select compound variables of interest were analyzed. Three hematopathologists retrospectively reviewed all bone marrow biopsies to assign a French-American-British (FAB) category11 ; M0 and M1 were indistinguishable, because cytochemical studies are no longer used. All baseline variables were analyzed as potential outcome predictors in the collective data set, the propensity-matched cohort, and the ven/aza multivariate analysis. Response assessments for IC and ven/aza were made according to ELN10 ; an allowance for a 14-day postresponse assessment period for count recovery was made for ven/aza.10,12 Overall survival (OS) was defined as the time from diagnosis to death; progression-free survival (PFS) was defined as the time from diagnosis to an assessment that the patient was refractory to treatment (defined as a failure to respond to at least 2 IC regimens or at least 1 course of ven/aza), progressed after responding, or died. No patients were lost to follow-up. SAS version 9.4 was used for statistical analyses. Median survival times with Hall-Wellner confidence bands were created using Kaplan-Meier product-limit estimates. Mantel-Cox log-rank analysis was used to compared survival times, with a significance of 0.05. Cox regression was used to compute hazard ratios. Logistic regression models were used to investigate response associations. Forest plots summarizing hazard ratio and odds ratio outcomes for Cox regression survival and logistic regression models were created using R 4.0.3. To account for variables that differed between treatment groups that could bias OS analysis, and to assess the robustness of the full data set to these differences in distributions, propensity-matched cohorts were created using a greedy caliper algorithm13 ; 48 patients in each treatment group were identified using 1-to-1 matching. To reduce the risk of type I errors in univariate analyses, false discovery rate analyses were performed to determine the significance of the predictors after multiple correction testing.14,15 To build multivariate logistic regression and Cox regression models for patients receiving ven/aza, univariate logistic regression and Cox regression models were first performed to identify variables reaching a threshold level for inclusion in an initial multivariate model for those receiving ven/aza; predictors with a univariate P value ≤.10 were included in stepwise multivariate logistic regression and Cox regression models, and final multivariate models included predictors that achieved a multivariate P value ≤.10. The University of Colorado Anschutz Medical Campus Institutional Review Board approved this retrospective analysis.
Results
Baseline characteristics for patients receiving ven/aza and IC are listed in Table 1. Median follow-up times were 808 and 1697 days for ven/aza and IC, respectively.
Baseline characteristics of patients who received ven/aza or IC
| Variable | Ven/aza (n = 143) | IC (n = 149) | P (IC vs ven/aza) |
|---|---|---|---|
| Sex | .1168* | ||
| Male | 72 (50.4) | 78 (52.3) | |
| Female | 71 (49.6) | 71 (47.7) | |
| Median age (range), y | 69.5 (22-91) | 52.7 (19-81) | <.0001†‡ |
| Median bone marrow blast (range), % | 50.3 (10-96.5) | 55.7 (10.5-95.5) | .0639‡ |
| FAB M0/M1 | 87 (60.8) | 63 (42.3) | .0015*† |
| FAB M5 | 14 (9.8) | 19 (12.7) | .4243* |
| KMT2A rearranged | 7 (4.9) | 13 (8.8) | .1954* |
| ELN risk group | <.0001*† | ||
| Adverse | 93 (65.0) | 60 (40.3) | |
| Favorable | 24 (16.8) | 23 (15.4) | |
| Intermediate | 24 (16.8) | 24 (16.1) | |
| Unable to assess | 2 (1.4) | 42 (28.2) | |
| FLT3 ITD | 20 (14.0) | 40 (29.2) | .0019*† |
| NPM1 mutation | 33 (23.1) | 42 (31.3) | .1218* |
| NPM1 mutation + age ≥65 y | 25 (17.5) | 8 (5.4) | <.0001*† |
| IDH mutation | 39 (27.3) | 24 (21.4) | .2829* |
| IDH1 mutation | 15 (10.5) | 7 (6.4) | .2571* |
| IDH2 mutation | 24 (16.8) | 18 (16.1) | .8791* |
| RAS pathway mutation | 26 (18.3) | 11 (14.3) | .4479* |
| TP53 mutation | 25 (17.4) | 4 (5.2) | .0107*† |
| ASXL1 mutation | 36 (25.3) | 11 (14.3) | .0568* |
| Splice gene mutation | 50 (35.2) | 10 (13.0) | .0004*† |
| RUNX1 mutation | 23 (16.2) | 10 (13.0) | .5260* |
| RUNX1 mutation + age ≥65 y | 20 (14.0) | 2 (1.3) | .0002*† |
| Secondary AML | 59 (41.3) | 42 (28.2) | .0189*† |
| Treatment-related AML | 27 (18.9) | 15 (10.1) | .0319*† |
| Prior therapy for MDS or MPN | 17 (11.9) | 15 (10.1) | .6185* |
| Allogeneic stem cell transplantation | 31 (23.1) | 110 (74.8) | <.0001*† |
Data are presented as n (%) unless otherwise indicated.
CI, confidence interval; ITD, internal tandem duplication; MDS, myelodysplastic syndrome; MPN, myeloproliferative neoplasm.
χ2 test.
Statistically significant at α level of 0.05.
Analysis of variance.
Overall response rates (complete remission [CR], CR with incomplete recovery of blood counts [CRi], and morphological leukemia-free state) between the 3 groups were compared. The overall response rate for ven/aza (76.9%) was not significantly different from that for IC (70.5%; P = .2109). There were no differences in early deaths (deaths within 30 days of treatment) between groups (Table 2). We then analyzed differences in OS and PFS and found significant improvements for IC compared with ven/aza (median OS, 884 vs 483 days; P = .0020; median PFS, 814 vs 332 days; P = .0007; Figure 1A-B). Because of the longer median follow-up time for patients receiving IC, we analyzed OS and PFS for IC and ven/aza 2, 3, and 5 years after treatment; these analyses did not differ from the unrestricted analysis (supplemental Table 2).
Response rates and early deaths for patients who received ven/aza or IC
| Variable | Ven/aza | IC | P (ven/aza vs IC) |
|---|---|---|---|
| Response | |||
| CR | 89 (62.2) | 96 (64.4) | |
| CRi | 13 (9.1) | 4 (2.7) | |
| MLFS | 8 (5.6) | 5 (3.4) | |
| Overall response (CR + CRi + MLFS) | 110/143 (76.9) | 105/149 (70.5) | .2109 |
| Death | |||
| Within 30 d of treatment | 7 (4.9) | 8 (5.4) | .8545 |
Data are presented as n (%) or n/N (%).
CR, complete remission; CRi, complete remission with incomplete recovery of peripheral blood counts; MLFS, morphological leukemia-free state.
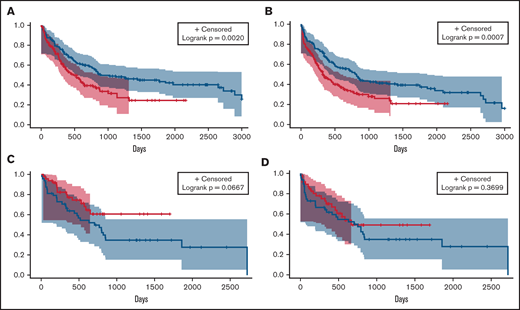
OS and PFS analyses of patients who received IC or ven/aza. Median OS (A) and PFS (B) of patients who received ven/aza (red) vs those who received IC (blue). In a cohort of patients propensity matched for age, ELN risk group, and transplantation status, median OS (C) and PFS (D) of patients who received ven/aza (red) vs those who received IC (blue).
OS and PFS analyses of patients who received IC or ven/aza. Median OS (A) and PFS (B) of patients who received ven/aza (red) vs those who received IC (blue). In a cohort of patients propensity matched for age, ELN risk group, and transplantation status, median OS (C) and PFS (D) of patients who received ven/aza (red) vs those who received IC (blue).
Baseline differences between IC and ven/aza groups existed in factors that could affect OS independently of treatment, such as age, ELN risk group, and transplantation status (Table 1). We therefore generated a propensity-matched cohort of patients receiving IC (n = 48) and ven/aza (n = 48) controlling for these 3 variables (supplemental Table 3; supplemental Figure 1). An analysis of outcomes in the propensity-matched cohort showed a median OS that was not reached for ven/aza and 705 days for IC (P = .0667; Figure 1C). No significant PFS differences were noted between patients receiving IC and ven/aza in the propensity-matched cohort (median, 669 vs 751 days for ven/aza vs IC; P = .3699; Figure 1D).
The reversal in OS trends when analyzing the entire data set and the propensity-matched cohort (Figure 1A vs Figure 1C) suggested that although controlling for key variables that affect OS might have favored the use of ven/aza, there was a clear population of patients who responded well to IC. Furthermore, because no significant differences existed between ven/aza and IC for response rates in the entire data set or OS in the propensity-matched cohort, we sought to ascertain whether particular variables could be identified that would favor IC or ven/aza with respect to response rates, OS, and PFS.
Using the entire cohort, variables that favored ven/aza for CR/CRi relative to IC included older age, presence of a RUNX1 mutation, and secondary AML. The sole factor that favored IC for CR/CRi relative to ven/aza was FAB M5 (Figure 2A). Factors that favored IC for OS relative to ven/aza included FAB M0/M1, ELN intermediate risk, FLT3 ITD, and a RAS pathway mutation, whereas a single compound factor favored ven/aza for OS relative to IC: age ≥65 years and presence of a RUNX1 mutation (Figure 2B). For PFS, factors that favored IC over ven/aza included FAB M0/M1, ELN intermediate risk, KMT2A gene rearrangement, FLT3 ITD, and presence of a RAS pathway mutation. The compound variable of RUNX1 and age ≥65 years favored ven/aza over IC (supplemental Figure 2).
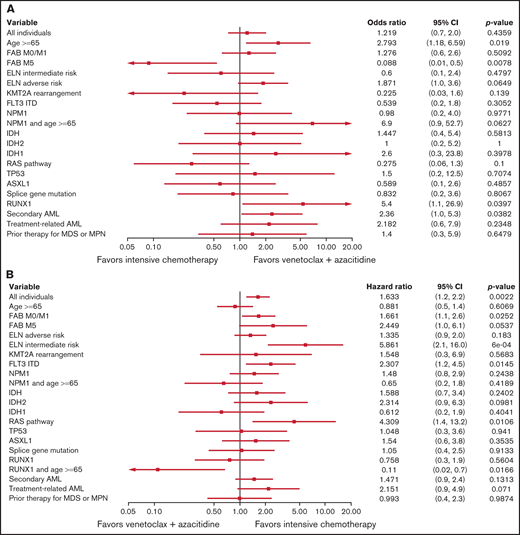
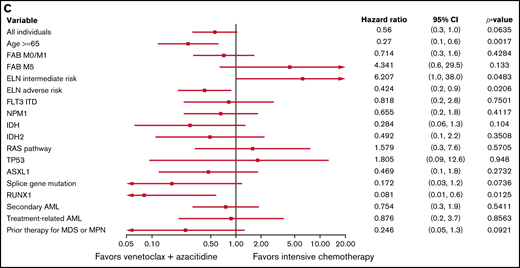
Predictive value of baseline variables for favoring IC or ven/aza. (A) Factors that favored the likelihood of achieving a response (CR or CRi) to IC vs ven/aza. RUNX1 mutation plus age ≥65 years was assessed but not estimable. (B) Factors that favored OS for IC compared with ven/aza. (C) In a cohort of patients propensity matched for age, ELN risk group, and transplantation status, factors that favored OS for IC vs ven/aza. Variables that were assessed but not estimable included NPM1 mutation plus age ≥65 years and RUNX1 mutation plus age ≥65 years.
Predictive value of baseline variables for favoring IC or ven/aza. (A) Factors that favored the likelihood of achieving a response (CR or CRi) to IC vs ven/aza. RUNX1 mutation plus age ≥65 years was assessed but not estimable. (B) Factors that favored OS for IC compared with ven/aza. (C) In a cohort of patients propensity matched for age, ELN risk group, and transplantation status, factors that favored OS for IC vs ven/aza. Variables that were assessed but not estimable included NPM1 mutation plus age ≥65 years and RUNX1 mutation plus age ≥65 years.
As previously noted, differences between treatment groups with regard to age, ELN risk, and transplantation status (Table 1) could confound OS and PFS independently of treatment assignment; therefore, we investigated the factors that favored IC or ven/aza for OS and PFS in the propensity-matched cohort (supplemental Table 3; supplemental Figure 1). In this cohort, factors that favored ven/aza over IC for OS included age ≥65 years, ELN adverse risk, and a RUNX1 mutation; ELN intermediate risk favored IC over ven/aza for OS (Figure 2C). For PFS, the factors that favored ven/aza over IC were age ≥65 years and a RUNX1 mutation; no factors favored IC over ven/aza in the propensity-matched cohort (supplemental Figure 3).
Corrections for multiple comparisons in the entire cohort showed FAB M5 was significant for CR/CRi, ELN intermediate risk was significant for OS, and ELN intermediate risk, KMT2A gene rearrangement, and RAS pathway mutation were significant for PFS (supplemental Table 4). In the propensity-matched cohort, age ≥65 years was significant for OS (supplemental Table 5).
RUNX1 mutations were a consistent factor that favored ven/aza over IC for response rates, OS, and PFS. RUNX1 is an adverse factor in the setting of IC16-21 ; its independent association with outcomes to ven/aza has not been analyzed. We therefore performed a multivariate analysis of patients receiving ven/aza (n = 143) to determine associations of the examined variables with outcomes to ven/aza independently. In this analysis, an NPM1 mutation was the only positive multivariate predictor of CR/CRi, whereas FAB M5 and RAS pathway mutations were negative multivariate predictors of CR/CRi. FLT3 ITD mutations, RAS pathway mutations, TP53 mutations, and treatment-related AML were negative multivariate predictors of OS, whereas stem cell transplantation was the sole positive multivariate predictor of OS. Stem cell transplantation was also the only positive multivariate predictor of PFS, whereas KMT2A rearrangements, RAS pathway mutations, TP53 mutations, and treatment-related AML were negative multivariate predictors of PFS. When assessed in the context of ven/aza, RUNX1 was not predictive of CR/CRi, OS, or PFS (Table 3).
Univariate and multivariate analyses of baseline factors for response, OS, and PFS in 143 patients with newly diagnosed AML treated with ven/aza
| Variable | CR + CRi | Univariate | Multivariate | |||||||||
|---|---|---|---|---|---|---|---|---|---|---|---|---|
Univariate | Multivariate | OS | PFS | OS | PFS | |||||||
| OR (95% CI) | P | OR (95% CI) | P | HR (95% CI) | P | HR (95% CI) | P | OR (95% CI) | P | OR (95% CI) | P | |
| Sex | 2.11 (1.00-4.45) | .0497 | NR | 0.88 (0.57-1.35) | .5466 | 0.85 (0.56-1.28) | .4401 | NR | NR | |||
| Age ≥65 y | 1.23 (0.50-3.00) | .6509 | NR | 1.54 (0.81-2.90) | .1878 | 1.12 (0.64-1.96) | .6834 | NR | NR | |||
| Baseline bone marrow blast percentage | 1.01 (0.99-1.02) | .4181 | NR | 1.00 (0.99-1.01) | .4963 | 1.00 (0.99-1.01) | .5433 | NR | NR | |||
| FAB M0/M1 | 1.52 (0.73-3.16) | .26611 | NR | 1.14 (0.73-1.77) | .5717 | 0.95 (0.63, 1.45) | .8273 | NR | NR | |||
| FAB M5 | 0.26 (0.08-0.80) | .0187 | 0.18 (0.04-0.76) | 0.0198 | 1.68 (0.87-3.27) | .1249 | 1.51 (0.78-2.92) | .2247 | NR | NR | ||
| ELN risk group: adverse vs intermediate | 0.67 (0.24-1.85) | .4358 | NR | 0.96 (0.56-1.67) | .9688 | 1.01 (0.59-1.73) | .8968 | NR | NR | |||
| KMT2A rearrangement | 0.28 (0.06-1.33) | .1092 | NR | 0.76 (0.24-2.41) | .0049 | 3.32 (1.44-7.66) | Sho | NR | 14.88 (5.13-43.19) | <.0001 | ||
| FLT3 ITD | 0.71 (0.26-1.93) | .5012 | NR | 1.68 (0.96-2.95) | .0686 | 1.48 (0.85-2.59) | .1645 | 2.09 (1.17-3.75) | .0132 | NR | ||
| NPM1 mutation | 3.67 (1.20-11.23) | .0225 | 4.69 (1.30-16.95) | .0185 | 0.68 (0.40-1.16) | .1579 | 0.57 (0.34-0.97) | .0389 | NR | NR | ||
| NPM1 mutation + age ≥65 y | 5.68 (1.27-25.32) | .0228 | * | 0.61 (0.33-1.12) | .1114 | 0.52 (0.28-0.96) | .0367 | * | * | |||
| IDH mutation | 2.79 (1.07-7.29) | .0362 | NR | 0.58 (0.35-0.97) | .0389 | 0.51 (0.31-0.84) | .0084 | NR | NR | |||
| IDH1 mutation | 2.85 (0.61-13.23) | .1816 | † | 0.52 (0.24-1.14) | .1032 | 0.48 (0.22-1.03) | .0606 | † | † | |||
| IDH2 mutation | 2.26 (0.72-7.07) | .1624 | † | 0.73 (0.40-1.35) | .3132 | 0.64 (0.36-1.16) | .1433 | † | † | |||
| RAS pathway mutation | 0.21 (0.09-0.52) | .0007 | 0.29 (0.11-0.77) | .0129 | 2.21 (1.31-3.71) | .0028 | 2.79 (1.69-4.61) | <.0001 | 2.51 (1.47-4.28) | .0007 | 3.01 (1.77-5.13) | <.0001 |
| TP53 mutation | 0.54 (0.22-1.33) | .1801 | NR | 2.46 (1.45-4.16) | .0008 | 2.00 (1.19-3.36) | .0088 | 2.95 (1.69-5.15) | .0001 | 2.46 (1.43-4.25) | .0012 | |
| ASXL1 mutation | 0.54 (0.24-1.20) | .1276 | NR | 1.14 (0.70-1.86) | .5893 | 1.30 (0.82-2.05) | .2637 | NR | NR | |||
| Splice gene mutation | 0.69 (0.32-1.45) | .3215 | NR | 0.94 (0.60-1.48) | .8011 | 0.87 (0.56-1.34) | .5180 | NR | NR | |||
| RUNX1 mutation | 1.56 (0.54-4.53) | .4125 | NR | 0.86 (0.47-1.58) | .6206 | 0.78 (0.44-1.41) | .4151 | NR | NR | |||
| RUNX1 mutation + age ≥65 y | 1.24 (0.42-3.67) | .6959 | * | 0.99 (0.52-1.86) | .9655 | 0.92 (0.50-1.70) | .7988 | * | * | |||
| Secondary AML | 0.65 (0.31-1.35) | .2481 | NR | 1.44 (0.94-2.22) | .0952 | 1.40 (0.92-2.12) | .1129 | NR | NR | |||
| Treatment-related AML | 0.51 (0.21-1.21) | .1275 | NR | 2.13 (1.30, 3.49) | .0026 | 1.86 (1.14-3.01) | .0123 | 1.92 (1.16-3.17) | .0108 | 1.95 (1.18-3.23) | .0093 | |
| Prior therapy for MDS or MPN | 0.23 (0.08-0.65) | .0057 | 0.24 (0.08-0.75) | .0134 | 1.55 (0.82-2.93) | .1821 | 1.78 (0.98-3.22) | .0569 | NR | NR | ||
| Stem cell transplantation | 2.56 (0.90-7.26) | .0766 | NR | 0.20 (0.09-0.44) | <.0001 | 0.28 (0.14-0.54) | .0001 | 0.20 (0.09-0.43) | <.0001 | 0.16 (0.07-0.34) | <.0001 | |
CI, confidence interval; HR, hazard ratio; MDS, myelodysplastic syndrome; MPN, myeloproliferative neoplasm; NR, not relevant as multivariate predictor; OR, odds ratio.
Compound variables were not included for analysis in multivariate modeling.
For correlated variables (IDH and IDH1/2), only 1 variable (IDH) was included.
Discussion
Ven/aza has significantly improved the standard of care for patients with newly diagnosed AML deemed unfit for IC.1,2 Suitability for IC has never been sufficiently defined; both subjective and objective methods for assessing this are imperfect.22,23 Furthermore, fitness for IC is a relative assessment; if there are no alternatives to IC, more patients will by necessity be deemed fit, whereas if effective alternatives exist, some patients may be fit for IC but better served by an alternative. Given these considerations, along with the emphasis on lower-intensity therapies during the COVID-19 pandemic,24 it is possible that in the current treatment landscape, fit patients may instead be receiving ven/aza.25 We therefore sought to determine whether a large retrospective comparative analysis of patients who received ven/aza or IC would provide the necessary contrast to determine whether baseline factors exist that differentially favor 1 therapy or another.
As a result of this analysis, for the first time, we report that RUNX1 mutations were associated with better outcomes for ven/aza when compared with IC. Besides older age, RUNX1 mutations were the only factor associated with better outcomes for ven/aza compared with IC in all comparisons (response rates, OS, and PFS) and were typically among the strongest point estimates of the significant variables. Surprisingly, we did not find RUNX1 to be a response, OS, or PFS predictor when a multivariate analysis was performed evaluating only patients receiving ven/aza (Table 3); only in relation to IC was its significance realized. RUNX1 is mutated in ∼10% of patients with AML and can be acquired or germ line.26 The presence of a RUNX1 mutation results in a patient being classified in the ELN adverse risk group,10 based on its association with poor outcomes to conventional therapies.16-21 However, biological evidence exists to support our findings that RUNX1 is not an adverse prognostic factor for ven/aza and may be a positive predictor of outcomes. For instance, RUNX1 is associated with more developmentally primitive disease biology, based on an analysis of the Cancer Genome Atlas data set stratified by FAB category27 (supplemental Figure 4), as well as a recent study showing this association at the single-cell level,28 and ven/aza has been shown to be more active in AML with primitive disease biology.9 In addition, a small case series suggested a genomic signature including RUNX1 was associated with tumor lysis syndrome after treatment with ven,29 suggesting therapeutic potency. Finally, the leukemia stem cell population has dependency on wild-type RUNX1,30 further suggesting a relationship between RUNX1 gene function and primitive biology and making this mutation a logical target for a leukemia stem cell–directed therapy such as ven/aza.31-33 Assuming RUNX1+ AML sensitivity to ven is an observation replicated by others, further work will be required to determine the mechanism. In the meantime, because of its unique differential prognostic value in the context of IC and ven/aza, RUNX1 might be a useful variable to help guide clinical decision making between these competing treatments.
IC was associated with improved OS in our analysis of the entire data set of patients. However, significant baseline differences in age, risk group, and transplantation between all patients receiving ven/aza and IC may at least partially explain this finding. Indeed, accounting for these differences with propensity matching, which decreases the power of the analysis but removes the impact of significant differences in crucial baseline variables, revealed a reversal of the OS trend compared with the larger data set, favoring ven/aza. These discrepancies make general recommendations related to the superiority of 1 therapy over another challenging. However, this lack of clarity, along with the observation that some patients benefit from 1 or the other treatment, led us to investigate the possibility that certain risk factors could be identified that predict responses when 2 distinct therapies are contrasted. The finding related to RUNX1 an unexpected result of this analysis. Other risk factors for IC are well known,10 but in general, these are less well understood for ven/aza.9,34-36 Using regression analyses, we reinforced some recent observations regarding poor risk factors for ven/aza, namely the presence of RAS pathway mutations and FAB M5 disease,9,34,37 both of which favored IC (for OS/PFS and response rate, respectively) and were multivariate negative predictors for OS in patients receiving ven/aza. As a result, it may be suggested that the presence of these features should favor IC as the preferred approach when patients are eligible candidates for ven/aza or IC. Alternatively, as suspected, the presence of certain well-known poor risk factors associated with IC, such as older age and adverse risk cytogenetic/molecular group,10,38,39 favored the use of ven/aza. The converse of this observation also seems to apply; the absence of traditional IC risk factors, best represented by the ELN intermediate risk category, was associated with improved OS and PFS for IC vs ven/aza. With validation and/or further refinement of our findings, an algorithm to use these factors to assist with patient-level treatment decisions related to IC vs ven/aza may be possible.
There are limitations to single-center retrospective studies. Generalizability of these findings to other institutions cannot be assumed, particularly with the lower early death rate, better OS, and higher rate of transplantation for patients receiving IC than larger, multi-institutional studies or community-based centers have reported.40,41 In addition, our reported response rate to ven/aza was higher than that observed in a large multicenter study2 but consistent with other single-center experiences.42 Propensity matching for 3 baseline variables was a necessity; because this was not a randomized study, and there were no formal criteria for the assignment of therapy, the treatment groups were biased with respect to age, ELN adverse risk, and transplantation status. Propensity matching allowed for these factors that would otherwise have affected OS to be controlled, but it removed roughly two-thirds of the patients from the analysis. Finally, many variables were evaluated in this analysis, because the primary intention was hypothesis generation, which was crucial because risk factors for ven/aza are as yet unclear. Controlling for these multiple comparisons left few observations that remained significant (supplemental Tables 4 and 5). For all of these reasons, larger, multi-center and, ideally, prospective studies will be required to validate these findings.
Although other comparative analyses have been published,42,43 we are not aware of other response prediction efforts that searched for relevant variables by contrasting ven/aza and IC. In this analysis, unlike a recent report, we did not find that NPM1 mutations in older patients were associated with better outcomes for ven/aza compared with IC,44 although there were trends in favor of this observation (Figure 2A). In addition, although IDH mutations have been associated with favorable responses to ven,3,4,36,45,46 a finding shared by our univariate analysis (Table 3), this was not a factor that was associated with a differential response to ven/aza compared with IC.
In conclusion, in this retrospective, single-institution analysis, ven/aza and IC had equivalent response rates. OS was superior for IC when all patients were considered, but not when controlling for age, ELN adverse risk, and transplantation. Specific baseline factors, including, as we present here for the first time, the presence of RUNX1 mutations, can help predict whether outcomes are expected to be better with IC or ven/aza for patients who might be candidates for either therapy.
Acknowledgments
The authors thank Jessica Pollyea for her design of the visual abstract.
D.A.P. is supported by the Leukemia and Lymphoma Society’s Scholar in Clinical Research Award and the Robert H. Allen Chair in Hematology Research.
Authorship
Contribution: E.M.C. and D.A. collected the data, performed the analyses, and wrote, edited, and reviewed the manuscript; M.A., C.M., M.S., C.S., and J.A.G. treated the patients and edited and reviewed the manuscript; J.R., A.S., and J.S. performed pathological reviews and reviewed and edited the manuscript; A.I., M.M., S.P., B.S., and C.T.J. reviewed and edited the manuscript; A.W. collected the data and edited and reviewed the manuscript; and D.A.P. collected the data, treated the patients and wrote, edited, and reviewed the manuscript.
Conflict-of-interest disclosure: D.A.P. has served as a consultant and advisory board member for AbbVie and Genentech. The remaining authors declare no competing financial interests.
Correspondence: Daniel A. Pollyea, Division of Hematology, Department of Medicine, University of Colorado, 1665 Aurora Court, Aurora, CO 80045; e-mail: daniel.pollyea@ucdenver.edu.

