

Key Points
Pediatric ALL therapy is equally as deliverable in AYA patients as in children.
MRD assessment and body mass index predict survival in AYA ALL.

Abstract
Pediatric regimens have improved outcomes in adolescent and young adult (AYA) acute lymphoblastic leukemia (ALL). However, results remain inferior to children with ALL. The Australasian Leukaemia and Lymphoma Group (ALLG) ALL06 study (anzctr.org.au/ACTRN12611000814976) was designed to assess whether a pediatric ALL regimen (Australian and New Zealand Children’s Haematology and Oncology Group [ANZCHOG] Study 8) could be administered to patients aged 15 to 39 years in a comparable time frame to children as assessed by the proportion of patients completing induction/consolidation and commencing the next phase of therapy (protocol M or high-risk [HR] treatment) by day 94. Minimal residual disease (MRD) response stratified patients to HR treatment and transplantation. From 2012 to 2018, a total of 86 patients were enrolled; 82 were eligible. Median age was 22 years (range, 16-38 years). Induction/consolidation was equally deliverable in ALL06 as in Study 8. In ALL06, 41.5% (95% confidence interval [CI], 30.7-52.9) commenced protocol M or HR therapy by day 94 vs 39.3% in Study 8 (P = .77). Median time to protocol M/HR treatment was 96 days (interquartile range, 87.5-103 days) in ALL06 vs 98 days in Study 8 (P = .80). Induction mortality was 3.6%. With a median follow-up of 44 months (1-96 months), estimated 3-year disease-free survival was 72.8% (95% CI, 62.8-82.7), and estimated 3-year overall survival was 74.9% (95% CI, 65.3-84.5). End induction/consolidation MRD negativity rate was 58.6%. Body mass index ≥30 kg/m2 and day 79 MRD positivity were associated with poorer disease-free survival and overall survival. Pediatric therapy was safe and as deliverable in AYA patients as in children with ALL. Intolerance of pediatric ALL induction/consolidation is not a major contributor to inferior outcomes in AYA ALL.
Introduction
Multiple trial groups have shown that the adoption of pediatric or “pediatric-inspired” treatment in adolescent and young adult (AYA) acute lymphoblastic leukemia (ALL) leads to improved survival.1-7 Despite this, outcomes from these protocols remain inferior to those in pediatric populations.1 This may be explained by an increased incidence of high-risk (HR) genomic lesions in AYA ALL and higher levels of postinduction minimal residual disease (MRD) and the difficulties in delivering these protocols in older populations, as well as clinician and patient reluctance to adhere to pediatric dose and timing intensity.8-12
MRD is one of the most important prognostic markers in pediatric and adult ALL.13 The significance of day 33 and day 78 MRD was established by the Associazione Italiana di Ematologia e Oncologia Pediatrica & Berlin-Frankfurt-Münster (AIEOP-BFM) 2000 study and highlighted the poor outcome associated with high MRD after induction.14 In the Australian and New Zealand Children’s Haematology and Oncology Group (ANZCHOG) Study 8 trial, based on the AIEOP-BFM 2000 protocol, MRD monitoring was also used to assess the effectiveness of intensified therapy in HR ALL as well as predicting relapse risk after allogeneic stem cell transplantation (SCT).15,16
Based on these findings, we designed an MRD-stratified protocol using the ANZCHOG Study 8 protocol for the treatment of patients aged 15 to 39 years with newly diagnosed Philadelphia-negative AYA ALL: Australasian Leukaemia and Lymphoma Group (ALLG) ALL06.
To assess whether deliverability of the protocol was a factor in determining outcome in an AYA population, we calculated the median time to commencement of protocol M in an initial cohort of 210 Study 8 patients aged <12 years treated at the Cancer Centre for Children, Westmead (hereafter referred to as the “initial Study 8 cohort”). This result was used to determine our primary end point and, in turn, determine the tolerability of this protocol in an AYA population compared with the complete Study 8 cohort of 608 patients aged 1 to 17 years (hereafter referred to as “Study 8”). In addition, an MRD-directed strategy was incorporated for treatment intensification and to determine the timing of SCT for those with postinduction MRD positivity in an attempt to improve outcome in this higher risk population.
Methods
Patients
From July 2012 through June 2018, a total of 86 patients aged 16 to 39 years with newly diagnosed precursor B- or T-cell ALL were enrolled on ALL06 (https://www.australianclinicaltrials.gov.au/anzctr/trial/ACTRN12611000814976) from 15 participating sites in Australia. Patients were required to have a morphologic diagnosis of ALL that fulfilled World Health Organization criteria without evidence of t(9;22)/BCR-ABL rearrangement. All clinicopathologic subtypes were eligible except for mature-B cell or Burkitt ALL. Patients were required to have an Eastern Cooperative Oncology Group performance status of 0 to 3, have adequate hepatic (as defined by total bilirubin level <2.5 × upper limit of normal unless medically correctable) and renal (as defined by serum creatinine levels ≤200 mmol/L unless medically correctable) function, normal left ventricular ejection fraction (as defined by institutional criteria), and be available for follow-up for at least 3 years to be considered eligible for enrollment. Exclusion criteria included previous treatment of ALL or history of cancer (except basal cell skin cancer or carcinoma of cervix in situ or other localized cancer treated with surgical excision only more than 5 years earlier without recurrence), contraindication to the use of study drugs, HIV infection, or evidence of uncontrolled hepatitis B or C infection, and evidence of other severe active infection or other conditions that in the opinion of the investigator may interfere with participation or compliance. Pregnancy did not exclude study participation, with individualized management plans formulated in liaison with study investigators, treating clinicians, and obstetricians. The treatment protocol was approved by the ethics review board of each participating institution. All patients provided written informed consent before starting treatment.
Diagnostic studies
A diagnosis of ALL was based on a bone marrow (BM) infiltrate of ≥20% lymphoblasts with B- or T-lineage determined by flow cytometry according to World Health Organization 2008 criteria. Cytogenetic analyses (using direct methods and unstimulated short-term cultures with G-banding) of BM or peripheral blood (PB) samples were performed on all patients. Fluorescent in situ hybridization studies for BCR-ABL and KMT2A were suggested if cytogenetic analysis failed. Where available, molecular studies for BCR-ABL, KMT2A-AFF1, ETV6-RUNX1, and TCF3-PBX1 transcripts were also performed on BM or PB samples at diagnosis.
Complete remission (CR) was defined as no morphologic evidence of leukemia cells in PB and <5% blasts in BM aspirate and no evidence of extramedullary disease. Relapse was defined as the presence of identifiable leukemic cells in PB on blood film, ≥5% blasts in BM aspirate, or recurrence of extramedullary disease.
Molecular marker identification and MRD analysis
Centralized MRD testing was conducted by using real-time quantitative polymerase chain reaction at the Children’s Cancer Institute (Randwick, NSW, Australia) to measure immunoglobulin or T-cell receptor gene rearrangements according to EuroMRD guidelines.17,18 Briefly, MRD targets were identified by multiplexed polymerase chain reaction, heteroduplex testing and Sanger sequencing, and real-time quantitative polymerase chain reaction MRD assays designed and evaluated to select 2 markers per patient with a sensitivity of ≥10−4 and a quantitative range of ≥10−4 for 1 marker and ≥5 × 10⁻⁴ for the second marker. MRD negativity (MRDneg) was defined as no detectable specific amplification; MRD positivity was split into low positive (MRDlo), including quantifiable and nonquantifiable positives <5 × 10⁻⁴, and high positive (MRDhi) at ≥5 × 10⁻⁴. BM MRD assessment was planned in protocol I at day 33 (time point 1 [TP1]) postinduction and day 79 (TP2) postconsolidation.
Treatment protocol
The ALL06 protocol was based on the ANZCHOG Study 8 protocol and consisted of AIEOP-BFM 2000 treatment blocks.19 Risk groups were defined as outlined in Table 1. A summary of ALL06 is provided in supplemental Figure 1. Recommended dose reductions and delays for hematologic and nonhematologic toxicity are outlined in the full protocol provided in the supplemental Data.
Risk group definitions
| Risk group | Criteria |
|---|---|
| Standard | Must meet all of the following:
|
| Medium | Must meet all of the following:
|
| Medium–high | Must meet all of the following:
|
| High | Must meet all of the following:
|
| Very high | Any one or more of the following:
|
| Risk group | Criteria |
|---|---|
| Standard | Must meet all of the following:
|
| Medium | Must meet all of the following:
|
| Medium–high | Must meet all of the following:
|
| High | Must meet all of the following:
|
| Very high | Any one or more of the following:
|
Day 8 good prednisone response defined as PB blast count <1.0 × 10⁹/L after 7 days of prednisone and 1 intrathecal injection of methotrexate given on day 1.
Day 8 poor prednisone response defined as PB blast count ≥1.0 × 10⁹/L after 7 days of prednisone and 1 intrathecal injection of methotrexate given on day 1.
Protocol I (induction and consolidation phases).
All patients received 7 days of prephase prednisone (60 mg/m2 per day) and 1 dose of intrathecal methotrexate, followed by induction and consolidation phases of treatment. Scheduling and dosing of drugs during protocol I induction and consolidation phases were unchanged between the ANZCHOG Study 8 protocol and ALL06 with the exception of asparaginase preparation. In Study 8, Escherichia coli asparaginase was given at a dose of 5000 IU/m2 intramuscularly (IM) on days 8, 12, 15, 18, 22, 25, 29, and 33 of protocol I induction. In ALL06, the pegylated form of asparaginase was used at a dose of 1000 IU/m2 administered either IM or intravenously on days 8 and 22.
Protocol M and protocol II (induction and consolidation phases).
Standard-risk (SR) and medium-risk (MR) patients received 4 cycles of high-dose methotrexate (5 g/m2) together with 6-mercaptopurine with the protocol unchanged between the 2 groups. SR and MR patients proceeded to protocol II (induction and consolidation) phases that were identical except for the dosing and type of asparaginase preparations used: E coli asparaginase administered at 10 000 IU/m2 on days 8, 11, 15, and 18 in Study 8 and pegylated asparaginase 1000 IU/m2 administered on day 1 in ALL06.
Maintenance therapy.
Maintenance therapy consisted of daily 6-mercaptopurine and weekly oral methotrexate given until a total of 24 months of therapy had been completed.
HR therapy.
Patients considered at higher risk of relapse than those in the MR group were treated with 2 to 3 cycles of HR therapy after the completion of protocol I consolidation with the aim of achieving MRDneg before SCT for medium–high risk (MHR) patients with a matched sibling donor (MSD) or alternative donor for those considered HR or very high risk (VHR). Patients considered VHR for reasons other than TP2 MRD positivity proceeded to a minimum of two HR blocks after completion of induction before proceeding to SCT. Donor selection for SCT was determined by individual transplant center and included the use of haploidentical donors following a protocol amendment in 2017. MHR patients without an MSD but who became MRDneg after HR2 completed protocol II and maintenance therapy. MHR patients who achieved MRDneg after HR3 proceeded to HR1 again to complete 4 cycles of HR therapy before completing protocol II and maintenance therapy. MHR, HR, and VHR patients who failed to achieve MRDneg after HR3 proceeded to SCT if a suitable donor could be identified. MHR, HR, and VHR patients without a suitable donor completed 6 cycles of HR therapy and then proceeded to protocol II and maintenance therapy.
Central nervous system–directed therapy.
Patients with initial central nervous system (CNS) involvement received additional intrathecal methotrexate doses in protocols I and II. Cranial irradiation (18 Gy in 12 fractions commencing at day 38 of protocol II) was administered to all patients with initial CNS involvement and as prophylaxis for all HR or VHR patients who did not proceed to SCT. Cranial irradiation was recommended for all patients with T-cell ALL presenting with a white cell count (WCC) >100 × 109/L.
Statistical analysis
Median time to commencement of protocol M in the initial Study 8 cohort was 94 days (range, 70-129 days). This result was then used to determine our primary end point, the percentage of participants starting protocol M or HR1 by day 94 measured from day 1 of protocol treatment to the date of the first drug administered on protocol M or HR1. This was calculated by using an exact two-sided 95% confidence interval (CI) and compared with existing data from Study 8 by using a χ2 test.
Disease-free survival (DFS) and overall survival (OS) were estimated by using the Kaplan-Meier product limit method with 95% CIs calculated by using Greenwood’s formula for the standard errors. DFS was measured from the date at which CR was achieved until the date of relapse or death for those patients who died in remission. OS was measured from day 1 of protocol treatment.
The univariate and multivariate associations between demographic and clinical features and OS and DFS were tested by using Cox proportional hazards regression models. The univariate associations between these features and day 79 MRD status were summarized as odds ratios with 95% CIs. Changes in MRD level through HR therapy were compared between those with relapse or death as an outcome vs those without by using independent Student t tests or Mann-Whitney U tests as appropriate. Adverse events (AEs) were compared between patients progressing by day 94 vs after day 94 by using a Poisson approximation for event rates and Fisher’s exact tests for proportions of patients.
All analyses were performed by using SPSS version 26, and a two-tailed P value <.05 was taken to indicate statistical significance.
Data collection and analysis were conducted by the ALLG. Data quality was ensured by review of data by the ALLG and study investigators in accordance with ALLG policies and procedures.
Results
Patient characteristics
A total of 86 patients were registered. Four patients were considered ineligible and were excluded from further analysis. Eighty-two patients met eligibility criteria and were included in the analysis for the primary objective. One patient received off-protocol treatment of day 79 MRD positivity and was excluded from additional outcome analysis (Figure 1).
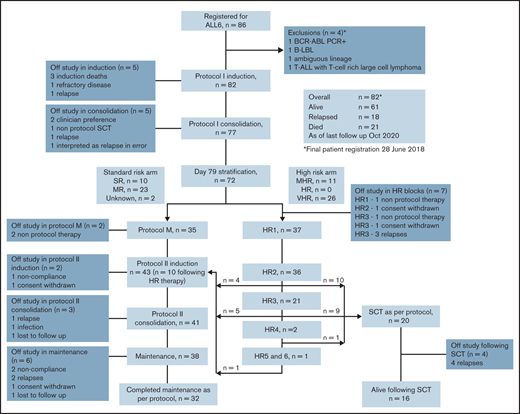
CONSORT diagram outlining outcomes for the 82 patients registered to the ALLG ALL06 study. *Four patients were excluded: 1 with failed diagnostic karyotype and fluorescent in situ hybridization analysis and found to be BCR-ABL positive on polymerase chain reaction (PCR) testing; 1 with B-cell lymphoblastic lymphoma (B-LBL) without evidence of BM involvement; 1 with ambiguous lineage acute leukemia; and 1 with synchronous T-cell ALL (T-ALL) and T-cell–rich large cell lymphoma.
CONSORT diagram outlining outcomes for the 82 patients registered to the ALLG ALL06 study. *Four patients were excluded: 1 with failed diagnostic karyotype and fluorescent in situ hybridization analysis and found to be BCR-ABL positive on polymerase chain reaction (PCR) testing; 1 with B-cell lymphoblastic lymphoma (B-LBL) without evidence of BM involvement; 1 with ambiguous lineage acute leukemia; and 1 with synchronous T-cell ALL (T-ALL) and T-cell–rich large cell lymphoma.
Demographic and pretreatment characteristics are summarized in Table 2. Median age was 22 years, with 25% of patients aged between 29 and 38 years; 71.9% of patients were male. Mean BMI was 25.9 kg/m2 (range, 14.9-50.6 kg/m2). Phenotype was available on 80 patients, 71.3% consistent with B-cell ALL. Median follow-up for the cohort was 44.1 months (range, 1.2-95.7 months). All patients had completed protocol-based therapy at the time of analysis.
Patient characteristics
| Characteristic | Total N = 82 (100%) |
|---|---|
| Sex | |
| Male | 59 (71.9%) |
| Female | 23 (27.1%) |
| Age, y | |
| Median (range) | 22.7 (16.6-38.8) |
| 15-29 | 62 (75.6%) |
| ≥30-38 | 20 (24.4%) |
| BMI, kg/m2 | |
| Mean (range) | 25.9 (14.9-50.6) |
| <30 | 66 (80.5%) |
| ≥30 | 16 (19.5%) |
| ECOG performance status | |
| 0 | 38 (46.3%) |
| 1 | 36 (43.9%) |
| 2 | 8 (9.8%) |
| Immunophenotype | |
| B | 57 (69.5%) |
| T | 23 (28.0%) |
| Unknown | 2 (2.5%) |
| CNS disease | |
| Yes | 8 (9.8%) |
| No | 72 (87.8%) |
| Not assessed/unknown | 2 (2.4%) |
| Presenting WBC, ×109/L | |
| Median (range) | 8.5 (0.4-608) |
| ≥30 | 19 (23.3%) |
| <30 | 63 (76.8%) |
| Day 79 risk stratification* | |
| SR | 10 (13.9%) |
| MR | 23 (31.9%) |
| MHR | 11 (15.3%) |
| HR | 0 (0.0%) |
| VHR | 26 (36.1%) |
| Unknown | 2 (2.8%) |
| Karyotype | |
| t4;11 (q21;q23)† | 6 (7.3%) |
ECOG, Eastern Cooperative Oncology Group.
A total of 72 patients available for day 79 risk stratification.
As assessed by standard karyotype and/or fluorescent in situ hybridization.
Induction deliverability
In ALL06, 41.5% (95% CI, 30.7-52.9) of patients commenced protocol M or HR1 by day 94 compared with 39.3% (95% CI, 35.4-43.3) in Study 8 (P = .77). In evaluable patients, median time to TP1 was 33 (range, 30-47) days and TP2 was 93 (range, 76-155) days. The median time to protocol M or HR therapy commencement was 96 days (interquartile range, 87.5-103 days) in ALL06 and 98 days (interquartile range, 89-103 days) in Study 8 (P = .80).
Induction outcomes
Three patients (3.6%) died during protocol I, one of cerebral vein thrombosis, one of pancreatitis, and one of multi-organ failure related to sepsis. CR was achieved in 90.2% of patients at TP1; of the remaining 72 patients available for assessment, 96.3% achieved CR at TP2. In Study 8, protocol I mortality was 0.5% with CR rates at TP1 and TP2 of 98.6%. There were no treatment-related deaths beyond protocol I induction.
Toxicity
Grade 3/4 AEs in patients proceeding to protocol M or HR1 by day 94 vs after day 94 are outlined in supplemental Table 1. In a post hoc analysis, in the cohort not proceeding by day 94, more patients (P = .018) experienced more nonhematologic grade 4 AEs (P = .013). Increased overall AEs were reported for those proceeding by day 94 (P = .019) related to increased anemia events reported in a greater proportion of this cohort (supplemental Table 2).
Mortality, DFS, and OS
As of October 2020, a total of 61 (74%) participants were alive, and 21 (26%) had died. Eighteen patients have relapsed, 16 with BM and 2 with combined BM and CNS relapse. Of these, 14 patients have died. Six proceeded to SCT after relapse. Eleven patients relapsed after receiving at least 1 HR block. Four patients relapsed after completing maintenance. Of these, 1 had been previously exposed to HR block therapy due to MHR status. These 4 relapsed patients remain alive at last follow up: 1 after chimeric antigen receptor T-cell therapy and 3 after SCT. Estimated 3-year OS was 74.9% (95% CI, 65.3-84.5), and estimated 3-year DFS was 72.8% (95% CI, 62.8-82.7) (Figure 2). Study 8 outcomes were a 3-year OS of 93.4% (95% CI, 91.3-95.4) and a 3-year DFS of 82.7% (95% CI, 79.6-85.8).
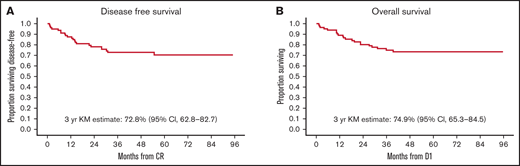
Survival outcomes. At a median follow-up of 44 months, 61 (74%) participants were alive, and 21 (26%) had died. (A) Kaplan-Meier (KM)-estimated 3-year DFS is 72.8% (95% CI, 62.8-82.7). (B) KM-estimated 3-year OS was 74.9% (95% CI, 65.3-84.5). In comparison, Study 8 outcomes were an estimated 3-year DFS of 82.7% (95% CI, 79.6-85.8) and a 3-year OS of 93.4% (95% CI, 91.3-95.4). D1 is day 1 of protocol treatment.
Survival outcomes. At a median follow-up of 44 months, 61 (74%) participants were alive, and 21 (26%) had died. (A) Kaplan-Meier (KM)-estimated 3-year DFS is 72.8% (95% CI, 62.8-82.7). (B) KM-estimated 3-year OS was 74.9% (95% CI, 65.3-84.5). In comparison, Study 8 outcomes were an estimated 3-year DFS of 82.7% (95% CI, 79.6-85.8) and a 3-year OS of 93.4% (95% CI, 91.3-95.4). D1 is day 1 of protocol treatment.
Risk stratification and MRD response
MRD markers were identified in 77 of 82 patients. Seventy had MRD results available at TP1 and TP2 (Table 3). At TP2, a total of 72 patients were eligible for risk stratification. Of these, risk criteria could be confirmed in 70 patients: SR = 10 (14%), MR = 23 (32%), MHR = 11 (14%), VHR = 26 (36%), but not in 2 (unknown, 4%). No patient met criteria for HR. TP2 MRDneg was not associated with sex, age, phenotype, or time to commencement of protocol M/HR1 (supplemental Table 3). Ten patients were MRDneg at both TP1 and TP2. Of these, 1 has relapsed, and there are no deaths in this group.
Protocol I MRD response
| MRD response | Total (N = 70)* | |
|---|---|---|
| TP1 | TP2 | |
| Negative | 11 (15.7%) | 41 (58.6%) |
| Low positive | 28 (40.0%) | 18 (25.7%) |
| Positive | 31 (44.3%) | 11 (15.7%) |
| MRD response | Total (N = 70)* | |
|---|---|---|
| TP1 | TP2 | |
| Negative | 11 (15.7%) | 41 (58.6%) |
| Low positive | 28 (40.0%) | 18 (25.7%) |
| Positive | 31 (44.3%) | 11 (15.7%) |
A total of 77 patients had an MRD marker identified at diagnosis. Three patients died in induction before TP1. Four patients were taken off protocol before the TP2 assessment.
Impact of HR therapy and SCT outcomes
Thirty-seven patients proceeded to HR blocks and received at least 1 cycle of HR therapy. Of these, 11 were considered MHR and 26 VHR. Two patients with no MRD marker were considered VHR: 1 with t(4;11) and 1 with T-cell phenotype, presenting WCC >100 × 109/L and poor prednisone response at day 8. The median number of HR cycles administered was 2 (range, 1-6). No treatment-related deaths occurred during HR blocks. At the beginning of HR therapy, for the 35 patients with an MRD marker, 11 (31.4%) were MRDhi: 2 became MRDneg, 4 became MRDlo, and 4 remained MRDhi during HR therapy, with 1 patient taken off study. Eighteen (51.4%) were MRDlo: 12 became MRDneg, 5 remained MRDlo, and 1 became MRDhi. All 6 (17.2%) MRDneg patients remained MRDneg through HR therapy. Overall, 69% of HR patients had improved MRD response or maintained MRD negativity during HR therapy.
Twenty patients, including 1 MHR patient, proceeded to SCT as consolidation of HR therapy as per protocol in first CR (CR1). Of these, 4 have died of relapse, with no transplant-related deaths. Sixteen remain alive and relapse free. Of the 10 MHR patients who did not proceed to SCT in CR1, 4 have relapsed, with 3 deaths. In the group of HR-treated patients who remain alive without relapse, there was a significant and progressive reduction in absolute MRD values from day 79 after HR2 and HR3 blocks in contrast to those who relapsed and died who experienced an absolute increase in MRD values after HR2 and HR3 (supplemental Table 4). Overall, 3-year DFS for patients proceeding to SCT in CR1 on protocol was similar to patients who did not proceed to SCT (75.0% vs 69.5%; P = .76). Three-year OS was also not significantly different for on-protocol SCT vs non-SCT patients (75.0% vs 75.0%) (supplemental Table 5).
Predictors of outcome
On univariate analysis, TP2 MRDneg was associated with an improved 3-year DFS of 84.5% (95% CI, 73.1-95.9) vs 57.9% (95% CI, 39.7-76.2) and an improved 3-year OS of 91.9% (95% CI, 81.0-100.0) vs 61.9% (95% CI, 44.1-79.6) in patients who had any level of TP2 MRD positivity. Risk higher than MR was associated with poorer 3-year OS (hazard ratio [HR], 4.27; 95% CI, 1.20-15.17; P = .025) but not DFS (HR, 2.40; 95% CI, 0.91-6.32; P = .077) (Table 4). BMI ≥30 kg/m2 was associated with poorer 3-year DFS: 53.3% (95% CI, 28.1-78.6) vs 77.5% (95% CI, 67.1-87.9) with an HR of 1.07 (95% CI, 1.01-1.14; P = .023). Three-year OS was also inferior in patients with BMI ≥30 kg/m2: 49.2% (95% CI, 24.3-74.1) vs 81.1% (95% CI, 71.4-90.8), with an HR of 1.10 (95% CI, 1.05-1.16; P < .001) (Figure 3). Sex, age, phenotype, and time to protocol M/HR therapy had no impact on DFS or OS. On multivariate analysis of factors predicting DFS, only TP2 MRDneg was associated with improved DFS (HR, 0.35; P = .034), whereas BMI ≥30 kg/m2 was associated with inferior DFS (HR, 1.07; P = .048). TP2 MRDneg was the only factor associated with improved OS (HR, 0.19; P = .006), whereas BMI ≥30 kg/m2 was the only factor associated with inferior OS (HR, 1.10; P = .003) on multivariate analysis (Table 5).
Univariate predictors of survival
| Factor | DFS | OS | ||||
|---|---|---|---|---|---|---|
| HR | 95% CI | P | HR | 95% CI | P | |
| Female sex | 0.85 | 0.32-2.32 | .758 | 1.50 | 0.60-3.71 | .385 |
| Age (less than the median) | 1.01 | 0.44-2.33 | .985 | 0.85 | 0.36-2.01 | .715 |
| Risk (not standard or medium)* | 2.40 | 0.91-6.32 | .077 | 4.27 | 1.20-15.17 | .025 |
| Phenotype (B) | 2.57 | 0.75-8.79 | .132 | 1.84 | 0.61-5.51 | .276 |
| Time to M/HR1 (less than the median) | 0.60 | 0.26-1.40 | .237 | 0.47 | 0.19-1.13 | .091 |
| TP2 MRDneg* | 0.32 | 0.13-0.82 | .017 | 0.20 | 0.06-0.64 | .007 |
| BMI ≥30 kg/m2* | 1.07 | 1.01-1.14 | .023 | 1.10 | 1.05-1.16 | <.001 |
Factors entered into multivariate analysis.
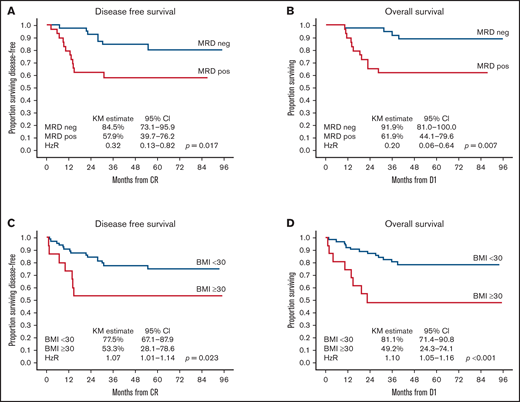
Impact of TP2 MRD and BMI on outcomes. TP2 MRD negativity was associated with significantly better 3-year DFS (84.5%; 95% CI, 73.1-95.9) (A) and OS (91.9%, 95% CI, 81.0-100.0) (B) compared with TP2 MRD positivity, with a 3-year DFS of 57.9% (95% CI, 39.7-76.2; P = .017) and an OS of 61.9% (95% CI, 44.1-79.6; P = .007). BMI ≥30 kg/m2 was associated with significantly poorer 3-year DFS (53.3%, 95% CI, 28.1-78.6) (C) and OS (49.2%; 95% CI, 24.3-74.1) (D) compared with BMI <30 kg/m2 with a 3-year DFS of 77.5% (95% CI, 67.1-87.9; P = .023) and an OS of 81.1% (95% CI, 71.4-90.8; P < .001). D1 is day 1 of protocol treatment.
Impact of TP2 MRD and BMI on outcomes. TP2 MRD negativity was associated with significantly better 3-year DFS (84.5%; 95% CI, 73.1-95.9) (A) and OS (91.9%, 95% CI, 81.0-100.0) (B) compared with TP2 MRD positivity, with a 3-year DFS of 57.9% (95% CI, 39.7-76.2; P = .017) and an OS of 61.9% (95% CI, 44.1-79.6; P = .007). BMI ≥30 kg/m2 was associated with significantly poorer 3-year DFS (53.3%, 95% CI, 28.1-78.6) (C) and OS (49.2%; 95% CI, 24.3-74.1) (D) compared with BMI <30 kg/m2 with a 3-year DFS of 77.5% (95% CI, 67.1-87.9; P = .023) and an OS of 81.1% (95% CI, 71.4-90.8; P < .001). D1 is day 1 of protocol treatment.
Multivariate predictors of survival
| Factor | DFS | OS | ||||
|---|---|---|---|---|---|---|
| HR | 95% CI | P | HR | 95% CI | P | |
| TP2 MRDneg | 0.35 | 0.13-0.92 | .034 | 0.19 | 0.06-0.63 | .006 |
| BMI ≥30 kg/m2 | 1.07 | 1.00-1.14 | .048 | 1.10 | 1.03-1.17 | .003 |
| Factor | DFS | OS | ||||
|---|---|---|---|---|---|---|
| HR | 95% CI | P | HR | 95% CI | P | |
| TP2 MRDneg | 0.35 | 0.13-0.92 | .034 | 0.19 | 0.06-0.63 | .006 |
| BMI ≥30 kg/m2 | 1.07 | 1.00-1.14 | .048 | 1.10 | 1.03-1.17 | .003 |
Discussion
This study shows that an intensive pediatric ALL induction protocol can be delivered in an AYA cohort in a similar time frame to a pediatric population, suggesting that the inferior outcomes seen in AYA patients are more likely related to the biology of AYA ALL rather than intolerance of more intensive therapy. In addition, we confirm the prognostic significance of postconsolidation MRD and BMI in an AYA population when using a BFM-inspired protocol. Finally, we provide the first report of the safety and efficacy of an MRD-stratified approach using BFM HR therapy in an AYA cohort and show that this strategy is moderately efficacious in patients who would otherwise be considered at high risk of relapse and death.
Our primary end point was determined by using a cohort of children with ALL aged <12 years treated by using the same induction/consolidation protocol. Using this end point, we have shown that protocol I induction/consolidation of the BFM protocol can be delivered by adult clinicians in an equivalent time frame in a similar proportion of AYA patients as in children. Protocol M or HR therapy was equally delayed in both ALL06 and Study 8. In ALL06, delay was associated with increased grade 4 nonhematologic AEs. Anemia, reported more frequently in those proceeding by day 94, would not be expected to delay progression, which was based on partial recovery of WCC, neutrophil, and platelet count. Anemia may also have been underreported where progression was delayed by other AEs. Given the post hoc nature of this analysis, these results should be interpreted with caution.
No prior studies have assessed deliverability as a primary end point. Nordic Society of Paediatric Haematology and Oncology (NOPHO) ALL2008 reported no difference in induction and postinduction duration between adults and children except in the delivery of HR therapy.1 Young adults experienced greater hematologic toxicity, delays, and dose modifications than adolescents treated using PETHEMA ALL-96, but there was no direct comparison with a pediatric population.2 In GRAALL-2003, patients aged 45 to 60 years had poorer EFS and OS than those aged 15 to 45 years, in association with prolonged time to consolidation blocks 1 and 4 in older patients.9 Using an unmodified HR pediatric regimen in 15- to 24-year-olds, the JALSG (Japan Adult Leukemia Study Group) reported treatment delays throughout the protocol, but no comparison with the pediatric cohort was reported.4 In Cancer and Leukemia Group B (CALGB) 10403, hepatic and thrombotic toxicity during induction was more frequent than in Children’s Oncology Group (COG) AALL0232; toxicities after remission were similar.3,20 A recent analysis suggested a trend for greater treatment delays in CALGB 10403 vs AALL0232 when assessed from the beginning of induction until maintenance.21 In UK ALLXII, delayed postremission therapy was associated with poorer EFS and OS after SCT.22
Postconsolidation MRD was predictive of outcome in ALL06 using time points established by the AIEOP-BFM group in pediatric pre–B-cell ALL.14 In AIEOP-BFM 2000, the TP1 MRD positive cohort that became MRD negative at TP2 had a 5-year cumulative incidence of relapse of 20.9% vs 40.7% if TP2 MRD remained detectable but at levels <10−3. In GMALL 05/93 and 06/99, patients achieving MRDneg/<10−4 at week 11 had a 3-year DFS of 59.1%, significantly better than those who remained MRD positive.23 In our study, TP2 MRDneg was associated with a 3-year DFS of 84.5% and an OS of 91.9%, comparing favorably to other reports. Using an augmented BFM protocol, Rytting et al24 noted a 3-year CR duration of 82% and an OS of 83% in the cohort who were MRDneg at day 84. The recent GIMEMA LAL-1308 trial using a similar MRD-stratified protocol reported a 48-month DFS of 71.5% and an OS of 74.5% for those with a TP2 MRD of <10−3.7 Our results are similar to CALGB 10403 for end-induction MRDneg patients, although this study was not MRD stratified and serial MRD samples were available in only 80 of 318 participants.3
BMI remained an independent risk factor for outcome in our study. Obesity has been identified as a risk factor for relapse, inferior EFS, and high postinduction MRD levels in several COG studies.25,26 In adults, obesity is an independent risk factor for inferior 3-year EFS and has been associated with a reduction in cytotoxic dosing.27 In CALGB 10403, BMI >30 kg/m2 was associated with inferior DFS and OS with a similar impact to that seen in our study and was associated with poorer outcomes on relapse.3 Multiple mechanisms underlying the poor outcomes of obese children and adults with ALL have been postulated, including a predisposition to higher risk disease.28,29 To the best of our knowledge, this report is the first suggesting a negative impact of BMI on outcome in an AYA population treated by using a BFM protocol.
HR therapy with serial MRD monitoring to optimize timing of SCT is a novel approach in AYA ALL. We considered that failure to achieve TP2 MRDneg would be associated with higher relapse risk given the increased incidence of HR genomic alterations expected in this cohort and prior reports that these abnormalities may enrich for higher levels of TP2 MRD.12,30 Using Study 8 criteria and including those with any detectable TP2 MRD, 51.4% of postinduction patients proceeded to HR therapy on our study. This rate was higher than that seen in both Study 8 (10.7%) and AIEOP-BFM 2000 (15.6%) using identical HR criteria except for a TP2 MRD threshold of ≥5 × 10⁻⁴ in the pediatric studies.15,19 HR therapy was safe, with 56.8% of patients proceeding to SCT, resulting in similar outcomes to those not requiring SCT on protocol. HR therapy resulted in an overall reduction in MRD levels; however, the impact was modest in the MRDhi cohort with only 18% of this group achieving MRDneg before SCT. Patients who were considered higher than MR in ALL06 had a 3-year DFS of 63.4% (95% CI, 54.2-84.4) and an OS of 69.3% (95% CI, 54.2-84.4) (supplemental Figure 2), which compares favorably to similar studies.5-7 Relapse outcomes were dismal, with only 22% alive at last follow-up, consistent with outcomes reported by others (supplemental Figure 3).31 Because most patients were taken off study at relapse, salvage details for the majority of these patients are unknown. Whether improved access to novel salvage therapies in the contemporary setting could improve outcomes for AYA patients who relapse after exposure to an intensive pediatric protocol remains uncertain.32,33
The current study suggests that treatment intolerance is not a significant contributing factor to poorer outcomes in AYA ALL. Given the effectiveness of the bispecific antibody blinatumomab in the relapsed/refractory MRD-positive ALL setting, we are now exploring the use of this agent in protocol I consolidation to improve TP2 MRD negativity rates in de novo AYA pre–B-cell ALL.34 In addition, we are exploring cytotoxic dose adjustments based on BMI in an attempt to minimize the negative impact of obesity in our current AYA ALL study. By addressing the factors predicting poorer outcomes from this study, we hope to significantly improve the outcomes for patients on future ALLG ALL studies.
Acknowledgments
The authors thank the patients and their families who participated in ALL06. The authors also thank the following investigators and their institutions for participation in this study: Sushrut Patil, The Alfred Hospital, Melbourne; Emma Palfreymann and Philip Crispin, Canberra Hospital, Canberra; Matthew Wright and Julian Cooney, Fiona Stanley Hospital, Perth; Campbell Tiley and Mark Dean, Gosford Hospital, Gosford; Michael Harvey, Liverpool Hospital, Liverpool; Devinder Gill, Princess Alexandra Hospital, Brisbane; Susan MacCallum, Prince of Wales Hospital, Randwick; Agnes Yong, Peter Bardy, and Ian Lewis, Royal Adelaide Hospital, Adelaide; Keith Fay, Chris Arthur, and Ian Kerridge, Royal North Shore Hospital, Sydney; Stephen Larsen, Christina Brown, Liane Khoo, and Harry Iland, Royal Prince Alfred Hospital, Sydney; Bradley Auguston, Dustin Hall, Carolyn Grove, and Dejan Radeski, Sir Charles Gairdner Hospital, Perth; Amanda Johnston, Kenneth Micklethwaite, Ian Bilmon, David Gottlieb, and Warwick Benson, Westmead Hospital, Sydney; Kim Cartwright, Peter Presgrave, and Gurdeep Parmar, Wollongong Hospital, Wollongong; Ashlee Burt, ALLG, Melbourne; and Anthea Ng, Cancer Centre for Children, The Children’s Hospital at Westmead, Westmead.
This work was supported by The Barr Family Foundation and the Clinical Oncological Society of Australia (COSA) Youth Cancer Networks Program (YCNP) funded by the Australian Federal Department of Health and Ageing.
Authorship
Contribution: M.G. designed and conducted the study, analyzed the data, wrote the manuscript, and was study co-principal investigator from 2015 to the present; T.T. assisted in designing the study and edited the manuscript; R.S. assisted in designing the study, performed and analyzed the MRD data, and edited the manuscript; M.O., J.K., S.M., R.H., A.A., B.W., J.D., M.H., I.I., D.Y., and L.C. conducted the study and edited the manuscript; A.J. and D.E. coordinated the study; N.V. performed MRD analyses and edited the manuscript; C.F. provided statistical analyses and edited the manuscript; A.H.W. conducted the study and edited the manuscript; K.B. designed and conducted the study, edited the manuscript, and was study coprincipal investigator from 2010 to 2015; and L.D.-P. designed the study, edited the manuscript, and has been study coprincipal investigator from 2010 to the present.
Conflict-of-interest disclosure: M.G. has served on advisory boards for Amgen, Pfizer, Servier, and Jazz Pharmaceuticals; and has received trial and research support from Amgen and Servier. M.O. has received nonfinancial support from Amgen, Pfizer, and Novartis outside the submitted work. A.A. reports consultancy for Bayer; and research funding from Merck Serono. M.H. reports serving on advisory boards; and receiving honoraria from Takeda, MSD, Gilead, BMS, and Roche. D.Y. reports honoraria from Pfizer, Novartis, BMS, and Amgen. L.C. reports honoraria from Amgen. The remaining authors declare no competing financial interests.
Correspondence: Matthew Greenwood, Department of Haematology, Royal North Shore Hospital, Level 5, Acute Services Building, Reserve Rd, St. Leonards, NSW 2065, Australia; e-mail: matthew.greenwood@health.nsw.gov.au.

