

Key Points
Megakaryocytes express collagen VI that regulates the release of functional platelets.
Collagen VI–null megakaryocytes and platelets display increased mTOR signaling and store-operated calcium entry.

Abstract
Hemostatic abnormalities and impaired platelet function have been described in patients affected by connective tissue disorders. We observed a moderate bleeding tendency in patients affected by collagen VI–related disorders and investigated the defects in platelet functionality, whose mechanisms are unknown. We demonstrated that megakaryocytes express collagen VI that is involved in the regulation of functional platelet production. By exploiting a collagen VI–null mouse model (Col6a1−/−), we found that collagen VI–null platelets display significantly increased susceptibility to activation and intracellular calcium signaling. Col6a1−/− megakaryocytes and platelets showed increased expression of stromal interaction molecule 1 (STIM1) and ORAI1, the components of store-operated calcium entry (SOCE), and activation of the mammalian target of rapamycin (mTOR) signaling pathway. In vivo mTOR inhibition by rapamycin reduced STIM1 and ORAI1 expression and calcium flows, resulting in a normalization of platelet susceptibility to activation. These defects were cell autonomous, because transplantation of lineage-negative bone marrow cells from Col6a1−/− mice into lethally irradiated wild-type animals showed the same alteration in SOCE and platelet activation seen in Col6a1−/− mice. Peripheral blood platelets of patients affected by collagen VI–related diseases, Bethlem myopathy and Ullrich congenital muscular dystrophy, displayed increased expression of STIM1 and ORAI1 and were more prone to activation. Altogether, these data demonstrate the importance of collagen VI in the production of functional platelets by megakaryocytes in mouse models and in collagen VI–related diseases.
Introduction
Collagen VI is an extracellular matrix protein that forms a distinct microfibrillar network and plays a remarkably broad range of key roles in different tissues. These include cytoprotection by counteracting apoptosis and oxidative damage, regulation of autophagy and cell differentiation, contribution to stem cell self-renewal and tissue regeneration, and promotion of tumor growth and progression.1 In humans, the major form of collagen VI is made up of 3 genetically distinct chains, α1(VI), α2(VI), and α3(VI), that are coded by the COL6A1, COL6A2, and COL6A3 genes, respectively.1 More recently, 3 additional genes (COL6A4, COL6A5, and COL6A6) were identified that code for other collagen VI chains that can substitute for α3(VI).2,3 Mutations in collagen VI genes in humans have been linked to a broad spectrum of muscular and neurological diseases, including Bethlem myopathy, Ullrich congenital muscular dystrophy (UCMD), congenital myosclerosis, and early-onset isolated dystonia.1,4 Different from other muscular dystrophies, collagen VI–related myopathies display remarkable alterations of the extracellular matrix of muscle and other connective tissues, including joints, tendons, and skin, and they can be considered hybrid disorders with clinical manifestations attributable to muscle and connective tissues.4
The crucial roles exerted by collagen VI in vivo have been unveiled mainly by exploiting the collagen VI–null (Col6a1−/−) mouse model, which was generated by targeted inactivation of the Col6a1 gene, resulting in the prevention of assembly and secretion of the entire collagen VI protein.5 Different studies, aimed at dissecting the pathomolecular defects underlying the myopathic phenotype of Col6a1−/− mice, revealed several alterations in the mitochondria and the sarcoplasmic reticulum, 2 organelles that are primarily involved in maintaining intracellular calcium (Ca2+) homeostasis.6,7 The pathomolecular alterations characterizing the muscles of Col6a1−/− mice have recently been found in other cells and tissues.1,8-10
Some studies and case reports have described hemostatic abnormalities and platelet function defects in patients affected by heritable connective tissue disorders, such as collagenopathies.11-13 When assessing the blood parameters of patients affected by Bethlem myopathy and UCMD, we observed a mild bleeding tendency, suggesting a defect in platelet functionality. These findings led us to broaden the exploration of the defects caused by collagen VI mutations in the circulatory system.
Intracellular Ca2+ signaling is a fundamental regulator of megakaryocyte (Mk) and platelet function through modulation of several intracellular pathways.14-18 Store-operated calcium entry (SOCE) is a well-described mechanism regulating Ca2+ entry from the extracellular space following endoplasmic reticulum (ER) store depletion.19 We and other investigators have previously described the expression and function of SOCE in Mks and platelets.16,20-22 Mks express the 2 molecular components of SOCE, the ER Ca2+ sensor stromal interaction molecule 1 (STIM1) and the plasma membrane Ca2+ channel ORAI1, which are activated upon depletion of the intracellular Ca2+ pool. Ca2+ mobilization from the intracellular stores promotes Mk function and proplatelet extension.16 In platelets, STIM1 and ORAI1 have been demonstrated to drive activation processes in response to agonists.15,23-25 The phosphatidylinositol 3-kinase (PI3K)/Akt/mammalian target of rapamycin (mTOR) axis is an intracellular signaling pathway enhanced by SOCE.26 In turn, mTOR regulates the expression of SOCE components.27,28 The PI3K/Akt/mTOR axis plays a pivotal role in regulating Mk and platelet function by controlling Mk proliferation and differentiation and platelet activation and aggregation, respectively.29-32 In addition to its role in Mk and platelet function, the PI3K/Akt/mTOR axis is known to be a crucial regulator of collagen I expression.33,34
Here, we exploited the collagen VI–null mouse model by generating Mk culture and radiation chimeras using bone marrow (BM) lineage-negative (Lin−) cell transplantations. We also investigated platelet function in Col6a1−/− mice and in samples from patients affected by collagen VI–related disorders.
Methods
Commercial antibodies used are listed in supplemental Table 1. Primers for human and mouse collagen VI are listed in supplemental Table 2.
Information about reagents, platelet preparation, platelet aggregation, reverse transcription polymerase chain reaction (RT-PCR), western blotting, intracellular Ca2+ measurements in platelets, tissue collection and immunofluorescence, and BM transplant are provided in supplemental materials.
Cell cultures
Human Mks were obtained by differentiating cord blood–derived CD34+ or peripheral blood–derived CD45+ hematopoietic progenitors, as described previously.35,36 Mouse Mks were obtained by differentiating BM cells for 4 days in Dulbecco’s modified Eagle medium (Gibco) supplemented with 1% penicillin/streptomycin, 1% l-glutamine, and 10% fetal bovine serum (Gibco), in the presence of 10 ng/mL recombinant murine thrombopoietin (PeproTech). On day 4, mature Mks were isolated by bovine serum albumin gradient sedimentation. For in vitro treatment with the prolyl-4 hydroxylase inhibitor ethyl 3,4-dihydroxybenzoate (EDHB), Mks were cultured for 24 hours with 100 μM EDHB or with vehicle alone (0.1% ethanol). For in vitro treatment with ascorbic acid, Mks were cultured in the presence of 50 μg/mL ascorbic acid for 48 hours. For in vitro treatment with rapamycin, BM cells were cultured at day 0 for 4 days in the presence of 100 nM rapamycin or 0.1% dimethyl sulfoxide (DMSO) as vehicle control.
Flow cytometry
Stim1 and ORAI1 staining.
To analyze STIM1 and ORAI1 in BM Mks, femurs were flushed, and red blood cells were lysed with 0.8% ammonium chloride solution. The remaining cells were washed by centrifugation with phosphate-buffered saline and stained with anti-ORAI1 antibody (1:100; Santa Cruz Biotechnologies) or anti-STIM1 antibody (1:100; Abcam). For STIM1 staining, cells were permeabilized with commercial buffers (BD Pharmingen) prior to staining with the antibody. To recognize BM Mks, we costained cells with an anti-CD41 antibody (0.1 mg/mL; BioLegend). All Mk samples were characterized as CD41/CD42b-positive and CD3/CD4/CD8/CD11b/CD19/CD33-negative cells, using appropriate antibodies (0.1 mg/mL; all from Beckman Coulter). Samples were acquired with a FACSDiva flow cytometer (Beckman Coulter). The analytical gating was set using unstained samples and relative isotype controls. Offline data were analyzed using the Beckman Coulter Kaluza software package (Beckman Coulter) and Flowing software 2.5.1 (University of Turku).
BM Mk sorting.
Mks were sorted from BM cells as the CD11b−/CD61+/CD9+ population.37 The gating strategy is shown in supplemental Figure 9. Mk purity after sorting, by means of CD61+/CD9+/CD41+, was routinely performed and assessed to be >95%. Cell viability was checked using Trypan Blue solution (Sigma Aldrich). Cell sorting experiments were performed using a FACSAria IIu (3 lasers; BD Bioscience). FACSDiva software (BD Pharmingen) was used for data acquisition and analysis.
Platelet activation.
For platelet activation, 2 × 10⁶ platelets washed in modified Tyrode’s buffer (134 mM NaCl, 0.34 mM Na2HPO4, 2.9 mM KCl, 12 mM NaHCO3, 20 mM HEPES, 5 mM glucose) containing 1 mM CaCl2 were incubated with 0.1 U/mL thrombin (Sigma-Aldrich), 25 μM adenosine diphosphate (ADP; Sigma-Aldrich), 20 ng/mL convulxin (Enzo Life Sciences), or vehicle alone in the presence of 2 μg/mL JON/A-PE (Emfret Analytics), 12 μg/mL PAC-1–FITC (BD Biosciences), or 10 μg/mL anti-CD62P–APC (BioLegend) and analyzed 10 minutes later.38 Platelet activation was expressed as the ratio between the mean fluorescence intensity measured after the stimulation with each agonist and the mean fluorescence intensity measured after incubation with vehicle alone.39
Intracellular Ca2+ measurements in Mks
To study SOCE, Mks were treated with 10 mM cyclopiazonic acid (CPA) in Ca2+-free (Ca2+ 0) solution to deplete the stores. Similar to thapsigargin treatment, CPA treatment causes a transient increase in the intracellular Ca2+ concentration [Ca2+]i due to the passive emptying of Ca2+ stores. After Ca2+ levels return to baseline, external Ca2+ is restored to 1.5 mM, causing a second increase in intracellular Ca2+ levels due to activated SOCE. As an internal control, Mks were treated with vehicle alone (0.03% volume-to-volume ratio of DMSO), which did not elicit any significant increase in [Ca2+]i (supplemental Figure 10). Intracellular Ca2+ measurements in Mks were performed as previously described.16,40 For a detailed description, please refer to supplemental Methods.
Mice and in vivo treatments
We performed experiments in wild-type (WT) mice of the inbred C57BL/6NCrl strain and in Col6a1−/− mice that we previously backcrossed on the C57BL/6NCrl strain for 8 generations, as previously described.7 We obtained data for 3-month-old mice by comparing sex-matched WT and Col6a1−/− animals. Mouse procedures were approved by the Italian Ministry of Health (approvals #282-2017 and #877-2018). For in vivo treatment with rapamycin, mice were injected intraperitoneally with rapamycin (2 mg/kg body weight) every 24 hours for 14 days, as previously described.41 Control mice were injected intraperitoneally with vehicle alone (5% PEG-400/5% Tween-80 in saline).
Patient samples
All relevant data concerning symptoms at disease onset, clinical features at last clinical evaluation, disease progression, and genetic analysis are reported in Table 1.
Summary of the clinical features, genetic characterization, and International Society on Thrombosis and Hemostasis-Bleeding Assessment Tool for patients with Bethlem myopathy or UCMD included in this study
| Patient 1/F | Patient 2/M | Patient 3/M | Patient 4/F | Patient 5/F | |
|---|---|---|---|---|---|
| Clinical phenotype | BetMy AD | UCMD intermediate | BetMy | BetMy AD | BetMy AD |
| Onset | |||||
| Age | Adolescence | Neonatal | Neonatal | Adolescence | Childhood |
| Symptoms | Difficulties in sport | Hypotonia, respiratory distress | Hypotonia, finger contractures | Shoulder and knee dislocation | Slower than peers |
| Last evaluation | |||||
| Age | 20 | 20 | 18 | 47 | 54 |
| Best motor function | Run | WCB (8 y) | Run | Walk | Walk |
| COL6A mutations | COL6A3: c.5035G>T; p.Gly1679Trp | COL6A1: c.930 + 189C>T, intron 11 | COL6A3: c.4859C>T, p.Pro1620Leu (pseudohomozygosity) | COL6A3: c.5035G>T; p.Gly1679Trp | COL6A3: c.5035G>T; p.Gly1679Trp |
| Platelet count (×109/L)* | 251 | 269 | 212 | 267 | 237 |
| Bleeding phenotype | Menorrhagia, mild trauma-related bruises | Not applicable | Not applicable | Menorrhagia, mild trauma-related bruises, mild oral cavity bleeding, postpartum hemorrhage | Menorrhagia, mild trauma-related bruises, mild oral cavity bleeding |
| ISTH-BAT43 | 2 | 0 | 0 | 4 | 7 |
AD, autosomal dominant; BetMy, Bethlem myopathy; ISTH-BAT, International Society on Thrombosis and Hemostasis-Bleeding Assessment Tool; WCB, wheelchair bound.
Normal value: 200 to 450 ×109/L.
Two males (M) and 3 females (F) belonging to 3 families were studied. Four patients were affected by Bethlem myopathy and 1 had UCMD intermediate [the phenotype was defined upon loss of ambulation by 20 years and start of noninvasive ventilation by 20 years (patient 2/M)].42 Laboratory tests revealed a normal platelet count in all patients (Table 1). Hemoglobin, hematocrit, and white blood cells were also normal. A structured interview was conducted with all patients using the International Society on Thrombosis and Hemostasis - Bleeding Assessment Tool (Table 1)43 . Three members of the same kindred (patients 1/F, 4/F, and 5/F) presented with menorrhagia and mild trauma-related bruises, 2 patients (4/F and 5/F) presented with mild oral cavity bleeding, and 1 patient (4/F) also presented with postpartum hemorrhage. According to the cutoff values set by the International Society on Thrombosis and Hemostasis (≥4 in adult males, ≥6 in adult females),44 only patient 5/F showed an increased risk for bleeding. No arterial or venous thrombosis was observed in our cohort of patients.
Study approval
Human cord blood samples were processed following guidelines of the Ethics Committee of the Istituto di Ricovero e Cura a Carattere Scientifico (IRCCS), Policlinico San Matteo foundation of Pavia and the principles of the Declaration of Helsinki. Five subjects were selected from a cohort of patients with Bethlem myopathy or UCMD who were followed at the Neuromuscular Center of the University of Padova. The study was conducted in accordance with the ethics rules and guidelines issued by the local Ethics Committee and the Declaration of Helsinki. Every patient provided written informed consent. Mouse procedures were approved by the Italian Ministry of Health (approvals #282-2017 and #877-2018).
Statistics
Data are expressed as mean ± standard deviation (SD) or standard error of the mean (SEM). A 2-tailed Student t test was used for comparisons between 2 groups. For comparisons of 1 factor across multiple groups, 1-way ANOVA was performed followed by the post hoc Tukey test. GraphPad Prism 8 (GraphPad Software) was used for statistical analyses and graphing. P values < .05 were considered statistically significant. All experiments were independently replicated ≥3 times.
Results
Human and mouse Mks express collagen VI
To investigate collagen VI expression, human Mks were differentiated from cord blood, whereas mouse Mks were derived from BM progenitors. As shown in Figure 1, Mks of human and murine origin expressed the 3 major collagen VI chains (α1, α2, α3) at RNA (Figure 1A) and protein (Figure 1B) levels. To confirm the specificity of the protein bands, Mks were treated for 24 hours with the prolyl-4 hydroxylase inhibitor EDHB.45 This treatment reduced the synthesis of collagen VI chains in human and murine Mk cultures with respect to treatment with vehicle alone (Figure 1B). Mature murine Mks cultured in the presence of ascorbic acid were able to secrete collagen VI, which localized around the cell membrane and was also detectable in the culture medium by immunoblotting (Figure 1C-D).
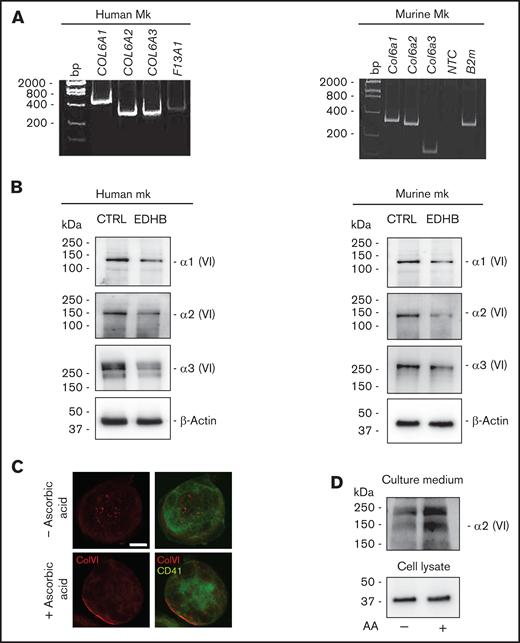
Human and murine Mks express collagen VI. (A) RT-PCR of COL6A1, COL6A2, and COL6A3 messenger RNAs in human (left panel) and murine (right panel) Mks. Factor XIII (F13A1) and β2-microglobulin (B2m) were used as positive controls. The migration of the DNA size marker (bp) is shown. (B) Western blot for α1, α2, and α3 chains of collagen VI in human (left panel) and murine (right panel) Mks. Membranes were probed with monoclonal antibodies raised against each single chain. β-Actin was used as a loading control. Where indicated, Mks were treated with 100 μM the prolyl-4-hydroxylase inhibitor EDHB. In parallel, Mks were treated with vehicle alone (0.1% ethanol) as control. (C) Confocal microscopy immunofluorescence of WT mouse Mks stained with a polyclonal antibody against collagen VI (red) and a monoclonal antibody against CD41 (green). Where indicated, Mks were cultured in the presence of 50 μg/mL ascorbic acid for 48 hours. Scale bar, 10 μm. (D) Western blot analysis of collagen VI secretion in the culture medium by Mks. Differentiated WT Mks were cultured for 48 hours in the absence or presence of 50 μg/mL ascorbic acid (AA). Then, the culture medium was collected, centrifuged, and resolved using sodium dodecyl sulfate polyacrylamide gel electrophoresis under reducing and denaturing conditions. Membranes were probed with a monoclonal antibody recognizing collagen VI α2 chain. CTRL, control; NTC, no template control; VI, collagen VI.
Human and murine Mks express collagen VI. (A) RT-PCR of COL6A1, COL6A2, and COL6A3 messenger RNAs in human (left panel) and murine (right panel) Mks. Factor XIII (F13A1) and β2-microglobulin (B2m) were used as positive controls. The migration of the DNA size marker (bp) is shown. (B) Western blot for α1, α2, and α3 chains of collagen VI in human (left panel) and murine (right panel) Mks. Membranes were probed with monoclonal antibodies raised against each single chain. β-Actin was used as a loading control. Where indicated, Mks were treated with 100 μM the prolyl-4-hydroxylase inhibitor EDHB. In parallel, Mks were treated with vehicle alone (0.1% ethanol) as control. (C) Confocal microscopy immunofluorescence of WT mouse Mks stained with a polyclonal antibody against collagen VI (red) and a monoclonal antibody against CD41 (green). Where indicated, Mks were cultured in the presence of 50 μg/mL ascorbic acid for 48 hours. Scale bar, 10 μm. (D) Western blot analysis of collagen VI secretion in the culture medium by Mks. Differentiated WT Mks were cultured for 48 hours in the absence or presence of 50 μg/mL ascorbic acid (AA). Then, the culture medium was collected, centrifuged, and resolved using sodium dodecyl sulfate polyacrylamide gel electrophoresis under reducing and denaturing conditions. Membranes were probed with a monoclonal antibody recognizing collagen VI α2 chain. CTRL, control; NTC, no template control; VI, collagen VI.
Platelets from collagen VI–null mice are more susceptible to activation
We studied the ex vivo functionality of platelets from WT and Col6a1−/− mice. The absence of the collagen VI α1 chain in Col6a1−/− Mks was confirmed by western blot analysis (supplemental Figure 1). Collagen VI–null platelets showed an increased tendency toward activation and aggregation. Platelets from Col6a1−/− mice exhibited increased levels of activated integrin αIIbβ3 and CD62P (P-selectin) exposure on the cell membrane after stimulation with thrombin, ADP, or the GPVI collagen receptor agonist convulxin (CVX) (Figure 2A). On the other hand, the expression levels of integrin αIIbβ3, PAR-4, P2Y12, and GPVI were not different between WT and Col6a1−/− platelets (supplemental Figure 2). Col6a1−/− platelets displayed more avidity for adhesion to collagen I and fibrinogen than did WT platelets (supplemental Figure 3). In vitro Col6a1−/− platelet stimulation with the platelet agonists collagen, thrombin, or ADP plus adrenaline led to a robust amplification of the aggregation, thus confirming their hyperreactive behavior (Figure 2B).
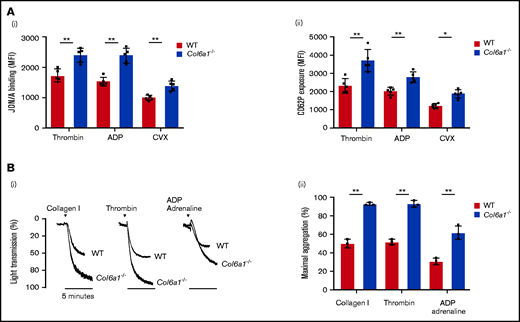
Col6a1−/− platelets display an increased tendency toward activation and aggregation. (A) Platelet activation response in platelets from WT and Col6a1−/− mice, measured 10 minutes after stimulation with 0.1 U/mL thrombin, 25 μM ADP, or 20 ng/mL CVX. Platelet activation was detected by the binding of the JON/A antibody against activated integrin αIIbβ3 (Ai) and the binding of the anti-CD62P antibody (Aii). Data are mean ± SD (n = 5). Student t test. (Bi) Representative aggregation response of washed platelets (1.7 × 10⁵/μL) prepared from WT and Col6a1−/− mice. Platelets were stimulated with different agonists (collagen I 5 μg/mL, thrombin 0.5 U/mL, and ADP plus adrenaline 20 μM each, in the presence of 1 mM CaCl2. Platelet aggregation was measured as a change in light transmission using a lumi-aggregometer. (Bii) Quantification of the percentage of maximal platelet aggregation. Data are mean ± SD (n = 3). Student t test. *P < .05, **P < .01. MFI, mean fluorescence intensity.
Col6a1−/− platelets display an increased tendency toward activation and aggregation. (A) Platelet activation response in platelets from WT and Col6a1−/− mice, measured 10 minutes after stimulation with 0.1 U/mL thrombin, 25 μM ADP, or 20 ng/mL CVX. Platelet activation was detected by the binding of the JON/A antibody against activated integrin αIIbβ3 (Ai) and the binding of the anti-CD62P antibody (Aii). Data are mean ± SD (n = 5). Student t test. (Bi) Representative aggregation response of washed platelets (1.7 × 10⁵/μL) prepared from WT and Col6a1−/− mice. Platelets were stimulated with different agonists (collagen I 5 μg/mL, thrombin 0.5 U/mL, and ADP plus adrenaline 20 μM each, in the presence of 1 mM CaCl2. Platelet aggregation was measured as a change in light transmission using a lumi-aggregometer. (Bii) Quantification of the percentage of maximal platelet aggregation. Data are mean ± SD (n = 3). Student t test. *P < .05, **P < .01. MFI, mean fluorescence intensity.
Collagen VI–null platelets and Mks have increased levels of SOCE effectors
Platelet activation is directly dependent on the increase in [Ca2+]i due to SOCE activation.21 To assess whether the alterations observed in Col6a1−/− platelets may depend on changes in the molecular components of SOCE, we analyzed the expression of STIM1, the ER Ca2+ sensor, and ORAI1, a plasma membrane Ca2+ channel, which detect any significant decrease in ER Ca2+ levels and mediate the ensuing extracellular Ca2+ entry, respectively.19 The protein levels of both SOCE effectors were significantly increased in circulating platelets from Col6a1−/− mice compared with WT mice (Figure 3A). We exposed cells to thapsigargin to evaluate the impact of increased STIM1 and ORAI1 expression on SOCE function.46 Thapsigargin blocks the activity of Sarco/Endoplasmic Reticulum Ca2+ ATPase (SERCA), thereby preventing Ca2+ sequestration into the stores and leading to their depletion, with consequent SOCE activation.47 In Ca2+0 conditions, the Ca2+ mobilization from intracellular stores induced by thapsigargin treatment was similar between WT and Col6a1−/− platelets. The addition of extracellular Ca2+ in the presence of thapsigargin resulted in a massive Ca2+ entry from the extracellular space, which was significantly higher in Col6a1−/− platelets (Figure 3B). To evaluate whether these alterations were inherited from Mks or acquired by platelets, we sorted BM Mks and analyzed the expression of STIM1 and ORAI1 transcripts. We found that the levels of both messenger RNAs (mRNAs) were significantly increased in BM Mks from Col6a1−/− mice compared with WT mice (Figure 3Ci). These data were further supported by the analysis of STIM1 and ORAI1 protein levels in BM Mks by flow cytometry (Figure 3Cii). The increase in STIM1 and ORAI1 expression in Col6a1−/− Mks resulted in an elevation in SOCE-dependent Ca2+ signaling. In the absence of extracellular Ca2+, treatment of Mks with CPA, an inhibitor of SERCA that is structurally unrelated to thapsigargin, induced mobilization of Ca2+ from the intracellular stores that was comparable between WT and Col6a1−/− Mks. Conversely, the addition of extracellular Ca2+ in the presence of CPA elicited a significant increase in Ca2+ entry from the extracellular space in Col6a1−/− Mks (Figure 3D), thus confirming the increase in SOCE.
![Col6a1−/− platelets and Mks have increased STIM1 and ORAI1 expression and increased SOCE. (Ai) Western blot for STIM1 and ORAI1 in WT and Col6a1−/− platelets. β-Actin was used as a loading control. (Aii) Band densities were quantified and expressed relative to WT. Data are mean ± SD (n = 6). Student t test. (Bi) Representative FLUO3 fluorescence–based [Ca2+]i traces of WT (red line) and Col6a1−/− (blue line) platelets incubated in Ca2+0 conditions. Where indicated, successive additions of 5 µM thapsigargin (TG) and 1 mM Ca2+ were carried out. (Bii) Quantification of basal and peak [Ca2+]i following the addition of thapsigargin (ER release) and Ca2+ (SOCE) in WT and Col6a1−/− platelets. Data are mean ± SEM (n = 5). Student t test. (Ci) Quantitative RT-PCR analysis of STIM1 and ORAI1 mRNA expression in sorted BM Mks from WT and Col6a1−/− mice. Data are mean ± SD (n = 3). Student t test. (Cii) Flow cytometry analysis of STIM1 and ORAI1 protein levels in BM Mks from WT and Col6a1−/− mice. Data are mean ± SD (n = 4). Student t test. (Di) Representative Fura-2 fluorescence ratios reflecting [Ca2+]i in WT and Col6a1−/− differentiated Mks. [Ca2+]i variations were monitored in the presence of 10 μM CPA in Ca2+0 and after addition of 1.5 mM extracellular Ca2+. (Dii) Analysis of Ca2+ flows (ER release and SOCE) in WT and Col6a1−/− Mks. Data are mean ± SEM (n = 4). Student t test. *P < .05, **P < .01.](https://ash.silverchair-cdn.com/ash/content_public/journal/bloodadvances/5/23/10.1182_bloodadvances.2020002671/3/m_advancesadv2020002671f3.png?Expires=1769101357&Signature=NyuJm9LByxDPAReRqUXEX-gEpakULxGZtvd5jLYnq~25Ua~IrczuLiKTkF~dnG8uSwvrjRvHDxWT6Uea9Xf1R~YpbgWfZpvgUC~KLwHqpluE7ga45g9k-K0XhQilYjGXKKAmF1R-mYSQqGCCeF8vOjE5ckYPHzUc2oaKGaMaUs8q6MrKr1k~FOnZHBZTg4IVupWwFADM-27hwvrk0zzAs48I1bv1ve91VbZWDNQuJhkpJmf4Jt1K-IRWogleTgKBmeyqDjbD4LsR017mkhjIZvsBxRGkzBd2-AQ3F5jltppVqPYOLHEk5MbyEM9OpOzScIa3uaPNWYjromkYQ-KyzQ__&Key-Pair-Id=APKAIE5G5CRDK6RD3PGA)
Col6a1−/− platelets and Mks have increased STIM1 and ORAI1 expression and increased SOCE. (Ai) Western blot for STIM1 and ORAI1 in WT and Col6a1−/− platelets. β-Actin was used as a loading control. (Aii) Band densities were quantified and expressed relative to WT. Data are mean ± SD (n = 6). Student t test. (Bi) Representative FLUO3 fluorescence–based [Ca2+]i traces of WT (red line) and Col6a1−/− (blue line) platelets incubated in Ca2+0 conditions. Where indicated, successive additions of 5 µM thapsigargin (TG) and 1 mM Ca2+ were carried out. (Bii) Quantification of basal and peak [Ca2+]i following the addition of thapsigargin (ER release) and Ca2+ (SOCE) in WT and Col6a1−/− platelets. Data are mean ± SEM (n = 5). Student t test. (Ci) Quantitative RT-PCR analysis of STIM1 and ORAI1 mRNA expression in sorted BM Mks from WT and Col6a1−/− mice. Data are mean ± SD (n = 3). Student t test. (Cii) Flow cytometry analysis of STIM1 and ORAI1 protein levels in BM Mks from WT and Col6a1−/− mice. Data are mean ± SD (n = 4). Student t test. (Di) Representative Fura-2 fluorescence ratios reflecting [Ca2+]i in WT and Col6a1−/− differentiated Mks. [Ca2+]i variations were monitored in the presence of 10 μM CPA in Ca2+0 and after addition of 1.5 mM extracellular Ca2+. (Dii) Analysis of Ca2+ flows (ER release and SOCE) in WT and Col6a1−/− Mks. Data are mean ± SEM (n = 4). Student t test. *P < .05, **P < .01.
Col6a1−/− platelets and Mks have increased STIM1 and ORAI1 expression and increased SOCE. (Ai) Western blot for STIM1 and ORAI1 in WT and Col6a1−/− platelets. β-Actin was used as a loading control. (Aii) Band densities were quantified and expressed relative to WT. Data are mean ± SD (n = 6). Student t test. (Bi) Representative FLUO3 fluorescence–based [Ca2+]i traces of WT (red line) and Col6a1−/− (blue line) platelets incubated in Ca2+0 conditions. Where indicated, successive additions of 5 µM thapsigargin (TG) and 1 mM Ca2+ were carried out. (Bii) Quantification of basal and peak [Ca2+]i following the addition of thapsigargin (ER release) and Ca2+ (SOCE) in WT and Col6a1−/− platelets. Data are mean ± SEM (n = 5). Student t test. (Ci) Quantitative RT-PCR analysis of STIM1 and ORAI1 mRNA expression in sorted BM Mks from WT and Col6a1−/− mice. Data are mean ± SD (n = 3). Student t test. (Cii) Flow cytometry analysis of STIM1 and ORAI1 protein levels in BM Mks from WT and Col6a1−/− mice. Data are mean ± SD (n = 4). Student t test. (Di) Representative Fura-2 fluorescence ratios reflecting [Ca2+]i in WT and Col6a1−/− differentiated Mks. [Ca2+]i variations were monitored in the presence of 10 μM CPA in Ca2+0 and after addition of 1.5 mM extracellular Ca2+. (Dii) Analysis of Ca2+ flows (ER release and SOCE) in WT and Col6a1−/− Mks. Data are mean ± SEM (n = 4). Student t test. *P < .05, **P < .01.
Altered mTORC1 signaling in collagen VI–null Mks and platelets
It was demonstrated previously that the mTOR signaling axis regulates Mk growth and platelet activation,29-31 as well as STIM1 and ORAI1 expression.27,28 Based on this information, we investigated the activation of Akt and the downstream effectors of the mTORC1 signaling complex, S6 and 4E-BP1, in mouse BM Mks and circulating platelets. All of these proteins were significantly more phosphorylated in BM Mks (Figure 4A; supplemental Figure 4) and resting platelets (Figure 4B) derived from Col6a1−/− mice compared with WT mice.
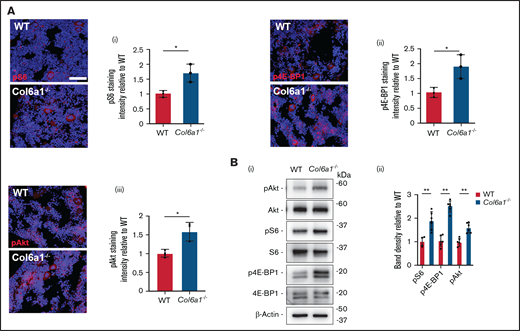
Col6a1−/− Mks and platelets display increased mTORC1 signaling. (A) In situ staining of phosphorylated (p)S6 protein (i), p4E-BP1 protein (ii), and pAkt (iii) in WT and Col6a1−/− CD41+ BM Mks. Staining intensities were quantified and expressed relative to WT. A minimum of 40 Mks were analyzed per section. Data are mean ± SD (n = 3). Student t test. (Bi) Western blot of pAkt, pS6, and p4E-BP1 in WT and Col6a1−/− platelets. Total Akt, total S6, total 4E-BP1, and β-actin were used as loading controls. (Bii) Band densities were quantified and expressed relative to WT. Data are mean ± SD (n = 6). Student t test. *P < .05; ** P < .01.
Col6a1−/− Mks and platelets display increased mTORC1 signaling. (A) In situ staining of phosphorylated (p)S6 protein (i), p4E-BP1 protein (ii), and pAkt (iii) in WT and Col6a1−/− CD41+ BM Mks. Staining intensities were quantified and expressed relative to WT. A minimum of 40 Mks were analyzed per section. Data are mean ± SD (n = 3). Student t test. (Bi) Western blot of pAkt, pS6, and p4E-BP1 in WT and Col6a1−/− platelets. Total Akt, total S6, total 4E-BP1, and β-actin were used as loading controls. (Bii) Band densities were quantified and expressed relative to WT. Data are mean ± SD (n = 6). Student t test. *P < .05; ** P < .01.
Collagen VI–null Mks and platelets maintain SOCE alterations after BM transplantation in WT recipient mice
We investigated whether the alterations in SOCE expression and function in Col6a1−/− Mks and platelets were due to the lack of collagen VI in the BM environment or to the intrinsic absence of self-produced collagen VI in Mks. Lin− BM cells isolated from WT and Col6a1−/− donor mice were transplanted into lethally irradiated WT recipient mice. All mice except 1 survived the transplant and recovered their body weight with no signs of clinical suffering. All analyzed mice restored their white blood cell count, indicating a full engraftment of transplanted cells. Mks were then sorted from BM and analyzed. Col6a1−/− Mks maintained increased expression of STIM1 and ORAI1, as demonstrated by quantitative RT-PCR (qRT-PCR) and flow cytometry (Figure 5A). These alterations were transferred to platelets, as indicated by western blot for STIM1 and ORAI1 (Figure 5B). Also, platelets isolated from WT mice that were transplanted with Col6a1−/− Lin− BM cells showed increased levels of phosphorylated (p)S6 and p4E-BP1 (supplemental Figure 5). Platelets produced by Col6a1−/− Mks in a WT BM environment maintained the increased susceptibility to activation, relative to WT platelets, as demonstrated by αIIbβ3 activation and CD62P (P-selectin) exposure on the cell membrane after stimulation with major agonists (thrombin, ADP, and CVX) (Figure 5C).
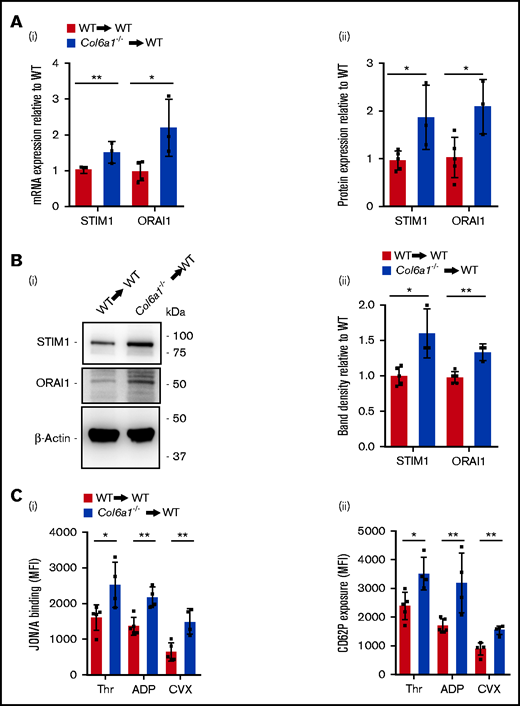
Col6a1−/− Mks and platelets maintain SOCE alterations after BM transplantation in a WT background. (Ai) qRT-PCR analysis of STIM1 and ORAI1 mRNA expression in sorted BM Mks from WT recipient mice after BM transplantation with WT (WT→WT) or Col6a1−/− (Col6a1−/−→WT) Lin− BM cells. Data are mean ± SD (WT→WT, n = 5; Col6a1−/→WT, n = 3). Student t test. (Aii) Flow cytometry analysis of STIM1 and ORAI1 protein levels in BM Mks from WT recipient mice after BM transplantation, as in (i). Data are mean ± SD (WT→WT, n = 5; Col6a1−/−→WT, n = 3). Student t test. (Bi) Western blot for STIM1 and ORAI1 in platelets isolated from WT recipient mice after BM transplantation with WT or Col6a1−/− Lin− BM cells, as in (A). β-Actin was used as a loading control. (Bii) Band densities were quantified and expressed relative to WT→WT. Data are mean ± SD (WT→WT, n = 5; Col6a1−/−→WT, n = 3). Student t test. (C) Platelet activation measured as integrin αIIbβ3 activation (i) and CD62P cell surface exposure (ii) after stimulation with 0.1 U/mL thrombin (Thr), 25 μM ADP, or 20 ng/mL CVX in platelets isolated from WT recipient mice after transplantation with WT or Col6a1−/− Lin− BM cells. Data are mean ± SD (WT→WT, n = 5; Col6a1−/−→WT, n = 4). Student t test. *P < .05, **P < .01. MFI, mean fluorescence intensity.
Col6a1−/− Mks and platelets maintain SOCE alterations after BM transplantation in a WT background. (Ai) qRT-PCR analysis of STIM1 and ORAI1 mRNA expression in sorted BM Mks from WT recipient mice after BM transplantation with WT (WT→WT) or Col6a1−/− (Col6a1−/−→WT) Lin− BM cells. Data are mean ± SD (WT→WT, n = 5; Col6a1−/→WT, n = 3). Student t test. (Aii) Flow cytometry analysis of STIM1 and ORAI1 protein levels in BM Mks from WT recipient mice after BM transplantation, as in (i). Data are mean ± SD (WT→WT, n = 5; Col6a1−/−→WT, n = 3). Student t test. (Bi) Western blot for STIM1 and ORAI1 in platelets isolated from WT recipient mice after BM transplantation with WT or Col6a1−/− Lin− BM cells, as in (A). β-Actin was used as a loading control. (Bii) Band densities were quantified and expressed relative to WT→WT. Data are mean ± SD (WT→WT, n = 5; Col6a1−/−→WT, n = 3). Student t test. (C) Platelet activation measured as integrin αIIbβ3 activation (i) and CD62P cell surface exposure (ii) after stimulation with 0.1 U/mL thrombin (Thr), 25 μM ADP, or 20 ng/mL CVX in platelets isolated from WT recipient mice after transplantation with WT or Col6a1−/− Lin− BM cells. Data are mean ± SD (WT→WT, n = 5; Col6a1−/−→WT, n = 4). Student t test. *P < .05, **P < .01. MFI, mean fluorescence intensity.
Rapamycin treatment normalizes STIM1 and ORAI1 expression and SOCE
To test whether the increased expression of SOCE effectors was directly dependent on mTORC1 signaling, we cultured flushed BM cells from WT and Col6a1−/− mice in the presence of thrombopoietin to induce Mk differentiation and treated them with the mTOR inhibitor rapamycin or with vehicle alone. Mks were purified by gradient sedimentation and lysed. Western blot analysis confirmed higher protein levels of STIM1 and ORAI1 in Col6a1−/− Mks (Figure 6A). Rapamycin treatment induced a significant reduction in STIM1 and ORAI1 levels (Figure 6A), with a consequent reduction in CPA-induced SOCE activation (Figure 6B) that was similar in WT and Col6a1−/− Mks following rapamycin treatment. mTOR signaling was assessed in vivo by injecting mice with rapamycin or vehicle. In vivo, rapamycin treatment resulted in a significant reduction in pS6 and p4E-BP1 in Col6a1−/− platelets to a level comparable to WT platelets under resting conditions and after stimulation with thrombin (supplemental Figure 6). In vivo, rapamycin administration also resulted in a normalization of STIM1 and ORAI1 protein expression in Col6a1−/− BM Mks (Figure 6C; supplemental Figure 7) and platelets (Figure 6D). The reduction in the expression of SOCE effectors resulted in a significant decrease in platelet activation upon thrombin stimulation, detected by active integrin αIIbβ3, to a level comparable to WT platelets (Figure 6E). Rapamycin treatment also normalized the peripheral blood platelet count of Col6a1−/− mice, which showed a mild thrombocytopenia (Figure 6F).
![In vitro and in vivo rapamycin treatment normalizes STIM1 and ORAI1 expression and SOCE in Col6a1−/− Mks. (Ai) Western blot for STIM1 and ORAI1 in WT and Col6a1−/− differentiated Mks, in the presence of 100 nM rapamycin (Rapa) or vehicle alone as control (0.1% DMSO). β-Actin was used as a loading control. (Aii) Band densities were quantified and expressed relative to control. Data are mean ± SD (n = 5). 1-way ANOVA. (Bi) Representative Fura-2 fluorescence ratios reflecting [Ca2+]i variations in WT and Col6a1−/− differentiated Mks, in the presence of 100 nM Rapa or vehicle alone. Ca2+ flows were monitored in the presence of 10 μM CPA in Ca2+0 conditions and after the addition of 1.5 mM extracellular Ca2+. (Bii) Analysis of Ca2+ flows (ER release and SOCE) in WT and Col6a1−/− Mks. A minimum of 40 Mks were analyzed per experiment. Data are mean ± SEM (n = 4). 1-way ANOVA. (C) Flow cytometry analysis of STIM1 and ORAI1 protein expression in BM Mks from WT and Col6a1−/− mice treated with Rapa (2 mg/kg body weight) or vehicle as control (5% PEG-400/5% Tween-80 in saline). Data are mean ± SD (n = 5). 1-way ANOVA. (Di) Western blot for STIM1 and ORAI1 in platelets from WT and Col6a1−/− mice treated with Rapa or vehicle as control. (Dii) Band densities were quantified and expressed relative to control. Data are mean ± SD (n = 5). 1-way ANOVA. (E) Flow cytometry analysis of integrin αIIbβ3 activation (JON/A antibody binding) in WT and Col6a1−/− platelets, after stimulation with thrombin (0.1 U/mL), from mice treated with Rapa or vehicle as control. Data are mean ± SD (n = 5). 1-way ANOVA. (F) Peripheral blood platelet (Plt) count in WT and Col6a1−/− mice following administration of Rapa or vehicle as control (n = 3). Data are mean ± SD (n = 3). 1-way ANOVA. *P < .05, **P < .01. CTRL, control; MFI, mean fluorescence intensity.](https://ash.silverchair-cdn.com/ash/content_public/journal/bloodadvances/5/23/10.1182_bloodadvances.2020002671/3/m_advancesadv2020002671f6.png?Expires=1769101357&Signature=P6DfcT6tNxidCiBSY1d2n2Lmb9wUjIjfcGm4j57R5n08Gat7AFhhbvcPMgGCT1AW1MyZE6xtaVKlZyEiRr2BG69qWC-HFDonc2fyCsOSwou0ROPPg0RHfGG5UghIRn2DVDbw~QZ8FqNXV-~nD65gMhnHQXJZ7VdbbQW4JQzrLQcR9LnyDkdBKaXXtvVvtKJgRe48FkqNOWRY8D3fmPp4MlKLwbnN0I3fMsdKvIUOQW0lmrgEJTJa3t2cWEz4nyoG7QweetTjA5P6gi7DKSMfUvb9g34ZT2bxulJ04Yo~xBCmweaGLEV4zLoABJkW7gr3iJg5u6zmIc2vlJg5Ww0RMw__&Key-Pair-Id=APKAIE5G5CRDK6RD3PGA)
In vitro and in vivo rapamycin treatment normalizes STIM1 and ORAI1 expression and SOCE in Col6a1−/− Mks. (Ai) Western blot for STIM1 and ORAI1 in WT and Col6a1−/− differentiated Mks, in the presence of 100 nM rapamycin (Rapa) or vehicle alone as control (0.1% DMSO). β-Actin was used as a loading control. (Aii) Band densities were quantified and expressed relative to control. Data are mean ± SD (n = 5). 1-way ANOVA. (Bi) Representative Fura-2 fluorescence ratios reflecting [Ca2+]i variations in WT and Col6a1−/− differentiated Mks, in the presence of 100 nM Rapa or vehicle alone. Ca2+ flows were monitored in the presence of 10 μM CPA in Ca2+0 conditions and after the addition of 1.5 mM extracellular Ca2+. (Bii) Analysis of Ca2+ flows (ER release and SOCE) in WT and Col6a1−/− Mks. A minimum of 40 Mks were analyzed per experiment. Data are mean ± SEM (n = 4). 1-way ANOVA. (C) Flow cytometry analysis of STIM1 and ORAI1 protein expression in BM Mks from WT and Col6a1−/− mice treated with Rapa (2 mg/kg body weight) or vehicle as control (5% PEG-400/5% Tween-80 in saline). Data are mean ± SD (n = 5). 1-way ANOVA. (Di) Western blot for STIM1 and ORAI1 in platelets from WT and Col6a1−/− mice treated with Rapa or vehicle as control. (Dii) Band densities were quantified and expressed relative to control. Data are mean ± SD (n = 5). 1-way ANOVA. (E) Flow cytometry analysis of integrin αIIbβ3 activation (JON/A antibody binding) in WT and Col6a1−/− platelets, after stimulation with thrombin (0.1 U/mL), from mice treated with Rapa or vehicle as control. Data are mean ± SD (n = 5). 1-way ANOVA. (F) Peripheral blood platelet (Plt) count in WT and Col6a1−/− mice following administration of Rapa or vehicle as control (n = 3). Data are mean ± SD (n = 3). 1-way ANOVA. *P < .05, **P < .01. CTRL, control; MFI, mean fluorescence intensity.
In vitro and in vivo rapamycin treatment normalizes STIM1 and ORAI1 expression and SOCE in Col6a1−/− Mks. (Ai) Western blot for STIM1 and ORAI1 in WT and Col6a1−/− differentiated Mks, in the presence of 100 nM rapamycin (Rapa) or vehicle alone as control (0.1% DMSO). β-Actin was used as a loading control. (Aii) Band densities were quantified and expressed relative to control. Data are mean ± SD (n = 5). 1-way ANOVA. (Bi) Representative Fura-2 fluorescence ratios reflecting [Ca2+]i variations in WT and Col6a1−/− differentiated Mks, in the presence of 100 nM Rapa or vehicle alone. Ca2+ flows were monitored in the presence of 10 μM CPA in Ca2+0 conditions and after the addition of 1.5 mM extracellular Ca2+. (Bii) Analysis of Ca2+ flows (ER release and SOCE) in WT and Col6a1−/− Mks. A minimum of 40 Mks were analyzed per experiment. Data are mean ± SEM (n = 4). 1-way ANOVA. (C) Flow cytometry analysis of STIM1 and ORAI1 protein expression in BM Mks from WT and Col6a1−/− mice treated with Rapa (2 mg/kg body weight) or vehicle as control (5% PEG-400/5% Tween-80 in saline). Data are mean ± SD (n = 5). 1-way ANOVA. (Di) Western blot for STIM1 and ORAI1 in platelets from WT and Col6a1−/− mice treated with Rapa or vehicle as control. (Dii) Band densities were quantified and expressed relative to control. Data are mean ± SD (n = 5). 1-way ANOVA. (E) Flow cytometry analysis of integrin αIIbβ3 activation (JON/A antibody binding) in WT and Col6a1−/− platelets, after stimulation with thrombin (0.1 U/mL), from mice treated with Rapa or vehicle as control. Data are mean ± SD (n = 5). 1-way ANOVA. (F) Peripheral blood platelet (Plt) count in WT and Col6a1−/− mice following administration of Rapa or vehicle as control (n = 3). Data are mean ± SD (n = 3). 1-way ANOVA. *P < .05, **P < .01. CTRL, control; MFI, mean fluorescence intensity.
Platelets derived from patients harboring collagen VI mutations show increased levels of SOCE effectors
We analyzed peripheral blood platelets derived from healthy subjects and patients affected by Bethlem myopathy and UCMD of intermediate severity (Table 1). The phosphorylation of S6 ribosomal protein and of 4E-BP1 appeared significantly increased in platelets isolated from patients, relative to those isolated from healthy subjects (Figure 7A). Further, the amounts of STIM1 and ORAI1 proteins were increased in patient platelets compared with healthy subjects (Figure 7B). Additionally, when we tested platelet activation in response to thrombin stimulation, we observed increased activation of integrin αIIbβ3 in patients compared with healthy subjects (Figure 7C).
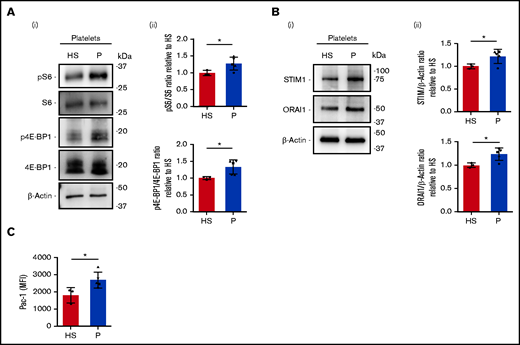
Increased STIM1 and ORAI1 expression in platelets derived from patients affected by collagen VI–related disorders. (Ai) Representative western blot of phosphorylated (p) S6 protein and 4E-BP1 protein in peripheral blood platelets of healthy subjects (HS; n = 3) and patients (P) with Bethlem myopathy/UCMD (n = 5). (Aii) Band densities were quantified and expressed relative to HS. Data are mean ± SD. Student t test. (Bi) Representative western blot of STIM1 and ORAI1 protein expression in peripheral blood platelets from HS (n = 3) and P with Bethlem myopathy/UCMD (n = 5). (Bii) Band densities were quantified and expressed relative to HS. Data are mean ± SD. Student t test. (C) Flow cytometry analysis of integrin αIIbβ3 activation (PAC-1 antibody binding) in peripheral blood platelets from HS (n = 3) and P with Bethlem myopathy/UCMD (n = 5) after stimulation with thrombin (0.5 U/mL). Data are mean ± SD. Student t test. ▵, patient 1/F; ▪, patient 2/M; ●, patient 3/M; ▾, patient 4/F; ▴, patient 5/F. Student t test. *P < .05. MFI, mean fluorescence intensity.
Increased STIM1 and ORAI1 expression in platelets derived from patients affected by collagen VI–related disorders. (Ai) Representative western blot of phosphorylated (p) S6 protein and 4E-BP1 protein in peripheral blood platelets of healthy subjects (HS; n = 3) and patients (P) with Bethlem myopathy/UCMD (n = 5). (Aii) Band densities were quantified and expressed relative to HS. Data are mean ± SD. Student t test. (Bi) Representative western blot of STIM1 and ORAI1 protein expression in peripheral blood platelets from HS (n = 3) and P with Bethlem myopathy/UCMD (n = 5). (Bii) Band densities were quantified and expressed relative to HS. Data are mean ± SD. Student t test. (C) Flow cytometry analysis of integrin αIIbβ3 activation (PAC-1 antibody binding) in peripheral blood platelets from HS (n = 3) and P with Bethlem myopathy/UCMD (n = 5) after stimulation with thrombin (0.5 U/mL). Data are mean ± SD. Student t test. ▵, patient 1/F; ▪, patient 2/M; ●, patient 3/M; ▾, patient 4/F; ▴, patient 5/F. Student t test. *P < .05. MFI, mean fluorescence intensity.
Discussion
The release of functional platelets from Mks is regulated by environmental and autocrine factors.17,20,48-50 In previous studies, we demonstrated that Mks express different extracellular matrix components that regulate platelet production.37,51 Here, we demonstrated that human and mouse Mks express collagen VI, as confirmed by 3 recent studies.52-54 In this study, we took advantage of a collagen VI–null mouse model and found that Col6a1−/− platelets display a hyperactivation tendency, as revealed by different in vitro tests that we conducted. Based on our results, this phenotype is due to an intrinsic platelet defect because the platelet function tests were performed on washed platelets that were devoid of extrinsic factors involved in platelet activation and aggregation (eg, plasma, interaction with other cells, blood flow rate). Platelet activation and aggregation are directly dependent on an increase in [Ca2+]i. The SOCE mechanism has a major role in regulating intracellular Ca2+ content in platelets through the coordinated action of its main effectors STIM1 and ORAI1.20,21 Contrary to platelets derived from mice with a constitutive activation of Stim1,15 in Col6a1−/− platelets we observed a normal basal level of cytosolic calcium. Also, the level of Ca2+ released by the ER, upon SERCA inhibition, in Col6a1−/− platelets was normal. In collagen VI–null platelets, the increased expression of STIM1 and ORAI1 resulted in a higher level of cytosolic Ca2+ influx from the extracellular space upon SOCE activation. The consequent increase in [Ca2+]i leads to increased platelet reactivity.15,55,56
We previously proved that Mks express STIM1 and ORAI1 and that an increase in [Ca2+]i prompted by SOCE activation is crucial to promote proplatelet extension and platelet release.16,57 In this study, we found overexpression of STIM1 and ORAI1 and increased SOCE in Col6a1−/− Mks, indicating that the defects displayed in collagen VI–null platelets may originate from Mks.
It was demonstrated previously that STIM1 and ORAI1 expression is under the control of the mTOR pathway.27,28 A distinctive signaling defect found in Col6a1−/− tissues is the hyperactivation of the Akt/mTOR pathway, which, in turn, results in autophagy deregulation.10,58,59 mTOR includes 2 complexes: mTORC1 and mTORC2.60 mTORC1 activation, through the PI3K/Akt/mTOR-mediated phosphorylation of 4E-BP1 and S6, regulates protein synthesis.61 The mTOR pathway was proven to positively regulate platelet activation and aggregation, as well as thrombus formation and platelet aggregate stability, by regulating protein synthesis.32,62,63
Constitutive mTOR activation stimulates mitochondrial biogenesis and function and, consequently, reactive oxygen species (ROS) production.64 Higher levels of platelet ROS are associated with increased platelet activation, and ROS scavenger administration reduces platelet activation in aged mice, which are characterized by increased mTOR signaling activity.65 In addition, a reciprocal interplay between SOCE and mitochondria has been reported because cytosolic calcium oscillations are decoded in the mitochondria.66 Thus, the increase in cytosolic calcium upon SOCE activation, as observed in Col6a1−/− Mks and platelets, might result in an imbalance in intracellular Ca2+ dynamics between organelles deputed to Ca2+ handling. Future studies will unravel whether STIM1 and ORAI1 overexpression may interfere with the mitochondrial function in Col6a1−/− Mks.
To understand whether the endogenous Mk self-produced collagen VI was the principal regulator of functional platelet production, we produced radiation chimeras by transplanting BM Lin− cells from Col6a1−/− mice into WT recipients. At 7 to 8 weeks posttransplant, when peripheral blood count was recovered, BM sorted Col6a1−/− Mks showed increased expression of STIM1 and ORAI1, despite having undergone differentiation in the presence of collagen VI in the BM environment. As in Col6a1−/− mice, STIM1 and ORAI1 overexpression in Mks resulted in the production of platelets with increased susceptibility to activation and overexpressing pS6 and p4E-BP1. These results proved that the Mk self-produced collagen VI plays a significant role in the production of functional platelets, despite the composition of the BM extracellular matrix environment.
mTOR may have an immediate effect on thrombus formation and stability through a mechanism independent from mRNA translation.31 Our data show that in vitro and in vivo inhibition of the mTOR signaling by rapamycin treatment restores STIM1 and ORAI1 expression and SOCE in Col6a1−/− Mks, leading to a normalization of the platelet activation response. Platelet function abnormalities have been described in patients affected by connective tissue disorders, such as collagenopathies; however, the mechanisms underlying these defects remain unknown.11,12,67,68 We revealed that peripheral blood platelets of patients affected by collagen VI–related diseases express higher levels of STIM1 and ORAI1, resulting in a hyperactivation state. Interestingly, platelet count was normal in all of the analyzed patients.
No platelet alterations were previously reported for Bethlem myopathy or UCMD. On the other hand, platelet abnormalities are well known in patients harboring gain-of-function mutations in ORAI1 or STIM1 and displaying a multisystemic clinical phenotype that is characterized by muscle weakness, with a clinical spectrum ranging from isolated tubular aggregate myopathy to the more complex Stormorken syndrome (STRMK) or York syndrome.69 A characteristic feature of STRMK is a mild to pronounced thrombocytopenia and thrombocytopathy. Platelets from patients with STRMK were found to be in an activated state, with increased levels of CD63 and CD62P, whereas other aspects of platelet function are impaired.69,70 Despite platelet activation and increased SOCE, no thrombotic episodes were observed in patients with STRMK, with only 1 patient presenting with pulmonary embolism and thrombosis.71 While, it has been observed a rather common bleeding tendency, possibly related to thrombocytopenia and abnormal platelet function. Patients with STRMK or with collagen VI–related diseases showed increased platelet activation, which may suggest an increased thrombotic predisposition. A mild bleeding tendency, which is well established in STRMK, may also be present in patients affected by collagen VI–related myopathies (Table 1). Consistent with this hypothesis, we observed a significantly prolonged bleeding time in Col6a1−/− mice with respect to WT mice in a tail bleeding assay (supplemental Figure 8). This apparent paradox could be explained, in part, by considering the documented key role of collagen VI on platelet adhesion and aggregation under low and high shear conditions. By linking the subendothelial basement membrane to the interstitial collagen network, collagen VI microfilaments play a pivotal role in the hemostatic process that is triggered upon the damage of blood vessels.72,73 Additional and further studies in larger patient populations are needed to establish whether and to what extent patients affected by collagen VI–related disorders have a risk for bleeding.15,74 Nevertheless, these data suggest that mutations in different genes resulting in deregulation of Ca2+ entry may underlie a shared pathophysiological mechanism involving muscle and platelets.
In conclusion, our data provide a fundamental step toward understanding the interaction between self-produced collagen VI and Ca2+ signaling in the regulation of Mk function and production of functional platelets. These data represent clinically relevant evidence to be taken into account for the long-term management of patients affected by collagen VI–related diseases, including Bethlem myopathy and UCMD.
Acknowledgments
The authors thank Cesare Perotti for supplying human cord blood.
This work was supported by the Cariplo Foundation (2013-0717), ERA-Net for Research Programmes on Rare Diseases (EUPLANE), ‘Progetti Di Ricerca Di Rilevante Interesse Nazionale’ (PRIN 2017Z5LR5Z), the Italian Ministry of Health (Ricerca Finalizzata Giovani Ricercatori GR-2016-02363136). Fellowships awarded to V.A. and C.A.D.B. were funded by Collegio Ghislieri, Pavia, progetto “Progressi in Biologia e Medicina.” The authors acknowledge support from the Telethon BioBank (GTB12001D) and the EuroBioBank network.
The funders had no role in the study design, data collection and analysis, decision to publish, or preparation of the manuscript.
Authorship
Contribution: V.A. conceived the study, designed and performed experiments, analyzed data and wrote the manuscript; C.G. designed and performed the experiments, analyzed data, and edited the manuscript; M.B., A.Z., C.A.D.B., M.C., P.-A.L., and E.L. performed experiments, analyzed data, and edited the manuscript; M.M., F.M., V.P., P. Braghetta, and P. Bernardi analyzed data and edited the manuscript; C.S., L.B., and E.P. provided patient samples and analyzed data; L.S. and A.V. assisted with radiation chimeras, analyzed data, and edited the manuscript; L.D.M. and P. Bonaldo designed experiments, analyzed data, and edited the manuscript; and A.B. conceived the study, designed experiments, analyzed data, supervised the project, and wrote the manuscript.
Conflict-of-interest disclosure: The authors declare no competing financial interests.
Correspondence: Alessandra Balduini, University of Pavia, via Forlanini 6, 27100 Pavia, Italy; e-mail: alebal04@unipv.it.

