

Key Points
BM CAR cells are the major source of local and systemic IL-6 levels upon LPS-induced inflammation.
BM CAR cell–derived IL-6 is critical to sustain an adequate hematopoietic response during chronic repetitive LPS-induced inflammation.

Abstract
Hematopoiesis is maintained by hematopoietic stem and progenitor cells that are located in the bone marrow (BM) where they are embedded within a complex supportive microenvironment consisting of a multitude of various non-hematopoietic and hematopoietic cell types. The BM microenvironment not only regulates steady-state hematopoiesis by provision of growth factors, cytokines, and cell–cell contact but is also an emerging key player during the adaptation to infectious and inflammatory insults (emergency hematopoiesis). Through a combination of gene expression analyses in prospectively isolated non-hematopoietic BM cell populations and various mouse models, we found that BM CXCL12-abundant reticular (CAR) cells are a major source of systemic and local BM interleukin-6 (IL-6) levels during emergency hematopoiesis after lipopolysaccharide (LPS) stimulation. Importantly, although IL-6 is dispensable during the initial phase of LPS-induced emergency hematopoiesis, it is required to sustain an adequate hematopoietic output during chronic repetitive inflammation. Our data highlight the essential role of the non-hematopoietic BM microenvironment for the sensing and integration of pathogen-derived signals into sustained demand-adapted hematopoietic responses.
Introduction
The hematopoietic system is hierarchically organized and maintained by hematopoietic stem cells (HSCs) that give rise to highly proliferative but lineage-committed hematopoietic progenitor cells (HPCs) that will differentiate into all mature blood cell types.1 Such proliferative and differentiation capacity requires intricate regulation as dysregulated hematopoiesis can lead to bone marrow (BM) failure, myelodysplasia, and leukemia.2-4
A plethora of cell-autonomous regulatory mechanisms such as preferential use of specific DNA repair pathways5 and tight regulation of metabolic pathways6,7 govern HSC self-renewal. In addition, HSC non-autonomous regulatory pathways operating within the BM microenvironment are essential to maintain HSC function throughout life.8 The BM microenvironment consists of multiple non-hematopoietic cell types, including osteoblasts,9,10 various subtypes of mesenchymal stromal cells (MSCs),11-15 and endothelial cells.14,16 In addition, adipocytes,17 sympathetic nerves,18 non-myelinating Schwann cells,19 and also some hematopoietic cell types such as macrophages20 and megakaryocytes21,22 have been shown to be part of the supportive BM microenvironment.
Various naturally occurring stimuli, most importantly bleeding and infection, have shaped the hematopoietic system during evolution to be able to rapidly augment its cellular output to meet the enormous demand for mature blood cells during these emergency situations.23,24 How infection- and inflammation-driven emergency hematopoiesis is regulated is an active area of research.25 An emerging concept is that the BM microenvironment participates in regulating the switch from steady-state to emergency hematopoiesis. For example, we have previously shown that Toll-like receptor (TLR)-expressing endothelial cells sense pathogen-derived lipopolysaccharide (LPS) and translate the presence of gram-negative bacteria into emergency granulopoiesis via secretion of granulocyte colony-stimulating factor (G-CSF).26,27 Similarly, a recent study showed that specialized macrophage-CSF–expressing BM endothelial cells regulate the differentiation of monocyte-dendritic cell progenitors into nonclassical monocytes and dendritic cells during infection with Listeria monocytogenes.28
However, regulation of inflammation-driven, demand-adapted hematopoiesis and involvement of the BM microenvironment remain incompletely understood. To gain a deeper understanding of which non-hematopoietic BM cell populations are producers of hematopoiesis-regulating inflammatory growth factors, we performed targeted gene expression analyses on prospectively isolated non-hematopoietic BM cells from LPS-treated and polyinosinic–polycytidylic acid [poly(I:C)]–treated mice to mimic gram-negative and viral infection, respectively.
Methods
Mice
C57BL/6J (CD45.2+), B6.SJL (CD45.1+), Tlr4−/−, Rag1−/−, Il6−/−, LeprCre, Il6flox/flox, Tlr4flox/flox, Myd88flox/flox, loxP-GFP (B6.Cg-Gt(ROSA)26Sortm6(CAGZsGreen1)Hze/J), and Cxcl12-GFP mice were used in this study. All animals were maintained at the University Hospital Zurich animal facility and treated in accordance with the guidelines of the Swiss Federal Veterinary Office. Experiments and procedures were approved by the Veterinäramt des Kantons Zurich.
LPS and poly(I:C)
Mice received 1 to 9 IV injections of 35 µg ultrapure LPS from Escherichia coli 0111:B4 (InvivoGen) or 100 µg poly(I:C) (InvivoGen) as indicated in the respective experiments.
Flow cytometry
The following antibodies (all from eBioscience, unless otherwise stated) were used: BM cell populations: anti-CD11b (M1/70) and anti-Gr1 (RB6-8C5). Assessment reciprocal BM chimeric mice: anti-CD45.1 (A20, BioLegend) and anti-CD45.2 (104). Hematopoietic stem and progenitor cells (HSPCs): anti-CD3ɛ (145-2C11), anti-CD4 (GK1.5, BioLegend), anti-CD8α (53-6.7, BioLegend), anti-B220 (RA3-6B2), anti-CD11b (M1/70), anti-Gr1 (RB6-8C5), anti-Ter119 (TER-119, BioLegend), anti-IL7Rα (A7R34), anti-NK1.1 (PK136, BioLegend), anti-cKit (2B8), anti–Sca-1 (D7, BioLegend), anti-CD34 (RAM34), anti-FcγR (93), anti-CD48 (HM48-1), and anti-CD150 (TC15-12F12.2, BioLegend). Classical and plasmacytoid dendritic cells: anti-CD3e (145-2C11), anti-CD19 (MB19-1), anti-NK1.1 (PK136; Becton Dickinson), anti-CD45RA (14.8; BD Biosciences), anti-CD11c (N418), and anti-MHCII (M5/114.15.2). BM non-hematopoietic BM stromal cells: anti-Sca1 (D7, BioLegend), anti-Ter119 (TER-119, BioLegend), anti-CD45 (30-F11, BioLegend), anti-CD31 (390), anti-CD105 (MJ7/18), and anti-CD140b (APB5). Interleukin-6 (IL-6) receptor α and β subunits: anti-CD126 (D7715A7, BioLegend) and anti-CD130 (KGP130).
Colony-forming unit assay
Briefly, 1 × 10⁴ red blood cell–lysed whole BM cells of 3-week phosphate-buffered saline (PBS) or LPS-treated mice were used. Cells were plated in a mix of methylcellulose (MethoCult M3234; Stemcell Technologies), Iscove’s modified Dulbecco’s medium (30% fetal calf serum, 2 mM l-glutamine, 50 mM 2-mercaptoethanol), and the following factors: mIL-3 (10 ng/mL), hIL-6 (10 ng/mL), murine stem cell factor (10 ng/mL), murine granulocyte-macrophage colony-stimulating factor (10 ng/mL), murine thrombopoietin (10 ng/mL), mFLT3-ligand (10 ng/mL) (all PeproTech), and human erythropoietin (10 μg/mL). Colonies were counted and classified after 12 days of in vitro culture.
RNA extraction and complementary DNA synthesis
Cells were sorted directly into lysis buffer (RNeasy Micro Plus Kit, QIAGEN). A total of 30 µg of solid organs was snap frozen in liquid nitrogen, pulverized, and lysed (RNeasy Mini Plus Kit, QIAGEN). RNA was extracted according to the manufacturer’s instructions, followed by complementary DNA synthesis using the High-Capacity cDNA Reverse Transcription Kit (Applied Biosystems).
Quantitative reverse-transcription polymerase chain reaction
Quantitative reverse transcription polymerase chain reaction (qRT-PCR) was performed by using SYBR green reagent (Applied Biosystems). Samples were run on a 7500 FAST real-time PCR thermal cycler (Applied Biosystems). Primer sequences are provided in the supplemental Methods.
Enzyme-linked immunosorbent assay
Plasma samples were obtained by postmortem cardiac puncture. BM samples were generated flushing one femur with a 1:1 mix of complete ULTRA Tablets (Roche) dissolved in PBS and RayBio 2× Cell Lysis Buffer (RayBiotech, Inc.). IL-6 protein levels were measured by using the Quantikine ELISA Kit (R&D Systems).
Equations and statistical analyses
Graphs depict mean ± standard error of the mean. The significance of differences was analyzed by using a Student t test. A difference between experimental groups was considered significant when the P value was <.05. All statistical analyses were calculated with Prism version 5 (GraphPad Software).
Results
Il6 expression is significantly induced in BM CAR cells upon a single LPS injection
To investigate mechanisms by which the non-hematopoietic BM microenvironment regulates the hematopoietic system’s adaptation to severe systemic infection, we modified a previously published method29 to prospectively isolate different mouse non-hematopoietic BM stromal cell populations by fluorescence-activated cell sorting (FACS). Based on expression of CD45, Ter119, Sca-1, CD31, CD105, and CD140b, it was possible to define and isolate several non-hematopoietic cell types from mouse BM30 (Figure 1A): sinusoidal endothelial cells (SECs; CD45–Ter119–CD31+CD105hiSca-1int), arteriolar endothelial cells (AECs; CD45–Ter119–CD31+CD105intSca-1hi), cells with double-expression of platelet-derived growth factor receptor-α and Sca1 (ie, PαS cells29 ) (CD45–Ter119–CD31–Sca1+CD140b+), and CXCL12-abundant reticular cells (CAR cells; CD45–Ter119–CD31–Sca1–CD140b+). The quintuple-negative (CD45–Ter119–CD31–Sca1–CD140b–) population mostly consisted of debris as determined by morphologic assessment of cytospin preparations (data not shown) (Figure 1A). We therefore excluded this population from further analyses.
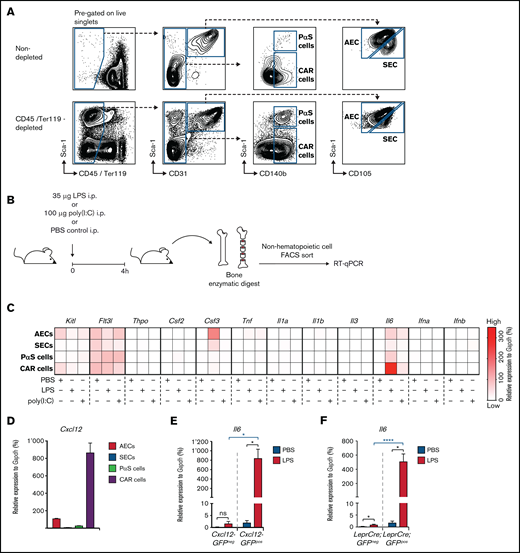
Expression of hematopoietic growth factors and inflammatory cytokines in non-hematopoietic BM stromal cell subpopulations after a single LPS injection. (A) Representative FACS profiles showing non-hematopoietic cell types of the BM microenvironment, either non-depleted (upper panel) or with MACS column-based CD45/Ter119 depletion (lower panel) (AEC, SEC, PαS cells, and CAR cells). (B) Graphical scheme depicting experimental outline for the induction of LPS- or poly(I:C)–induced inflammation and subsequent isolation of non-hematopoietic BM cells. (C) Gene expression of 12 hematopoietic growth factors and inflammatory cytokines from PBS-, LPS-, or poly(I:C)–injected WT mice from 3 independent experiments. Relative expression normalized to Gapdh from qRT-PCR is depicted as a heat map. (D) Cxcl12 expression levels in BM AECs, SECs, PαS cells, and CAR cells were assessed by qRT-PCR and normalized to Gapdh. Il6 expression normalized to Gapdh in BM non-hematopoietic (CD45–Ter119–) GFPpos and GFPneg cells from Cxcl12-GFP (E) and LeprCre;GFP mice (F), respectively. *P < .05, ****P < .0001). Csf2, colony-stimulating factor 2 (granulocyte-macrophage); Csf3, colony-stimulating factor 3 (granulocyte); Flt3l, FMS-like tyrosine kinase 3 ligand; Ifna, interferon-α; Ifnb, interferon-β; Il1a, interleukin-1α; Il1b, interleukin-1β; Il3, interleukin-3; Il6, interleukin-6; i.p., intraperitoneal; Kitl, kit ligand; ns, not significant; Thpo, thrombopoietin; Tnf, tumor necrosis factor.
Expression of hematopoietic growth factors and inflammatory cytokines in non-hematopoietic BM stromal cell subpopulations after a single LPS injection. (A) Representative FACS profiles showing non-hematopoietic cell types of the BM microenvironment, either non-depleted (upper panel) or with MACS column-based CD45/Ter119 depletion (lower panel) (AEC, SEC, PαS cells, and CAR cells). (B) Graphical scheme depicting experimental outline for the induction of LPS- or poly(I:C)–induced inflammation and subsequent isolation of non-hematopoietic BM cells. (C) Gene expression of 12 hematopoietic growth factors and inflammatory cytokines from PBS-, LPS-, or poly(I:C)–injected WT mice from 3 independent experiments. Relative expression normalized to Gapdh from qRT-PCR is depicted as a heat map. (D) Cxcl12 expression levels in BM AECs, SECs, PαS cells, and CAR cells were assessed by qRT-PCR and normalized to Gapdh. Il6 expression normalized to Gapdh in BM non-hematopoietic (CD45–Ter119–) GFPpos and GFPneg cells from Cxcl12-GFP (E) and LeprCre;GFP mice (F), respectively. *P < .05, ****P < .0001). Csf2, colony-stimulating factor 2 (granulocyte-macrophage); Csf3, colony-stimulating factor 3 (granulocyte); Flt3l, FMS-like tyrosine kinase 3 ligand; Ifna, interferon-α; Ifnb, interferon-β; Il1a, interleukin-1α; Il1b, interleukin-1β; Il3, interleukin-3; Il6, interleukin-6; i.p., intraperitoneal; Kitl, kit ligand; ns, not significant; Thpo, thrombopoietin; Tnf, tumor necrosis factor.
Having established this prospective isolation method, wild-type (WT) mice received a single injection of high-dose LPS or poly(I:C) to mimic severe gram-negative or viral infection, respectively. Four hours later, the various non-hematopoietic cell populations were isolated and subjected to gene expression analysis by qRT-PCR for a selection of candidate prototypic hematopoietic growth factors and inflammatory cytokines (Figure 1B; supplemental Figure 1). Expression values relative to Gapdh were visualized as a heat map (Figure 1C) to better account for the large range of expression values between weakly and strongly expressed genes. Most of the selected and assessed genes were either not or only weakly expressed in PBS-injected mice (ie, unperturbed steady-state hematopoiesis) and only displayed little to modest induction after LPS or poly(I:C) treatment. In accordance with previously published data,14 steady-state Kitl expression was specifically confined to AECs and CAR cells. Furthermore, LPS-induced Csf3 expression was largely restricted to AECs but not SECs, thereby confirming and extending our previously published findings.27 Most importantly, although Il6 was undetectable in steady state, it was significantly and specifically upregulated in CAR cells after LPS but not poly(I:C) stimulation. Notably, Il6 also showed the highest expression compared with the other genes (Figure 1C; supplemental Figure 1).
To further investigate whether CD45–Ter119–CD31–Sca1–CD140b+ cells indeed represent CAR cells, we independently assessed Cxcl12 expression within non-hematopoietic BM cell populations. As expected, extremely high Cxcl12 expression was observed in CD45–Ter119–CD31–Sca1–CD140b+ cells (Figure 1D). Moreover, highly significant LPS-induced Il6 expression was noted in non-hematopoietic BM green fluorescent protein (GFP)+ cells from Cxcl12-GFP and LeprCre;GFP transgenic mice that have been shown to specifically target CAR cells12,14 (Figure 1E-F), corroborating the validity of our FACS-based isolation method.
Based on these findings, we focused our further efforts on studying the role of CAR cells as a potentially relevant, previously unknown source of IL-6 during LPS-induced inflammation.
CAR cells are the major source for systemic and local BM IL-6 levels upon LPS-induced inflammation
To reveal the relative contribution of CAR cells to IL-6 abundance after LPS-induced inflammation, we first assessed Il6 expression in total tissue extracts from major solid organs (heart, lung, liver, kidney, and spleen) as well as total bone by using qRT-PCR (Figure 2A). Although Il6 expression was undetectable in control mice, it was induced in all organs analyzed, albeit to a very different extent. Of note, inducible Il6 expression was significantly highest in total bone compared with all other organs. Spleen and lung also had relatively high Il6 expression, whereas kidney, heart, and liver exhibited minor Il6 induction after LPS treatment (Figure 2B). These results show that total bone consisting of both hematopoietic as well as non-hematopoietic cells is indeed a relevant source of IL-6 upon LPS-induced inflammation.
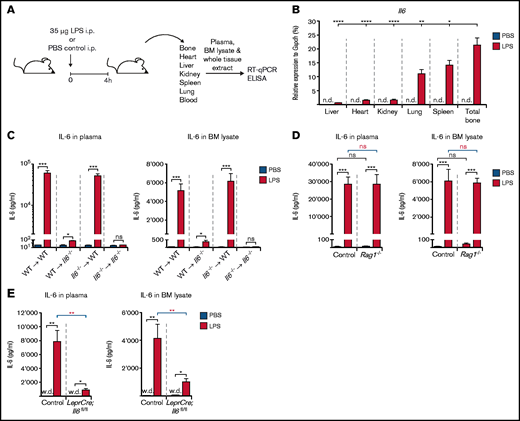
Il6 expression in total tissue extracts from various organs and IL-6 levels in peripheral blood and BM lysates of reciprocal Il6−/− BM chimeric mice as well as LeprCre;Il6fl/fl and Rag1−/− mice after a single LPS injection. (A) Experimental outline illustrating induction of LPS-induced inflammation in WT, reciprocal Il6−/− BM chimeric, Rag1−/−, and LeprCre;Il6fl/fl mice before isolation of major solid organs and collection of plasma and BM lysates for qRT-PCR and ELISA, respectively. This schedule is applicable to experimental data depicted in panels B to E. (B) Il6 expression relative to Gapdh after LPS stimulation in whole tissue extracts from total bone, spleen, lung, kidney, heart, and liver of WT mice. IL-6 protein levels in steady-state (PBS-injected) plasma and BM lysates or after LPS stimulation in reciprocal Il6−/− BM chimeric mice (C), Rag1−/− mice (D), and Lepr-Cre;Il6fl/fl mice (E). *P < .05, **P < .01, ***P < .001, ****P < .0001. i.p., intraperitoneal; n.d., not detectable; ns, nonsignificant; w.d., weakly detectable.
Il6 expression in total tissue extracts from various organs and IL-6 levels in peripheral blood and BM lysates of reciprocal Il6−/− BM chimeric mice as well as LeprCre;Il6fl/fl and Rag1−/− mice after a single LPS injection. (A) Experimental outline illustrating induction of LPS-induced inflammation in WT, reciprocal Il6−/− BM chimeric, Rag1−/−, and LeprCre;Il6fl/fl mice before isolation of major solid organs and collection of plasma and BM lysates for qRT-PCR and ELISA, respectively. This schedule is applicable to experimental data depicted in panels B to E. (B) Il6 expression relative to Gapdh after LPS stimulation in whole tissue extracts from total bone, spleen, lung, kidney, heart, and liver of WT mice. IL-6 protein levels in steady-state (PBS-injected) plasma and BM lysates or after LPS stimulation in reciprocal Il6−/− BM chimeric mice (C), Rag1−/− mice (D), and Lepr-Cre;Il6fl/fl mice (E). *P < .05, **P < .01, ***P < .001, ****P < .0001. i.p., intraperitoneal; n.d., not detectable; ns, nonsignificant; w.d., weakly detectable.
To further decipher the relative importance of hematopoietic vs non-hematopoietic cells to IL-6 availability, we generated reciprocal BM chimeric mice with Il6 expression restricted to either hematopoietic (WT ⇒ Il6−/−) or non-hematopoietic cells (Il6−/− ⇒ WT) as well as control mice (WT ⇒ WT and Il6−/− ⇒ Il6−/−), and assessed systemic and local IL-6 levels in plasma and BM lysates after PBS or high-dose LPS treatment by using enzyme-linked immunosorbent assay (ELISA) (Figure 2A). A strikingly clear pattern of highly and equally elevated plasma and BM IL-6 levels was observed in LPS-treated WT ⇒ WT and Il6−/− ⇒ WT mice. By contrast, Il6−/− ⇒ Il6−/− and WT ⇒ Il6−/− mice were nonresponsive or severely hyporesponsive toward LPS stimulation (Figure 2C).
It has recently been shown that CD8+ cytotoxic T cells stimulate IL-6 release from BM MSCs in an interferon-dependent manner during viral infection.31 We therefore assessed the role of T cells for IL-6 induction in the setting of LPS-induced inflammation. Systemic and local BM IL-6 levels upon high doses of LPS were indistinguishable between WT and T cell–deficient Rag1−/− mice (Figure 2D). Thus, T lymphocytes are dispensable for IL-6 induction after LPS-induced inflammation.
Altogether, our data clearly show that non-hematopoietic BM cells are the most relevant source of IL-6, both systemically as well as locally in the BM, after LPS-induced inflammation.
Results from our targeted gene expression analyses (Figure 1C; supplemental Figure 1) strongly suggest that CAR cells represent this BM-resident, non-hematopoietic cell type responsible for IL-6 production upon LPS stimulation. To provide more evidence for this conclusion, we bred LeprCre mice with Il6fl/fl mice,32 generating mice with an Il6 deficiency in perivascular non-hematopoietic BM cells, including CAR cells (LeprCre;Il6fl/fl mice). Notably, LPS-induced elevation of IL-6 plasma and BM levels was almost completely abrogated in LeprCre;Il6fl/fl mice, whereas control mice responded normally with an increase in IL-6 levels (Figure 2E).
In summary, by combining several independent experimental in vitro and in vivo models, our data show that BM CAR cells are indeed the major source of IL-6 in plasma and BM after LPS-induced inflammation.
IL-6 is required to adequately increase numbers of immunophenotypically defined HSPCs and to maintain myeloid cell numbers during chronic repetitive LPS-induced inflammation
Having determined the primary source of IL-6 after LPS stimulation, we set out to determine the functional impact of IL-6 on the course of LPS-induced emergency hematopoiesis. To this end, we used an established model of LPS-induced emergency hematopoiesis that we have previously shown to elicit a strong, primarily G-CSF–dependent hematopoietic response.26,27 Results from these experiments showed that IL-6 is dispensable for the short-term effects during emergency hematopoiesis (supplemental Figure 2). We thus hypothesized that IL-6 may have a regulatory function only during prolonged inflammatory conditions. Therefore, we subjected WT and Il6−/− mice to an LPS treatment scheme consisting of a total of 9 high-dose LPS injections over a period of 3 weeks (Figure 3A). BM HSPC and myeloid populations from PBS- and LPS-treated mice were defined by using FACS (Figure 3B). Unlike short-term LPS stimulation, chronic repetitive LPS treatment led to significant differences between the responses observed in WT and Il6−/− mice. Although chronic repetitive LPS stimulation of WT mice led to only a slightly but still significantly reduced BM cellularity, this decrease in BM cellularity was significantly more pronounced in Il6−/− mice (Figure 3C). Furthermore, although the percentages of BM HSPC and myeloid populations were similar in LPS-treated WT and Il6−/− mice (supplemental Figure 3), a significant, ∼30% to 40% reduction occurred in the LPS-induced increase in absolute cell numbers of Lin–Sca-1+c-kit+CD150+CD48– long-term HSCs and Lin–Sca-1+c-kit+CD150+/−CD48+ HPCs in Il6−/− mice compared with WT mice (Figure 3D). In addition, Lin–Sca-1–c-kit+CD34+FcgR+ granulocyte-macrophage progenitors (GMPs) and CD11b+Gr1low and CD11b+Gr1high myeloid cells failed to increase or even decreased during chronic repetitive LPS stimulation in the BM of Il6−/− mice compared with WT mice. To formally prove that CAR cell–derived IL-6 is necessary for the aforementioned failure to maintain an appropriate quantitative hematopoietic response after chronic repetitive LPS stimulation, we repeated the experiment in LeprCre;Il6fl/fl and control mice. As expected, an identical response pattern was observed after chronic repetitive LPS treatment in LeprCre;Il6fl/fl mice compared with Il6−/− mice (Figure 3E-F).
![Hematopoietic response in BM of Il6−/− and LeprCre;Il6fl/fl mice upon chronic repetitive LPS treatment. (A) Graphical scheme depicting experimental outline for modeling chronic inflammation by repetitive LPS injections over a 3-week period followed by analysis of different hematopoietic cell types as well as measurement of IL-6 levels in plasma and BM lysates. This schedule is applicable to the experimental data depicted in panels C to H. (B) Representative FACS profile showing gating strategy for the identification of LT-HSC and HPC, myeloerythroid progenitors (common myeloid progenitor [CMP]; GMP; and megakaryocyte-erythrocyte progenitor [MEP]) (left panel) as well as immature (CD11b+Gr1low) and mature (CD11b+Gr1high) granulocytic cells (right panel) in PBS-treated (upper panel) and LPS-treated (lower panel) Il6−/−, LeprCre;Il6fl/fl, and respective control mice. BM cellularity (C) and absolute numbers per hind leg of immunophenotypically defined LT-HSCs, HPCs, GMPs, CD11b+Gr1high, and CD11b+Gr1low cells (D) in LPS-treated (red bars) or PBS-treated (blue bars) WT and Il6−/− mice according to the treatment schedule depicted under panel A. BM cellularity (E) and absolute numbers of immunophenotypically defined LT-HSCs, HPCs, GMPs, CD11b+Gr1high, and CD11b+Gr1low cells (F) in LPS-treated (red bars) or PBS-treated (blue bars) control and LeprCre;Il6fl/fl mice according to the treatment schedule depicted under panel A. (G) IL-6 protein levels as measured by ELISA in plasma and BM lysates of Il6−/− BM reciprocal chimeric mice after PBS (blue bars) or LPS (red bars) injection according to the experimental scheme shown in panel A. (H) IL-6 protein levels as measured by ELISA in plasma and BM lysates of LeprCre;Il6fl/fl mice after PBS (blue bars) or LPS (red bars) injection according to the experimental scheme shown in panel A. *P < .05, **P < .01, ***P < .001, ****P < .0001. i.p., intraperitoneal; ns, nonsignificant.](https://ash.silverchair-cdn.com/ash/content_public/journal/bloodadvances/5/23/10.1182_bloodadvances.2021005531/5/m_advancesadv2021005531f3.png?Expires=1769090760&Signature=eO6DIErnb~YkYh3PUyvDg8hqnFd53UttkKJw7eeRm8hjPdnxnosmL-mVU9BrkP0iUFu3q0gaRRwyn3sKhK47S1zPRnM67ySeNjBMu5qdJUEFRn1D1BKRYWJzznqlz-gX3cDPlGKWxHwoyzSjBD6xL03lIP7NXReL9N-RF3dgkdxjuYPeoVcTxz8MmeaWUIAz4NKE-Im5heEL~rf-VOrpMG-t8jhkvMKj-J-xL5lmrhzaPhs1W4cxjHhaaQQpBrbpXk8efp1Y6RaQnBR787M4R6vt-eUsJ604TaE3XDmYbFnBE5c9G3b2U5s5-IagXj6c0vtIJLh6NrrFzRiS1XDNWA__&Key-Pair-Id=APKAIE5G5CRDK6RD3PGA)
Hematopoietic response in BM of Il6−/− and LeprCre;Il6fl/fl mice upon chronic repetitive LPS treatment. (A) Graphical scheme depicting experimental outline for modeling chronic inflammation by repetitive LPS injections over a 3-week period followed by analysis of different hematopoietic cell types as well as measurement of IL-6 levels in plasma and BM lysates. This schedule is applicable to the experimental data depicted in panels C to H. (B) Representative FACS profile showing gating strategy for the identification of LT-HSC and HPC, myeloerythroid progenitors (common myeloid progenitor [CMP]; GMP; and megakaryocyte-erythrocyte progenitor [MEP]) (left panel) as well as immature (CD11b+Gr1low) and mature (CD11b+Gr1high) granulocytic cells (right panel) in PBS-treated (upper panel) and LPS-treated (lower panel) Il6−/−, LeprCre;Il6fl/fl, and respective control mice. BM cellularity (C) and absolute numbers per hind leg of immunophenotypically defined LT-HSCs, HPCs, GMPs, CD11b+Gr1high, and CD11b+Gr1low cells (D) in LPS-treated (red bars) or PBS-treated (blue bars) WT and Il6−/− mice according to the treatment schedule depicted under panel A. BM cellularity (E) and absolute numbers of immunophenotypically defined LT-HSCs, HPCs, GMPs, CD11b+Gr1high, and CD11b+Gr1low cells (F) in LPS-treated (red bars) or PBS-treated (blue bars) control and LeprCre;Il6fl/fl mice according to the treatment schedule depicted under panel A. (G) IL-6 protein levels as measured by ELISA in plasma and BM lysates of Il6−/− BM reciprocal chimeric mice after PBS (blue bars) or LPS (red bars) injection according to the experimental scheme shown in panel A. (H) IL-6 protein levels as measured by ELISA in plasma and BM lysates of LeprCre;Il6fl/fl mice after PBS (blue bars) or LPS (red bars) injection according to the experimental scheme shown in panel A. *P < .05, **P < .01, ***P < .001, ****P < .0001. i.p., intraperitoneal; ns, nonsignificant.
Hematopoietic response in BM of Il6−/− and LeprCre;Il6fl/fl mice upon chronic repetitive LPS treatment. (A) Graphical scheme depicting experimental outline for modeling chronic inflammation by repetitive LPS injections over a 3-week period followed by analysis of different hematopoietic cell types as well as measurement of IL-6 levels in plasma and BM lysates. This schedule is applicable to the experimental data depicted in panels C to H. (B) Representative FACS profile showing gating strategy for the identification of LT-HSC and HPC, myeloerythroid progenitors (common myeloid progenitor [CMP]; GMP; and megakaryocyte-erythrocyte progenitor [MEP]) (left panel) as well as immature (CD11b+Gr1low) and mature (CD11b+Gr1high) granulocytic cells (right panel) in PBS-treated (upper panel) and LPS-treated (lower panel) Il6−/−, LeprCre;Il6fl/fl, and respective control mice. BM cellularity (C) and absolute numbers per hind leg of immunophenotypically defined LT-HSCs, HPCs, GMPs, CD11b+Gr1high, and CD11b+Gr1low cells (D) in LPS-treated (red bars) or PBS-treated (blue bars) WT and Il6−/− mice according to the treatment schedule depicted under panel A. BM cellularity (E) and absolute numbers of immunophenotypically defined LT-HSCs, HPCs, GMPs, CD11b+Gr1high, and CD11b+Gr1low cells (F) in LPS-treated (red bars) or PBS-treated (blue bars) control and LeprCre;Il6fl/fl mice according to the treatment schedule depicted under panel A. (G) IL-6 protein levels as measured by ELISA in plasma and BM lysates of Il6−/− BM reciprocal chimeric mice after PBS (blue bars) or LPS (red bars) injection according to the experimental scheme shown in panel A. (H) IL-6 protein levels as measured by ELISA in plasma and BM lysates of LeprCre;Il6fl/fl mice after PBS (blue bars) or LPS (red bars) injection according to the experimental scheme shown in panel A. *P < .05, **P < .01, ***P < .001, ****P < .0001. i.p., intraperitoneal; ns, nonsignificant.
Moreover, IL-6 levels in plasma and BM lysates of WT ⇒ WT and Il6−/− ⇒ WT mice subjected to chronic repetitive LPS stimulation increased significantly and were indistinguishable from each other (Figure 3G), whereas Il6−/− ⇒ Il6−/− and WT ⇒ Il6−/− mice were nonresponsive or severely hyporesponsive. The same response pattern was also observed when LeprCre;Il6fl/fl mice underwent chronic repetitive LPS stimulation (Figure 3H), indicating that even in the setting of prolonged LPS-induced inflammation, both systemic and local BM IL-6 levels depend on non-hematopoietic CAR cells. These results show that maintenance of elevated IL-6 during chronic repetitive LPS stimulation levels necessitates IL-6 production in non-hematopoietic CAR cells.
Collectively, our data show that CAR cell–derived IL-6 is required to adequately increase numbers of immunophenotypically defined HSPC populations and to maintain adequate myeloid cell numbers during chronic repetitive LPS-induced inflammation.
IL6 is required to increase the number of myeloid colony-forming units during chronic repetitive LPS-induced inflammation in vivo and directly stimulates enhanced myeloid colony-forming unit activity in vitro
Because there is only a weak correlation between HSPC immunophenotype and functionality, especially under inflammatory conditions,33 we chose to functionally evaluate our findings. To this end, WT and Il6−/− mice were given chronic repetitive high-dose LPS treatment, and whole BM cells were isolated and subjected to a fully cytokine-supplemented (including IL-6) colony-forming unit (CFU) assay (Figure 4A). Not surprisingly, a substantial and highly significant increase occurred in total colony formation, primarily due to increased numbers of granulocytic colonies (CFU-G) in LPS-treated WT mice compared with PBS-injected WT mice (Figure 4B). In stark contrast to LPS-treated WT mice, chronic repetitive LPS treatment of Il6−/− mice not only failed to increase colony formation but also led to a significant decline in CFU activity. Of note, in vitro IL-6 supplementation does not suffice to rescue the hematopoietic phenotype in vitro resulting from in vivo IL-6 deficiency. Importantly, when we conducted the same experiment as described earlier in LeprCre;Il6fl/fl and control mice, an identical response was observed (Figure 4C).

CFUs in BM of Il6−/− and LeprCre;Il6fl/fl mice upon chronic repetitive LPS treatment and evidence for direct IL-6 action on HSPCs. (A) Experimental outline illustrating chronic repetitive LPS treatment of Il6−/−, Lepr-Cre;Il6fl/fl, and control mice followed by collection of whole BM cells that were subjected to CFU assays. This schedule is applicable to experimental data depicted in panels B and C. (B-C) CFU activity shown as absolute CFU number per 1 hind leg in the BM of Il6−/−, Lepr-Cre;Il6fl/fl and respective control mice after chronic repetitive in vivo LPS treatment according to panel A. (D) Left panel shows a representative flow cytometric analysis for CD126 (IL-6R α chain, blue histograms) expression in LT-HSC, HPC, common myeloid progenitor (CMP), GMP, megakaryocyte-erythrocyte progenitor (MEP), CD11b+Gr1high, and CD11b+Gr1low cells in steady-state WT mice compared with isotype-matched controls (gray histograms). Right panel shows the delta mean fluorescent intensities (ΔMFI) as calculation of MFI testor – MFI isotype control from 3 independent experiments. (E) Left panel shows a representative flow cytometric analysis for CD130 (gp130, red histograms) expression in LT-HSC, HPC, CMP, GMP, MEP, CD11b+Gr1high, and CD11b+Gr1low cells in steady-state WT mice compared with appropriate isotype controls (gray histograms). Right panel shows the ΔMFI calculated as described earlier. Results from 3 independent experiments are shown. (F) CFU activity in c-Kit–enriched BM cells isolated from steady-state WT mice and cultured in the presence or absence of IL-6 but in otherwise fully cytokine-supplemented methylcellulose medium (initial plating 0°). After 7 days in culture, colonies were scored, cells harvested, and 3000 cells were re-plated (1° re-plating) and grown under the same conditions (ie, ±IL-6) for another 7 days. Upon the second re-plating (2°) no colony growth could be observed. *P < .05, **P < .01, ***P < .001, ****P < .0001. BFU-E, burst-forming unit erythrocyte; CFU-G, CFU granulocyte; CFU-GEMM, CFU granulocyte/erythrocyte/macrophage/megakaryocyte; CFU-GM, CFU granulocyte/macrophage; CFU-M, CFU macrophage; i.p., intraperitoneal; ns, nonsignificant.
CFUs in BM of Il6−/− and LeprCre;Il6fl/fl mice upon chronic repetitive LPS treatment and evidence for direct IL-6 action on HSPCs. (A) Experimental outline illustrating chronic repetitive LPS treatment of Il6−/−, Lepr-Cre;Il6fl/fl, and control mice followed by collection of whole BM cells that were subjected to CFU assays. This schedule is applicable to experimental data depicted in panels B and C. (B-C) CFU activity shown as absolute CFU number per 1 hind leg in the BM of Il6−/−, Lepr-Cre;Il6fl/fl and respective control mice after chronic repetitive in vivo LPS treatment according to panel A. (D) Left panel shows a representative flow cytometric analysis for CD126 (IL-6R α chain, blue histograms) expression in LT-HSC, HPC, common myeloid progenitor (CMP), GMP, megakaryocyte-erythrocyte progenitor (MEP), CD11b+Gr1high, and CD11b+Gr1low cells in steady-state WT mice compared with isotype-matched controls (gray histograms). Right panel shows the delta mean fluorescent intensities (ΔMFI) as calculation of MFI testor – MFI isotype control from 3 independent experiments. (E) Left panel shows a representative flow cytometric analysis for CD130 (gp130, red histograms) expression in LT-HSC, HPC, CMP, GMP, MEP, CD11b+Gr1high, and CD11b+Gr1low cells in steady-state WT mice compared with appropriate isotype controls (gray histograms). Right panel shows the ΔMFI calculated as described earlier. Results from 3 independent experiments are shown. (F) CFU activity in c-Kit–enriched BM cells isolated from steady-state WT mice and cultured in the presence or absence of IL-6 but in otherwise fully cytokine-supplemented methylcellulose medium (initial plating 0°). After 7 days in culture, colonies were scored, cells harvested, and 3000 cells were re-plated (1° re-plating) and grown under the same conditions (ie, ±IL-6) for another 7 days. Upon the second re-plating (2°) no colony growth could be observed. *P < .05, **P < .01, ***P < .001, ****P < .0001. BFU-E, burst-forming unit erythrocyte; CFU-G, CFU granulocyte; CFU-GEMM, CFU granulocyte/erythrocyte/macrophage/megakaryocyte; CFU-GM, CFU granulocyte/macrophage; CFU-M, CFU macrophage; i.p., intraperitoneal; ns, nonsignificant.
Next, we addressed the question of whether CAR cell–derived IL-6 acts directly on HSPCs or via indirect mechanisms. First, we assessed cell surface expression of IL-6Rα (CD126) and gp130 (CD130), the ligand-binding and signal-transducing subunits of the IL-6 receptor, respectively, on HSPC and myeloid cell populations by using flow cytometry. We could observe detectable CD126 expression on all HSPC cell populations except for megakaryocyte-erythrocyte progenitors (Figure 4D). Interestingly, CD126 expression gradually increased from Lin–Sca-1+c-kit+CD150+CD48– long-term HSCs (LT-HSCs) to Lin–Sca-1–c-kit+CD34+FcγR+ GMPs. CD126 expression could also be robustly detected in more differentiated myeloid cells (CD11b+Gr1low and CD11b+Gr1high). CD130 showed an inverse expression pattern, with the highest expression in LT-HSCs and the lowest expression in GMPs (Figure 4E). These results show that HSPCs due to their CD126/CD130 expression possess the necessary prerequisites to functionally respond to IL-6. Moreover, the observation that GMPs exhibit the highest CD126 expression may suggest that GMPs represent the major IL-6–responsive HSPC population.
To functionally test whether HSPCs could directly respond to IL-6 in vitro, we performed serial re-plating CFU assays in the presence or absence of IL-6 but in otherwise fully cytokine-supplemented methylcellulose medium (Figure 4F). The number of productive serial re-platings was independent of the presence or absence of IL-6, as both HSPCs cultured in vitro with or without IL-6 were incapable of forming colonies beyond the first re-plating. However, HSPCs cultured in the presence of IL-6 generated significantly more colonies both during the initial culture period as well as after the first re-plating when equal numbers of cells harvested from the initial cultures were re-plated. These data strongly suggest that IL-6 could directly act on HSPCs and that IL-6 signaling prolongs in vitro HPC maintenance.
Altogether, our results show that CAR cell–derived IL-6 is critical to sustain hematopoiesis during chronic repetitive LPS-induced inflammation.
Systemic and local BM IL-6 levels during LPS-induced chronic repetitive inflammation depend on Tlr4 expression by non-hematopoietic cells
Next, we determined whether sensing of LPS occurs directly in CAR cells followed by IL-6 secretion or whether LPS sensing is accomplished in another cell type that, in turn, stimulates IL-6 secretion from CAR cells via an intermediate signal.
To address this question, we first determined expression of all relevant murine TLRs (Tlr1-9) in CAR cells by qRT-PCR compared with conventional dendritic cells and plasmacytoid dendritic cells, thereafter collectively referred to as DCs, which are known to robustly express Tlr genes34 (Figure 5A). We observed surprisingly high expression of a variety of Tlr genes in CAR cells at similar levels compared with DCs (Figure 5B). Importantly, among the most highly expressed Tlr genes in CAR cells was Tlr4, the cognate receptor for LPS. Of note, we also observed high Tlr4 expression in AECs, SECs, and MSCs relative to DCs (supplemental Figure 4A). We then generated reciprocal BM chimeric mice with Tlr4 expression compartmentalized to either hematopoietic (WT ⇒ Tlr4−/−) or non-hematopoietic cells (Tlr4−/− ⇒ WT) and respective control mice (WT ⇒ WT and Tlr4−/− ⇒ Tlr4−/−). Mice were treated as described earlier, and IL-6 levels in plasma and BM lysates were measured by ELISA (Figure 5C). Although LPS sensing by both hematopoietic and non-hematopoietic cells contributes equally to local BM IL-6 levels after a single high-dose LPS injection (Figure 5D, right panel), systemic IL-6 levels largely depend on Tlr4 expression by non-hematopoietic cells irrespective of the duration of LPS treatment (Figure 5D, right panel; Figure 5F, left panel). Strikingly, however, upon chronic repetitive LPS stimulation, local BM IL-6 levels are maintained exclusively by non-hematopoietic cells (Figure 5F, right panel). We next generated 2 separate transgenic mouse models with specific Tlr4 or Myd88 deficiency in Lepr-expressing cells (ie, LeprCre;Tlr4fl/fl and LeprCre;Myd88fl/fl mice). Upon chronic repetitive LPS administration (Figure 5E), no significant difference was observed between IL-6 plasma or BM lysate levels between LeprCre;Tlr4fl/fl or LeprCre;Myd88fl/fl mice vs control mice (Figure 5G-H). Collectively, these data indicate that although CAR cells are the primary source of IL-6 upon chronic repetitive LPS stimulation, they are, however, not essential for LPS sensing.
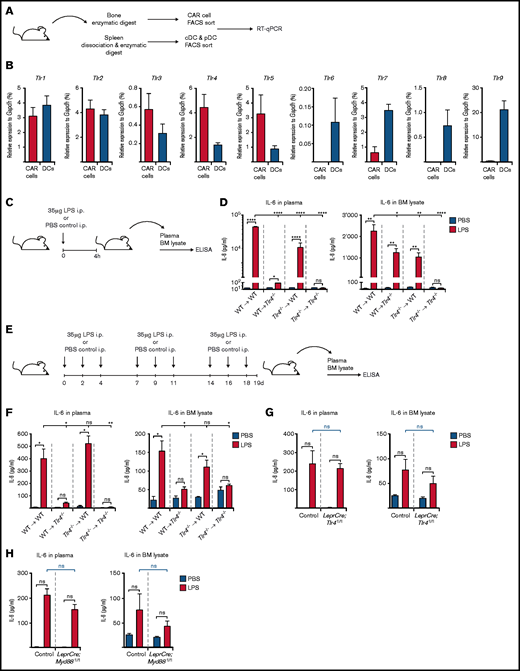
TLR gene expression by CAR cells and IL-6 levels in reciprocal Tlr4−/− mice upon chronic repetitive LPS treatment. (A) Experimental outline depicting isolation of CAR cells from BM as well as conventional dendritic cells (cDCs; CD3e–CD19–NK1.1–CD11chighCD45RA–MHCII+) and plasmacytoid dendritic cells (pDCs; CD3e–CD19–NK1.1–CD11c+CD45RA+MHCIIhigh) from spleen of steady-state WT mice for the assessment of Tlr expression as shown in panel B. (B) Tlr1-9 expression as assessed by qRT-PCR in CAR cells (red bars) and DCs (pooled cDCs and pDCs; blue bars) isolated from steady-state WT mice. Expression values were normalized to the housekeeping gene Gapdh. (C) Experimental scheme showing induction of LPS-induced inflammation by a single LPS injection. This schedule is applicable to experimental data depicted in panel D. (D) IL-6 plasma and BM lysate levels in Tlr4−/− BM reciprocal chimeric mice upon a LPS-induced inflammation (red bars) compared with PBS-injected control mice (blue bars). (E) Graphical scheme depicting experimental outline for chronic repetitive LPS-induced inflammation. This schedule is applicable to experimental data depicted in panel F. (F) IL-6 plasma and BM lysate levels in Tlr4−/− BM reciprocal chimeric mice upon a LPS-induced inflammation (red bars) compared with PBS-injected control mice (blue bars). (G) IL-6 plasma and BM lysate levels in LeprCre;Tlr4fl/fl mice upon a LPS-induced inflammation (red bars) compared with PBS-injected control mice (blue bars). (H) IL-6 plasma and BM lysate levels in LeprCre;Myd88fl/fl mice upon LPS-induced inflammation (red bars) compared with PBS-injected control mice (blue bars). *P < .05, **P < .01, ***P < .001, ****P < .0001. i.p., intraperitoneal; ns, nonsignificant.
TLR gene expression by CAR cells and IL-6 levels in reciprocal Tlr4−/− mice upon chronic repetitive LPS treatment. (A) Experimental outline depicting isolation of CAR cells from BM as well as conventional dendritic cells (cDCs; CD3e–CD19–NK1.1–CD11chighCD45RA–MHCII+) and plasmacytoid dendritic cells (pDCs; CD3e–CD19–NK1.1–CD11c+CD45RA+MHCIIhigh) from spleen of steady-state WT mice for the assessment of Tlr expression as shown in panel B. (B) Tlr1-9 expression as assessed by qRT-PCR in CAR cells (red bars) and DCs (pooled cDCs and pDCs; blue bars) isolated from steady-state WT mice. Expression values were normalized to the housekeeping gene Gapdh. (C) Experimental scheme showing induction of LPS-induced inflammation by a single LPS injection. This schedule is applicable to experimental data depicted in panel D. (D) IL-6 plasma and BM lysate levels in Tlr4−/− BM reciprocal chimeric mice upon a LPS-induced inflammation (red bars) compared with PBS-injected control mice (blue bars). (E) Graphical scheme depicting experimental outline for chronic repetitive LPS-induced inflammation. This schedule is applicable to experimental data depicted in panel F. (F) IL-6 plasma and BM lysate levels in Tlr4−/− BM reciprocal chimeric mice upon a LPS-induced inflammation (red bars) compared with PBS-injected control mice (blue bars). (G) IL-6 plasma and BM lysate levels in LeprCre;Tlr4fl/fl mice upon a LPS-induced inflammation (red bars) compared with PBS-injected control mice (blue bars). (H) IL-6 plasma and BM lysate levels in LeprCre;Myd88fl/fl mice upon LPS-induced inflammation (red bars) compared with PBS-injected control mice (blue bars). *P < .05, **P < .01, ***P < .001, ****P < .0001. i.p., intraperitoneal; ns, nonsignificant.
IL-6 deficiency in CAR cells does not have a lasting impact on HSPC functionality after LPS-induced chronic repetitive inflammation
Given that CAR cell–derived IL-6 is required to sustain adequate numbers of immunophenotypically defined HSPCs (Figure 3C-F) and myeloid CFUs (Figure 4B-C,F) upon chronic repetitive LPS stimulation, we tested whether this translates into a lasting hematopoietic defect even after cessation of the chronic inflammatory stimuli. To this end, we isolated whole BM from LPS-stimulated LeprCre;Il6fl/fl and control mice and conducted competitive transplantation assays in lethally irradiated WT recipients (Figure 6A). Although there was an overall trend toward lower engraftment of LPS-stimulated HSPCs isolated from either LeprCre;Il6fl/fl or control mice, this difference only reached statistical significance at the early 4-week posttransplant time point. Importantly, no significant differences in engraftment levels were observed between LPS-stimulated LeprCre;Il6fl/fl and control mice (Figure 6B). Taken together, these findings show that although IL-6 deficiency in CAR cells results in fewer numbers of HSPCs and myeloid CFUs, this hematopoietic defect is only transient and does not have a lasting negative impact on HSPC functionality.

Competitive transplantation assay performed on whole BM (WBM) isolated from LPS-stimulated LeprCre;Il6fl/fl and control mice. (A) Experimental scheme depicting specifics of the competitive transplantations assay. (B) Results of the competitive transplantation assay performed according to the scheme depicted in panel A. Results indicate peripheral blood chimerism at weeks 4, 8, 12, and 16 as determined by the percentage of CD45.2+ donor cells. Blue dots indicate WT recipient mice given WBM from PBS-treated donor mice, and red dots indicate WT recipient mice given WBM from LPS-treated donor mice. *P < .05, **P < .01. i.p., intraperitoneal; ns, nonsignificant; PB, peripheral blood.
Competitive transplantation assay performed on whole BM (WBM) isolated from LPS-stimulated LeprCre;Il6fl/fl and control mice. (A) Experimental scheme depicting specifics of the competitive transplantations assay. (B) Results of the competitive transplantation assay performed according to the scheme depicted in panel A. Results indicate peripheral blood chimerism at weeks 4, 8, 12, and 16 as determined by the percentage of CD45.2+ donor cells. Blue dots indicate WT recipient mice given WBM from PBS-treated donor mice, and red dots indicate WT recipient mice given WBM from LPS-treated donor mice. *P < .05, **P < .01. i.p., intraperitoneal; ns, nonsignificant; PB, peripheral blood.
Discussion
Our goal was to acquire deeper insight into how the non-hematopoietic BM microenvironment may be involved in regulating inflammation-driven hematopoiesis by provision of hematopoietic growth factors and inflammatory cytokines. We identified IL-6 to be predominantly secreted by CAR cells during LPS-induced inflammation. These results may seem surprising given the prevailing notion that inflammatory cytokines are mostly secreted from bona fide immune cells (eg, macrophages and T cells). However, both hematopoietic as well as non-hematopoietic cell types are capable of constitutive and inducible production of hematopoietic cytokines.35–38 Importantly, the in vivo contribution of various cell types to cytokine availability under specific inflammatory settings remains to be determined.
A caveat might be the assumed low frequency of non-hematopoietic BM cells, including CAR cells in mouse BM,39–41 and that such a scarce cell population could hardly account for systemically measurable IL-6 levels. However, it must be noted that FACS-based quantification of non-hematopoietic BM cell numbers massively underestimates the actual frequency and number of these cells in mouse BM compared with more sophisticated imaging technologies.42 Consequently, CAR cells are a much more abundant cell population than previously believed, underscoring their importance as a major source of IL-6 during LPS-induced inflammation.
Testing the functional hematopoietic consequences of IL-6 revealed that it is dispensable for the immediate hematopoietic response to LPS-induced inflammation, which is in line with our published data showing that emergency granulopoiesis is mainly driven by endothelial cell–produced G-CSF.24–27 In contrast, upon chronic-repetitive LPS stimulation, Il6−/− and LeprCre;Il6fl/fl mice developed BM hypocellularity compared with IL-6–competent mice. Furthermore, FACS analyses revealed a moderate but highly significant impairment in the ability to increase absolute numbers of immunophenotypically defined HPSCs in Il6−/− and LeprCre;Il6fl/fl mice upon chronic repetitive LPS stimulation. Moreover, an IL-6 deficiency led to a severe quantitative deficit in myeloid-specific progenitors (GMPs) and downstream granulocytic cells (CD11b+Gr1low/high). Importantly, these quantitative phenotypes were paralleled by a severe functional defect in generating CFUs from the BM of LPS-treated Il6−/− and LeprCre;Il6fl/fl mice. However, competitive transplantation experiments also showed that an IL-6 deficiency in CAR cells does not generate a sustained functional defect in HSPCs after the chronic repetitive inflammatory stimulus has ceased.
How do these results compare with published functions of IL-6? IL-6 is a pleiotropic cytokine with highly context-dependent functions, regulating a plethora of fundamental biological processes, including immune system homeostasis, inflammation, tissue repair, and metabolism. Its dysregulation critically contributes to a variety of human diseases, and it therefore represents an attractive therapeutic target (extensively reviewed elsewhere43 ).
Although it has been known for >20 years that IL-6 promotes hematopoiesis,44 two papers have reported on the role of IL-6 during inflammation-induced emergency hematopoiesis.27,45 Zhao et al45 found that HSPCs are capable of sensing TLR agonists, leading to the secretion of inflammatory cytokines, including IL-6; this, in turn, stimulated enhanced HSPC proliferation and myeloid differentiation in an autocrine/paracrine manner under very specific experimental conditions of severe leukopenia after BM transplantation. Of note, our results presented here unambiguously indicate that hematopoietic cell–derived IL-6 is dispensable for hematopoiesis during chronic repetitive LPS stimulation but clearly show that CAR cells are the major source of IL-6. The discrepancy between the study by Zhao et al and our findings can be reconciled by the different experimental approaches reflecting fundamentally different clinical settings. The findings by Zhao et al suggest that HSPC-derived IL-6 may compensate for growth factor deficiencies during the initial phase of hematopoietic recovery following myeloablative hematopoietic stem cell transplantation when the BM microenvironment is dysfunctional due to the conditioning regimen. However, our results obtained from a setting of chronic infection/inflammation that resembles naturally occurring conditions unequivocally show that the relative contribution of hematopoietic cells, including HSPCs, to IL-6 levels is negligible but depends primarily on non-hematopoietic CAR cells, at least in the setting of chronic repetitive inflammation.
Furthermore, Schuerch et al31 recently reported that, during viral infection, cytotoxic T cell–derived interferon-γ stimulates IL-6 release from an MSC population that largely represents PαS cells,29 which, in turn, promotes monopoiesis. Notably, PαS cells are biologically distinct from CAR cells, and thus are viral and gram-negative bacterial infections. Our results in conjunction with the findings by Schuerch et al31 therefore emphasize the versatility, flexibility, and context-dependency of growth factor provision by the BM microenvironment and should stimulate further research in this area.
We also addressed the question as to whether CAR cell–derived IL-6 acts directly or indirectly on HSPCs, thereby sustaining hematopoiesis during chronic repetitive inflammation. We detected expression of the IL-6R subunits CD126 and CD130 at varying levels in HSPCs (except for IL-6 receptor–negative megakaryocyte-erythrocyte progenitors) and more differentiated myeloid cell populations, which renders these cell populations responsive to IL-6. Moreover, serial-replating CFU assays showed the direct action of IL-6 on HSPCs. Interestingly, the relatively low IL-6R subunit expression on LT-HSCs might explain the lack of a discernable functional defect of HSPCs after cessation of the chronic inflammatory stimuli, as revealed by competitive transplantation assays.
Finally, we set out to address the question as to whether CAR cells are directly sensing LPS followed by IL-6 secretion or whether LPS sensing is accomplished in another cell type that, in turn, delivers an intermediate signal to CAR cells leading to IL-6 secretion. High expression of Tlr4, the cognate receptor for LPS, can be found in hematopoietic as well as in all assessed non-hematopoietic BM cell types, including CAR cells. Using reciprocal BM Tlr4−/− chimeric mice, we found that during chronic repetitive LPS stimulation, systemic and local BM IL-6 levels depend on Tlr4 expression by non-hematopoietic cells. However, specific deletion of Tlr4 or Myd88 in CAR cells by virtue of LeprCre mice clearly shows that LPS sensing does not strictly depend on CAR cells themselves. Future studies must clarify whether CAR cells either do not participate in LPS sensing at all, or whether another TLR4-expressing non-hematopoietic cell type compensates this functional requirement in the absence of TLR4/Myd88 signaling in CAR cells via an intermediate signal that induces IL-6 production in CAR cells.
In summary, using gene expression analyses in prospectively isolated non-hematopoietic BM cell populations in combination with several mouse models, we found that CAR cells are the primary source of systemic and local BM IL-6 after LPS stimulation. Most importantly, although IL-6 is dispensable during the initial phase of LPS-induced emergency hematopoiesis, it is essential to sustain hematopoiesis during chronic repetitive inflammation. Our findings highlight the key role of the BM microenvironment as a central hub and active participant in innate immune responses, as well as a critical regulator of demand-adapted hematopoiesis by virtue of its ability to sense systemically disseminated pathogens followed by allocation of essential hematopoietic growth factors during infection and inflammation.
Acknowledgments
This work was supported by research grants from the Swiss National Science Foundation (310030B_166673/1), the Promedica Foundation, and the Clinical Research Priority Program of the University of Zurich to M.G.M, grants from the Ministerio de Economía y Competitividad (SAF2014-56546-R) and Fondo Europeo de Desarrollo Regional (RTI2018-101105-B-I00) to J.H., as well as fellowships by the Swiss Cancer League (KLS-3625-02-2015), and the Swiss National Science Foundation (P300PB_161026/1) to S.B.
Authorship
Contribution: R.C.G. and S.B. devised, performed and analyzed experiments, and wrote the manuscript; L.V.K. and A.H. performed experiments; J.H, C.N.-A., and W.-D.H. devised experiments and discussed data; and M.G.M. directed the study and wrote the manuscript.
Conflict-of-interest disclosure: The authors declare no competing financial interests.
Correspondence: Markus G. Manz, Department of Medical Oncology and Hematology, University of Zurich and University Hospital Zurich, Raemistrasse 100, CH-8091 Zurich, Switzerland; e-mail: markus.manz@usz.ch.

