

Key Points
RUNX1-independent mechanisms exist for the generation of HSCs and the development of functional definitive hematopoietic cells.
GATA2 and RUNX1 functionally complement each other for their respective roles during hematopoiesis.

Abstract
RUNX1 is essential for the generation of hematopoietic stem cells (HSCs). Runx1-null mouse embryos lack definitive hematopoiesis and die in mid-gestation. However, although zebrafish embryos with a runx1 W84X mutation have defects in early definitive hematopoiesis, some runx1W84X/W84X embryos can develop to fertile adults with blood cells of multilineages, raising the possibility that HSCs can emerge without RUNX1. Here, using 3 new zebrafish runx1−/− lines, we uncovered the compensatory mechanism for runx1-independent hematopoiesis. We show that, in the absence of a functional runx1, a cd41-green fluorescent protein (GFP)+ population of hematopoietic precursors still emerge from the hemogenic endothelium and can colonize the hematopoietic tissues of the mutant embryos. Single-cell RNA sequencing of the cd41-GFP+ cells identified a set of runx1−/−-specific signature genes during hematopoiesis. Significantly, gata2b, which normally acts upstream of runx1 for the generation of HSCs, was increased in the cd41-GFP+ cells in runx1−/− embryos. Interestingly, genetic inactivation of both gata2b and its paralog gata2a did not affect hematopoiesis. However, knocking out runx1 and any 3 of the 4 alleles of gata2a and gata2b abolished definitive hematopoiesis. Gata2 expression was also upregulated in hematopoietic cells in Runx1−/− mice, suggesting the compensatory mechanism is conserved. Our findings indicate that RUNX1 and GATA2 serve redundant roles for HSC production, acting as each other’s safeguard.
Introduction
The emergence and maintenance of hematopoietic stem cells (HSCs) is regulated by several transcription factors including RUNX1 and GATA2.1-8 Gata2 is expressed in all functional HSCs and most hematopoietic progenitor cells.9 Mouse Gata2−/− embryos are defective in definitive hematopoiesis and die at E10.5.6 Moreover, Gata2 is required for the generation of HSCs during the stage of endothelial to hematopoietic cell transition in the aorta gonad mesonephric region (AGM).8 GATA2 is also frequently involved in human leukemia, and germline mutations in GATA2 are associated with an autosomal dominant disease with recurrent infections, myelodysplastic syndrome, and predisposition to leukemia.10
Runx1−/− mice lack all definitive blood lineages and die in midgestation.2 Runx1 is also required for HSC formation during embryo development.11 Recent studies have shown that HSC precursors form but do not further develop into HSCs in Runx1-deficient mice.12 Our group previously generated a zebrafish line with a truncation mutation in runx1 (runx1W84X/W84X).13,14 Similar to Runx1−/− mice, runx1W84X/W84X embryos failed to develop definitive hematopoiesis. Surprisingly, 20% of the runx1W84X/W84X larvae could recover definitive hematopoiesis and survive to adult.14 These findings suggested that HSCs could form without RUNX1 in the zebrafish. However, given the nature of the W84X mutation and the fact that runx1W84X messenger RNA (mRNA) was still expressed in the runx1W84X/W84X fish, we could not exclude the possibility of functional RUNX1 protein production through a stop-codon readthrough mechanism during translation.
We believe that elucidating the mechanism of this RUNX1-independent hematopoiesis has far-reaching implications in developing therapeutics for acute myeloid leukemia with germline or somatic mutations in RUNX1. Therefore, we generated 3 new runx1−/− lines to uncover the mechanism of this RUNX1-independent production of HSCs. We detected cd41:green fluorescent protein (GFP)+ HSCs/hematopoietic stem and progenitor cells (HSPCs) in the runx1−/− embryos and characterized their expression profile by single-cell RNA sequencing (scRNA-seq). Interestingly, our analysis identified gata2b as 1 of the signature genes of runx1-independent HSC/HSPCs. We generated new gata2b and gata2a mutant lines and crossed them to the runx1−/− lines to probe the interplay between RUNX1 and GATA2. Our findings suggest that RUNX1 and GATA2 act redundantly to support the formation and maintenance of HSCs and a functional hematopoietic system.
Methods
Zebrafish lines and maintenance
All zebrafish experiments were performed in compliance with National Institutes of Health guidelines for animal handling and research. Zebrafish handling and breeding were performed as described previously.15 The following zebrafish strains were used: wild-type zebrafish strain EK (Ekkwill) and TAB5, Tg(gata1:dsRed),16 Tg(cd41:GFP),17 and Tg(kdrl:mCherry).18 All animals and procedures used in this study were approved by the National Human Genome Research Institute Animal Care and Use Committee.
runx1, gata2a, and gata2b mutant generation and genotyping
Zebrafish mutants were generated with transcription activator-like effector nucleases (TALENS; runx1 del8 and runx1 del25) or clustered regularly interspaced short palindromic repeats (CRISPR)/Cas9 (runx1 del[e3-8], gata2a, and gata2b mutants). The TALEN and sgRNA sequences, target exons, and genotyping primer sequences for all mutations are described in supplemental Table 1 and in the supplemental Methods.
Kidney RNA extraction and RNA sequencing
Kidneys were dissected from approximately 2.5-month-old fish. See supplemental Methods for detailed dissociation protocol. RNA sequencing was performed on the HiSeq 2500 (Illumina) using paired-end library preparation (TruSeq RNA Library Prep Kit v2) at the National Institutes of Health Intramural Sequencing Center. Low-quality sequencing reads were removed with in-house script. RNA-Seq reads were aligned to the zebrafish genome reference (GRCz11) and transcript reference (GRCz11.99) using hisat2 (v2.2.1.0)19 on National Institutes of Health high performance computing (HPC) Biowulf cluster (http://hpc.nih.gov). We used htseq-count (v0.11.4)20 to generate gene expression estimates. DESeq221 (version 3.4.2, http://www.r-project.org/) was used for differential gene expression analysis. Gene ontology enrichment analysis was performed using Metascape (http://metascape.org).21 Raw data have been deposited to GEO (GSE158098 and GSE169689).
Fluorescence-activated cell sorting and single-cell capture and sequencing with 10× Genomics chromium
Wild-type and runx1del8/del8 embryos were collected at 2.5, 6, 10, and 16 day postfertilization (dpf), and GFP+ cells were sorted on a fluorescence-activated cell sorter (FACS) AriaIII (Becton Dickinson, Franklin Lakes, NJ). GFPlow cells were loaded on a chromium instrument (10× Genomics, Pleasanton, CA) to generate single-cell gel beads in emulsion (GEMs). Single-cell RNA-seq libraries were prepared using chromium single-cell 3′ Library & Gel Bead Kit v3 (P/N1000075; 10× Genomics). The barcode sequencing libraries were sequenced on Illumina HiSeq2500/HiSeq3000.
Data processing, clustering, and trajectory analysis
Sequences from the chromium platform were demultiplexed and aligned using CellRanger v2.0.2 from 10× Genomics using zebrafish reference genome (GRCz10) and transcript annotation reference (GRCz10.87). Clustering, filtering, variable gene selection, and dimensionality reduction were performed using the Seurat v3.1.4.22,23 Raw data matrices of 2 or more Seurat objects were merged to generate a new Seurat object with the resulting combined raw data matrix. The cell identities of the clusters were reassigned based on the expression of well-established hematopoietic markers that were identified by our unbiased analysis as cluster signature genes. The expression of signature markers that identify different cell identities is presented, for each time point, in heatmaps and feature maps (see Figures 3 and 4; supplemental Figures 2-4).
We applied single-cell trajectories reconstruction, exploration and mapping (STREAM, version 1.0)24 software with single-cell gene expression matrix exported from Seurat to reconstruct the trajectories of different cell types. Different correlation metrics were used to calculate the ranks of cells, which reflect the cell position over the pseudotime axis. scRNA-seq data have been deposited in GEO (GSE158099). More details about data processing, clustering, and trajectory analysis can be found in the supplemental Methods.
Mouse cell preparation and RNA sequencing
All mice and procedures used in this study were approved by the National Human Genome Research Institute Animal Care and Use Committee. Runx1 conditional knockout (Runx1f/f),25 Mx1-Cre,26 and β-actin-Cre recombinase transgenic (Actb-Cre+)27 mice have been described previously. RNA sequencing was performed on mRNA isolated from c-Kit+ bone marrow cells of mice.28 Quantitative polymerase chain reaction was performed on mRNA extracted from whole aorta-gonad-mesonephros (AGM) of E10.5 embryos. Details on the procedures and data analysis are provided in the supplemental Methods. Sequencing data have been deposited at GEO (GSE158100).
Results
Demonstration of RUNX1-independent hematopoiesis in 3 new runx1 mutant lines
To investigate whether RUNX1-independent emergence of HSCs exists, we generated 3 new runx1−/− lines (Figure 1A; supplemental Figure 1A-D). Using TALENs, we obtained zebrafish lines with an 8-bp deletion and a 25-bp deletion (runx1del8 and runx1del25) within exon 4 of runx1 (Figure 1A; supplemental Figure 1A; supplemental Table 1). These mutations are predicted to cause frameshifts and premature terminations within the runt-homology domain (RHD), resulting in loss of function (supplemental Figure 1B; supplemental Table 2). Because runx1 mRNA was still detectable in runx1del8/del8 and runx1del25/del25 embryos (supplemental Figure 1C), we used 2 CRISPR-guide RNAs (supplemental Table 1), targeting exon 3 (encoding RHD) and exon 8 (the last coding exon of runx1), respectively, to establish a mutant line carrying an exon 3 to 8 deletion (runx1del(e3-8)/del(e3-8); Figure 1A; supplemental Figure 1A-B,D; supplemental Table 2), in which runx1 full-length transcript was not detectable (supplemental Figure 1C-D).
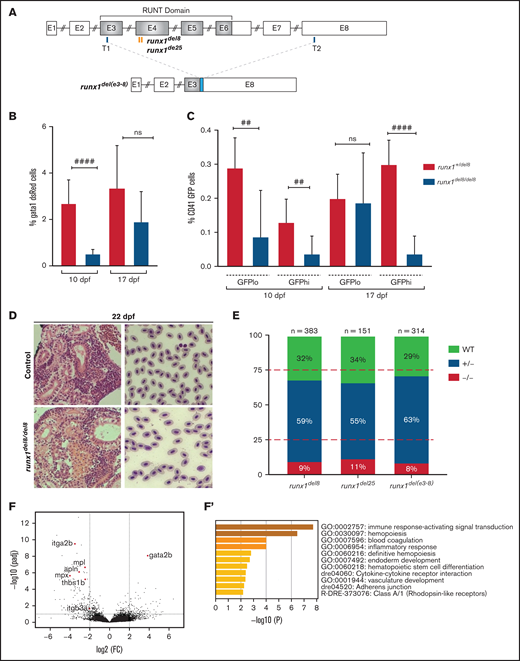
runx1−un mutants survive to adult and recover multilineage hematopoiesis. (A) Schematic representation of the runx1 gene showing the regions (orange bars) targeted with engineered TALENs that generated the runx1del8, runx1del25 mutant lines and the CRISPR targets, T1 and T2 (blue bars), used to generate the runx1del(e3-8) mutant line as shown in the lower panel. The cyan box in the lower panel indicates a 66-bp insertion between the 2 cut sites. Percentage of gata1:dsRed+ (B) and cd41:GFPlow or cd41:GFPhigh (C) in Tg(gata1:dsRed; cd41:GFP) runx1del8/del8 runx1+/del8 controls at 10 and 17 dpf analyzed by flow cytometry (##P < .01, ####P < .0001). (D) Kidney histology and blood smear of a representative 22 dpf runx1del8/del8 appear similar to a runx1+/del8 control sibling. (E) Stacked bar chart showing the percentage of adult runx1del/del8, runx1del2/del25, and runx1del(e3-8)/del(e3-8) recovered from inbred heterozygous parents; red dashed lines indicate the expected Mendelian ratio. (F) Volcano plot showing the differentially expressed genes in the kidneys between adult runx1−un and wild-type zebrafish. The red dots identify known hematopoietic markers for thrombocytes, myeloid cells, and HSCs that are differentially expressed at FC > 2 and Padj < .05. (F′) Gene ontology enrichment analysis results for panel F.
runx1−un mutants survive to adult and recover multilineage hematopoiesis. (A) Schematic representation of the runx1 gene showing the regions (orange bars) targeted with engineered TALENs that generated the runx1del8, runx1del25 mutant lines and the CRISPR targets, T1 and T2 (blue bars), used to generate the runx1del(e3-8) mutant line as shown in the lower panel. The cyan box in the lower panel indicates a 66-bp insertion between the 2 cut sites. Percentage of gata1:dsRed+ (B) and cd41:GFPlow or cd41:GFPhigh (C) in Tg(gata1:dsRed; cd41:GFP) runx1del8/del8 runx1+/del8 controls at 10 and 17 dpf analyzed by flow cytometry (##P < .01, ####P < .0001). (D) Kidney histology and blood smear of a representative 22 dpf runx1del8/del8 appear similar to a runx1+/del8 control sibling. (E) Stacked bar chart showing the percentage of adult runx1del/del8, runx1del2/del25, and runx1del(e3-8)/del(e3-8) recovered from inbred heterozygous parents; red dashed lines indicate the expected Mendelian ratio. (F) Volcano plot showing the differentially expressed genes in the kidneys between adult runx1−un and wild-type zebrafish. The red dots identify known hematopoietic markers for thrombocytes, myeloid cells, and HSCs that are differentially expressed at FC > 2 and Padj < .05. (F′) Gene ontology enrichment analysis results for panel F.
Whole-mount in situ hybridization showed lack of expression of all definitive hematopoietic markers (c-myb, mpx, hbae1, rag1) between 3 and 5 dpf in these 3 runx1 mutant lines (supplemental Figure 1E), indicating complete failure of definitive hematopoiesis at this stage. The larvae from all 3 runx1 mutant lines were followed and found to undergo a bloodless phase between 10 and 16 dpf; during this time, some of the runx1 mutant larvae died. Circulating blood cells started to reappear in the remaining runx1 mutant larvae between 16 and 20 dpf, and by 22 dpf, all the surviving runx1 mutant larvae had blood circulation. The hematopoietic defects in these 3 mutant lines were qualitatively and quantitatively similar with each other. For practical reasons, we focused our subsequent studies on the runx1del8 mutant line.
Flow cytometric analysis showed significant reductions of dsRed+ erythrocytes and GFPhigh thrombocytes in the Tg(gata1:dsRed; cd41:GFP) runx1del8/del8 larvae at 10 dpf (Figure 1B-C). Interestingly, the GFPlow HSC/HSPC population was decreased in the mutants but still detectable (Figure 1C). At 17 dpf, when circulating blood cells started to reappear in the runx1del8/del8 larvae, dsRed+ erythrocytes and GFPlow HSC/HSPCs increased correspondingly but not the GFPhigh thrombocytes (Figure 1B-C). At 22 dpf, the kidneys in the runx1del8/del8 larvae were filled with blood progenitors, comparable to the controls and blood smear showed normal erythroid cells (Figure 1D). Eventually, 8% to 11% of the adult fish from runx1+/− incrosses were runx1−/− (Figure 1E). runx1−/− adults had normal size and morphology (supplemental Figure 1F). Overall, our data strongly suggest that in the absence of RUNX1, there is an independent mechanism for HSC formation.
Gene expression changes in adult runx1-null hematopoietic cells
To assess gene expression profile of hematopoietic cells in runx1−/− adults, we performed RNA-seq on dissected kidneys from both runx1del8 and runx1del25 (∼2.5 months old, n = 3 runx1del25, n = 3 wild-type siblings; n = 2 runx1del8 and n = 3 wild-type siblings). Only 140 differentially expressed (DE) genes (107 downregulated and 33 upregulated; Padj < .05, fold change [FC] > 2) were detected between mutant and wild type (Figure 1F; supplemental Table 3). Gene ontology enrichment analysis showed over-representation of genes related to immune response signaling/inflammation and blood coagulation and hematopoiesis (Figure 1F′). Indeed, key thrombocyte genes such as itga2b (cd41), mpl, thbs1b, apln, and itgb3a (cd61)29 were downregulated, indicating defects in thrombopoiesis in runx1−/− fish (Figure 1F). The myeloid markers mpx and lyz were also downregulated, suggesting an impairment of neutrophils. Interestingly, the HSC transcription factor gata2b was upregulated in runx1−/− fish (Figure 1F). Our results suggest that adult hematopoiesis in runx1−/− fish is largely intact and multilineage.
cd41-GFP+ HSC/HSPCs are formed in runx1−/− embryos
Our analysis of Tg(gata1:dsRed; cd41:GFP) runx1del8/del8 embryos showed the presence of cd41:GFPlow HSC/HSPCs at 10 dpf, which were expanded during hematopoietic recovery. To identify where and when runx1-independent hematopoietic precursors might arise, we generated runx1del8/del8;Tg(cd41:GFP);Tg(kdrl:mCherry) embryos. Interestingly, at ∼52 hour postfertilization (hpf), we could detect cd41-GFP+ mCherry+ cells in the AGM of runx1del8/del8 embryos, indicating that these cells were derived from hemogenic endothelium (Figure 2A). Moreover, time-lapse confocal analysis showed that the cd41-GFP+ cells in the runx1del8/del8 embryos retained HSC behavior as they were released from the AGM into the circulation, similar to cd41-GFP+ HSCs in the wild-type embryos (supplemental Movies 1 and 2). At 3 dpf, cd41-GFP+ cells had colonized the caudal hematopoietic tissue (CHT) of the runx1del8/del8 embryos (Figure 2B); however, residual GFP+ cells could be found in the AGM (Figure 2C), suggesting that the emergence/release of the HSPC in runx1−/− was slower than normal. In addition, flow cytometric analysis showed that the number of cd41-GFPlow cells at 2.5 dpf in the runx1del8/del8 was lower than normal (supplemental Figure 2A-B).
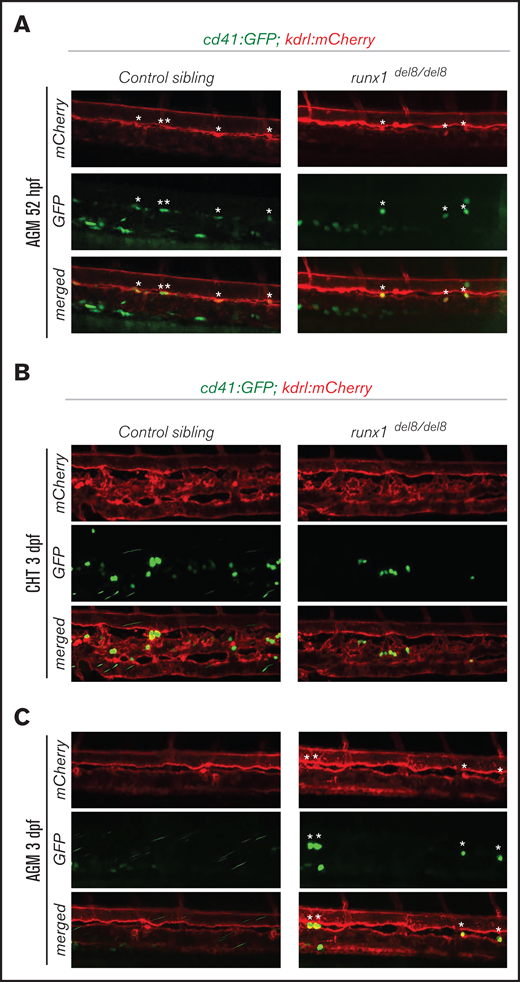
Development of cd41:GFP+ hematopoietic precursors in runx1del8/del8 AGM and CHT. (A) Snapshots of the AGM region of runx1del8/del8 and control sibling Tg(cd41:GFP); Tg(kdrl:mCherry) at 52 hours postfertilization (hpf), obtained from time-lapse recordings on a confocal microscope (supplemental Movies 1 and 2). cd41:GFP+ mCherry+ double-positive cells are indicated with white asterisks. (B-C) Live confocal imaging of the CHT (B) and AGM (C) regions in the Tg(cd41:GFP); (B) Tg(kdrl:mCherry) embryos at 3 dpf. cd41:GFP+ cells are found in the CHT. (C) Residual cd41:GFP+ cells (white asterisks) are still detectable in the AGM of runx1del8/del8.
Development of cd41:GFP+ hematopoietic precursors in runx1del8/del8 AGM and CHT. (A) Snapshots of the AGM region of runx1del8/del8 and control sibling Tg(cd41:GFP); Tg(kdrl:mCherry) at 52 hours postfertilization (hpf), obtained from time-lapse recordings on a confocal microscope (supplemental Movies 1 and 2). cd41:GFP+ mCherry+ double-positive cells are indicated with white asterisks. (B-C) Live confocal imaging of the CHT (B) and AGM (C) regions in the Tg(cd41:GFP); (B) Tg(kdrl:mCherry) embryos at 3 dpf. cd41:GFP+ cells are found in the CHT. (C) Residual cd41:GFP+ cells (white asterisks) are still detectable in the AGM of runx1del8/del8.
The transcriptional profile of wild-type and runx1−/− HSC/HSPCs was analyzed by scRNA-seq on cd41-GFPlow cells at 2.5 dpf (supplemental Figure 2C). Uniform manifold approximation and projection (UMAP) of merged wild-type and runx1del8/del8 cd41-GFPlow cells defined 11 clusters (Figure 3A; supplemental Table 4). Cell identities were assigned to each cluster based on well-established lineage markers identified as clusters signatures (supplemental Table 4). Although the nonhematopoietic clusters were composed of mixed genotypes, the hematopoietic clusters were mainly composed of wild-type cells, indicating a reduction in the hematopoietic cd41-GFPlow cells in runx1−/− (Figure 3A-B). The hematopoietic subpopulations expressed known markers for HSCs/HSPCs, multipotent progenitors, and erythroid and myeloid progenitors, which likely represent erythro-myeloid progenitors generated at earlier stages of development and are known to be cd41:GFP+30 (Figure 3C-D; supplemental Figure 2D).
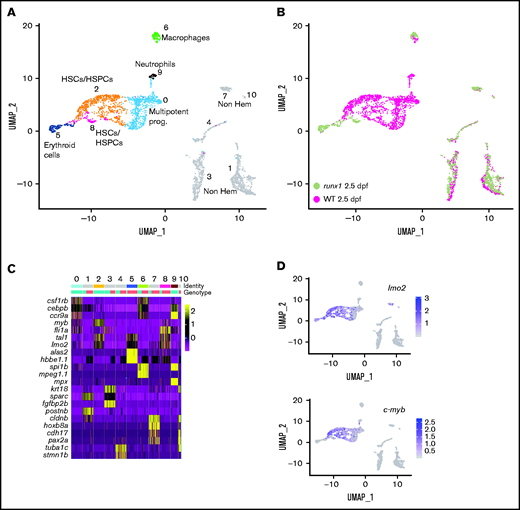
Single-cell gene expression profile of wild-type and runx1del8/de cd41:GFPlow hematopoietic precursors at 2.5 dpf. (A) UMAP of freshly FACS-isolated cd41:GFPlow cells from wild-type and runx1del8/del8 embryos at 2.5 dpf. Colored clusters represent hematopoietic cells; gray clusters are nonhematopoietic (based on expression profile). (B) UMAP depicting the genotypes of the cd41:GFPlow cells. Mint dots, wild type; magenta dots, runx1del8/del8. (C) Heat map depicting the expression of signature genes representative of different cell identities. The horizontal bars on the top correspond to the clusters identified in panel A (Identity) and show the distribution of the 2 genotypes (Genotype) across the clusters. One hundred representative cells per clusters are shown. (D) Feature plots depicting the expression level of the HSC markers c-myb and lmo2 (purple is high, gray is low). See also supplemental Figure 2 for additional scRNA-seq data from 2.5-dpf embryos.
Single-cell gene expression profile of wild-type and runx1del8/de cd41:GFPlow hematopoietic precursors at 2.5 dpf. (A) UMAP of freshly FACS-isolated cd41:GFPlow cells from wild-type and runx1del8/del8 embryos at 2.5 dpf. Colored clusters represent hematopoietic cells; gray clusters are nonhematopoietic (based on expression profile). (B) UMAP depicting the genotypes of the cd41:GFPlow cells. Mint dots, wild type; magenta dots, runx1del8/del8. (C) Heat map depicting the expression of signature genes representative of different cell identities. The horizontal bars on the top correspond to the clusters identified in panel A (Identity) and show the distribution of the 2 genotypes (Genotype) across the clusters. One hundred representative cells per clusters are shown. (D) Feature plots depicting the expression level of the HSC markers c-myb and lmo2 (purple is high, gray is low). See also supplemental Figure 2 for additional scRNA-seq data from 2.5-dpf embryos.
Interestingly, both clusters 2 and 8 expressed HSC/HSPC signature genes such as fli1a, tal1 (also known as scl), c-myb, and lmo2 (Figure 3A,C-D; supplemental Figure 2D). These 2 populations segregated based on their genotype with cluster 2 mainly composed of wild type and cluster 8 mainly runx1del8/del8 (Figure 3A-B). Only 41 DE genes were identified between clusters 2 and 8 (FC > 2, Padj < .001; supplemental Table 4), suggesting that the runx1del8/del8 HSC/HSPC population was not too different from wild type.
runx1−/− HSCs/HSPCs at larval stages had a distinct gene expression profile
To uncover the compensatory mechanism that drive the hematopoietic recovery in runx1−/−, we characterized the expression profile of cd41-GFPlow cells during larval development by scRNA-seq (supplemental Figure 3A-B). UMAPs of merged wild type and runx1−/− at 6 dpf identified multiple hematopoietic subpopulations, highlighting the level of heterogeneity of cd41-GFPlow cells at this stage (Figure 4A; supplemental Table 5). HSCs/HPSCs (clusters 1, 3, and 5) expressing markers such as tal1, lmo2, and c-myb (Figure 4C; supplemental Figure 3C) again segregated based on genotype (cluster 1 wild type; cluster 3 mutant; Figure 4A-C). Cluster 5, again predominantly wild type, was composed of HSCs undergoing cell division as shown by the specific expression of cell cycle markers ccna2 and ccnb1 (Figure 4C). Notably, meis1b, fli1a, and gata2b were among the signature markers for the runx1del8/del8 HSC/HSPCs (Figure 4C; supplemental Figure 3C).
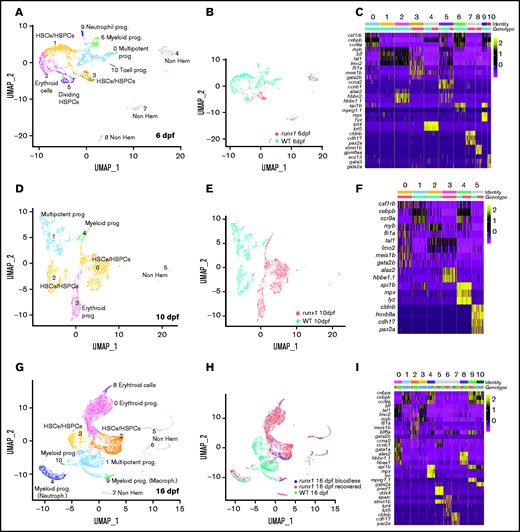
Single-cell analysis of wild-type and runx1del8/del8 cd41:GFPlow at 6, 10, and 16 dpf show only few overlapping populations. UMAP of freshly FACS-isolated cd41:GFPlow cells from wild-type and runx1del8/del8 embryos at 6 (A), 10 (D), and 16 dpf (G). Colored clusters represent hematopoietic cells; gray clusters are nonhematopoietic (based on expression profile). UMAP depicting the genotypes of the cd41:GFPlow cells at 6 (B), 10 (E), and 16 (H). Mint dots, wild type; magenta dots, runx1del8/del8 (B,E). At 16 dpf, mint dots represent wild type; magenta dots, runx1del8/del8 with circulating blood cells (recovered); blue dots, bloodless runx1del8/del8. (C,F,I) Heat maps depicting the expression of signature genes representative of different cell identities in each of the clusters identified, respectively, in panels A, D, and G. The horizontal bars on the top correspond to the clusters identified the correspondent UMAP (Identity) and show the distribution of the 2 genotypes (Genotype) across the clusters. One hundred representative cells per clusters are shown. See also supplemental Figures 3 and 4 for additional scRNA-seq data.
Single-cell analysis of wild-type and runx1del8/del8 cd41:GFPlow at 6, 10, and 16 dpf show only few overlapping populations. UMAP of freshly FACS-isolated cd41:GFPlow cells from wild-type and runx1del8/del8 embryos at 6 (A), 10 (D), and 16 dpf (G). Colored clusters represent hematopoietic cells; gray clusters are nonhematopoietic (based on expression profile). UMAP depicting the genotypes of the cd41:GFPlow cells at 6 (B), 10 (E), and 16 (H). Mint dots, wild type; magenta dots, runx1del8/del8 (B,E). At 16 dpf, mint dots represent wild type; magenta dots, runx1del8/del8 with circulating blood cells (recovered); blue dots, bloodless runx1del8/del8. (C,F,I) Heat maps depicting the expression of signature genes representative of different cell identities in each of the clusters identified, respectively, in panels A, D, and G. The horizontal bars on the top correspond to the clusters identified the correspondent UMAP (Identity) and show the distribution of the 2 genotypes (Genotype) across the clusters. One hundred representative cells per clusters are shown. See also supplemental Figures 3 and 4 for additional scRNA-seq data.
At 10 dpf, wild-type and mutant cd41-GFPlow cells again clustered separately (Figure 4E). For the first time, the runx1del8/del8 cells showed a higher degree of heterogeneity with runx1del8/del8 specific HSC/HSPCs and erythroid progenitors clusters, and 1 myeloid progenitor population shared with wild type (Figure 4D-F; supplemental Figure 3D). At this stage, meis1b, fli1a, and gata2b remained specifically expressed in the runx1del8/del8 HSC/HSPCs (Figure 4F; supplemental Figure 3D; supplemental Table 5).
At 16 dpf, the runx1−/− larvae were separated based on their phenotype: bloodless (without circulating blood cells) and recovered (regained some or nearly normal levels of circulating blood cells). This large dataset of ∼11 000 runx1del8/del8 cells presented 5 hematopoietic populations and showed complete overlap between bloodless and recovered (supplemental Figure 4A-C; supplemental Table 5), suggesting these larvae had the same hematopoietic progression despite the phenotypic difference.
Analysis of a merged dataset containing wild-type and runx1del8/del8 (bloodless and recovered) cd41-GFPlow cells at 16 dpf showed again that most cells clustered based on their genotypes (Figure 4G-I; supplemental Table 5). Importantly, the wild-type and runx1del8/del8 HSC/HSPC clusters were distinct from each other. There were 2 runx1del8/del8-specific erythroid clusters (clusters 0 and 8) expressing different levels of gata1a, urod, hbae1, hbaa1, and alas2 (Figure 4G-I; supplemental Figure 4D). On the other hand, multipotent progenitor cluster (cluster 1) was mostly composed of wild-type cells. Only the myeloid clusters 4 and 10 were shared by wild-type and runx1del8/del8 cells (Figure 4G-I; supplemental Figure 4D). Overall, our data suggest that the HSC population in the runx1del8/del8 larvae, although different from the wild type, could give rise to erythroid and myeloid progenitors, but a multiprogenitor population was not established at this stage.
Comparing the hematopoietic differentiation trajectories in runx1del8/del8 and wild-type larvae
With the aim to reconstruct the progression of the hematopoietic recovery in the runx1del8/del8 larvae, we merged scRNA-seq datasets from 6, 10, and 16 dpf based on genotype (supplemental Figure 5A-B,D-E; supplemental Table 6) and performed trajectory analysis (STREAM24 ).
The unbiased trajectory reconstruction of wild-type cd41 GFPlow cells (11 683 cells) identified 8 different branches (Figure 5A; supplemental Figure 5C). The HSC/HSPCs were split in 3 arms (arms S2-S0, S2-S4, S2-S5; Figure 5A-B; supplemental Figure 5C). Arm S2-S0 was composed largely by HSCs/HSPCs at 10 and 16 dpf; S2-S4 was populated by HSCs/HSPCs from 10 dpf differentiating into erythroid progenitors expressing gata1, alas2, and embryonic globins (eg, hbbe1; Figure 5A-B; supplemental Figure 5C,G). Arm S2-S5 cells were exclusive of 16 dpf (Figure 5A-B) and expressed adult globin hbaa1, suggesting these cells were responsible for the switch from embryonic to adult erythropoiesis31 (Figure 5A-B; supplemental Figure 5C,G). Cells in the S0-S1 branch were derived from cd41-GFPlow at 6 dpf and expressed embryonic erythroid markers (Figure 5A-B; supplemental Figure 5C,G). The remaining branch of HSPCs (S0-S3) differentiates toward myeloid progenitors with macrophage signatures (S3-S7), neutrophils (S3-S8), and B/T progenitor cells (S3-S6; Figure 5A-B; supplemental Figure 5C,G).
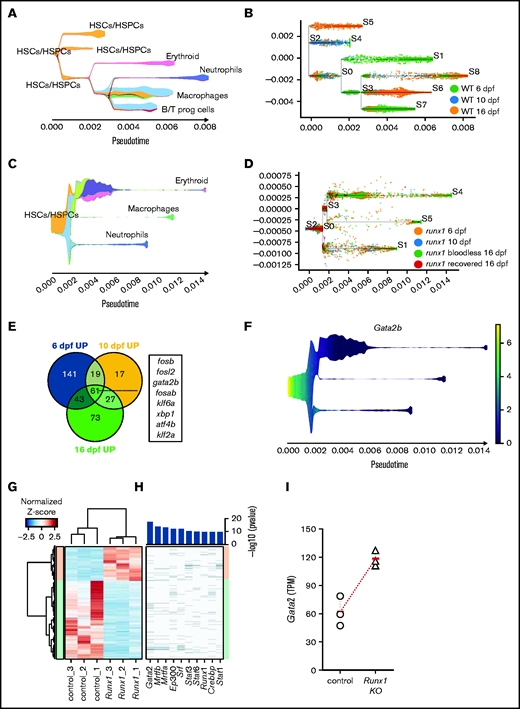
Gata2 is upregulated in the HSPCs of Runx1 zebrafish and mice knockouts. (A) Stream plot representing the pseudotime trajectory projection of wild-type cd41:GFPlow cells at 6, 10, and 16 dpf and their different identities. (B) Subway map depicting the distribution of wild-type cd41:GFPlow cells from different time points to the different branches. (C) Stream plot representing the pseudotime trajectory projection of runx1del8/del8 cd41:GFPlow cells at 6, 10, and 16 dpf and their different identities. (D) Subway map illustrating the contribution of runx1del8/del8 cd41:GFPlow at different time points to the different branches. (E) Venn diagram representing the number of upregulated genes in runx1del8/del8 HSC/HSPCs vs wild-type at 6, 10, and 16 dpf (Padj < .05, FC > 1.5). Sixty-one genes were commonly upregulated, of which 8 were transcription factors (listed). (F) Stream plot depicting the expression of gata2b in the runx1del8/del8 larval cd41-GFPlow pseudotime development (from panels C and D). See supplemental Figure 5 for additional analyses of hematopoietic differentiation trajectories in runx1del8/del8 and wild-type larvae at 6, 10, and 16 dpf. (G) Unsupervised hierarchical clustering of wild-type and Runx1−un RNAseq samples and heat map depicting the differentially expressed genes between wild-type and Runx1−un c-Kit+ HSPCs (940 downregulated and 414 upregulated in the Runx1−un; Padj < .05, FC > 2). (H) Top transcription factors enriched for regulating the differentially expressed genes. The x axis of the heatmap lists the transcription factors, and the y axis shows the DE genes sorted in the same order of the y axis in panel B. Bar plot on the top showed the enrichment P values for each transcription factor. (I) Gata2 expression in c-kit+ bone marrow cells in control and Runx1−/− mice, measured by RNA-seq. Round and triangle points mark transcripts per kilobase million values of each mouse in control and Runx1−/− mice, respectively. Red ticks mark the average transcripts per kilobase million value. See supplemental Figure 6 for additional data on Gata2 expression in Runx1 conditional knockout mice.
Gata2 is upregulated in the HSPCs of Runx1 zebrafish and mice knockouts. (A) Stream plot representing the pseudotime trajectory projection of wild-type cd41:GFPlow cells at 6, 10, and 16 dpf and their different identities. (B) Subway map depicting the distribution of wild-type cd41:GFPlow cells from different time points to the different branches. (C) Stream plot representing the pseudotime trajectory projection of runx1del8/del8 cd41:GFPlow cells at 6, 10, and 16 dpf and their different identities. (D) Subway map illustrating the contribution of runx1del8/del8 cd41:GFPlow at different time points to the different branches. (E) Venn diagram representing the number of upregulated genes in runx1del8/del8 HSC/HSPCs vs wild-type at 6, 10, and 16 dpf (Padj < .05, FC > 1.5). Sixty-one genes were commonly upregulated, of which 8 were transcription factors (listed). (F) Stream plot depicting the expression of gata2b in the runx1del8/del8 larval cd41-GFPlow pseudotime development (from panels C and D). See supplemental Figure 5 for additional analyses of hematopoietic differentiation trajectories in runx1del8/del8 and wild-type larvae at 6, 10, and 16 dpf. (G) Unsupervised hierarchical clustering of wild-type and Runx1−un RNAseq samples and heat map depicting the differentially expressed genes between wild-type and Runx1−un c-Kit+ HSPCs (940 downregulated and 414 upregulated in the Runx1−un; Padj < .05, FC > 2). (H) Top transcription factors enriched for regulating the differentially expressed genes. The x axis of the heatmap lists the transcription factors, and the y axis shows the DE genes sorted in the same order of the y axis in panel B. Bar plot on the top showed the enrichment P values for each transcription factor. (I) Gata2 expression in c-kit+ bone marrow cells in control and Runx1−/− mice, measured by RNA-seq. Round and triangle points mark transcripts per kilobase million values of each mouse in control and Runx1−/− mice, respectively. Red ticks mark the average transcripts per kilobase million value. See supplemental Figure 6 for additional data on Gata2 expression in Runx1 conditional knockout mice.
The trajectory of runx1del8/cells (16 660 cells) showed a lower number of bifurcations compared with the wild type (Figure 5C-D; supplemental Figure 5F). The runx1del8/del8 cells predominantly populated the most undifferentiated branches: HSCs/HSPCs (S2-S0), HSPCs/multipotent progenitors (S2-S0, S0-S3, S0-S1), and HSPCs, which were undergoing active translation based on gene ontology term analysis (translating HSPCs, S0-S3; Figure 5C-D; supplemental Figure 5F,H; supplemental Table 6). HSPCs/multipotent progenitors and translating HSPCs also populated the erythroid trajectory branch (S3-S4), which includes erythroid progenitors with both embryonic and adult globin signatures (hbbe1, hbbe2, and hbaa1), and the myeloid branches with neutrophils (S0-S1) and macrophages signatures (S0-S5; Figure 5C-D; supplemental Figure 5F,H). Overall, the lower level of complexity and the preponderant distribution of the runx1 cd41-GFPlow cells in the more undifferentiated branches were consistent with delayed hematopoiesis in the runx1del8/del8 larvae.
Gata2 is upregulated in the HSPCs in the Runx1 knockout zebrafish and mice
To gain insight into the compensatory mechanism taking place in runx1−/− HSCs/HSPCs, we considered the upregulated genes in the runx1del8/del8 HSC/HSPCs at 6, 10, and 16 dpf (Figure 5E; supplemental Table 5). We reasoned that another transcription factor was likely responsible for compensation of runx1. Among 61 genes consistently upregulated in runx1del8/del8 HSC/HSPCs (Padj < .05, FC > 1.5), only 8 were transcription factors (Figure 5E). Significantly, in the absence of a functional runx1, gata2b was the only transcription factor that remained persistently upregulated in the HSC population at larval stages and also in the adult kidney (Figures 5E-F and 1F-F′).
We also examined the expression levels of Gata2 in the Runx1 knockout mice to determine whether the interplay between runx1 and gata2 is evolutionarily conserved. Gata2 expression level in the AGM of Runx1 conditional knockout mouse embryos (Runx1f/f, β-actin-Cre) at E10.5 was unchanged (supplemental Figure 6A-C). We then examined the gene expression profiles in c-Kit+ bone marrow HSPCs from adult Runx1 conditional knockout mice (Runx1−/−, Mx1-Cre; supplemental Figure 6D).25,32 We identified a total of 1354 differentially expressed genes (Padj < .05, FC > 2) between Runx1−/− and control c-Kit+ HSPCs (Figure 5G; supplemental Figure 6E; supplemental Table 7), and ingenuity pathway identified GATA2 as the top upstream regulator responsible for the gene expression changes (Figure 5H; supplemental Figure 6F). Moreover, Gata2 expression was increased in the Runx1−/− c-Kit+ HSPCs with a highly significant Padj (9.41E−06; Figure 5I). These findings suggest that the interplay between Runx1 and Gata2 is evolutionarily conserved.
gata2 is required for runx1-independent hematopoiesis
To determine whether gata2b could compensate in the absence of runx1, we generated 2 gata2b mutant lines (supplemental Table 1): a 5-bp insertion and a 7-bp deletion located upstream and within the first zinc-finger domain of GATA2, respectively (Figure 6A; supplemental Figure 7A-B; supplemental Table 2). Surprisingly both gata2b mutants reached adulthood according to Mendelian ratio with no hematopoietic phenotype (supplemental Figure 7C). However, when runx1del8/del8 and gata2bins5/ins5 fish were bred together, runx1del8/del8;gata2bins5/ins5 adults were recovered at lower than expected numbers, suggesting that gata2b is important for the survival of runx1−/− fish (Figure 6B; supplemental Figure 7D). On the other hand, injection of runx1del8/del8;Tg(cd41:GFP) embryos with a published gata2b splicing morpholino, gata2b-MO,33 led to loss of cd41-GFP+ cells in AGM and CHT (n = 26/29; supplemental Figure 7E) and a significant decrease of survival at 1 month after injection (supplemental Figure 7F).
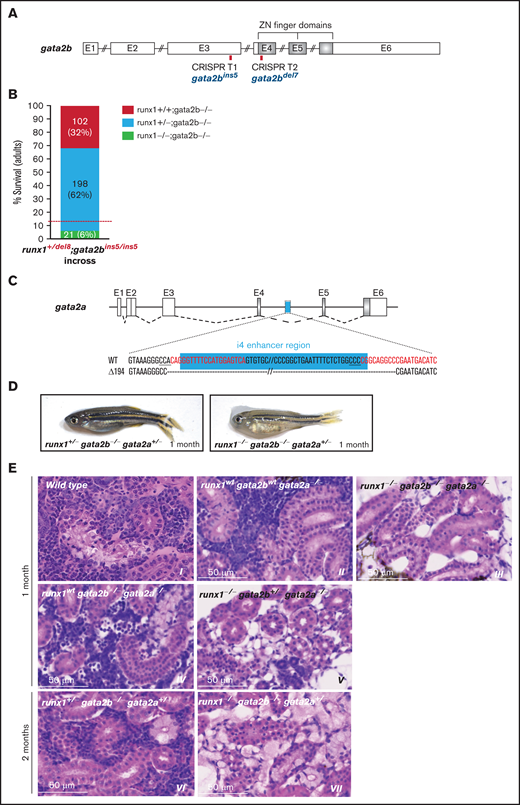
gata2b and gata2a are required for the development of definitive hematopoiesis in runx1 mutants. (A) Schematic representation of the gata2b gene showing the CRISPR targets T1 and T2 (red bars) used to generate the gata2bins5 and the gata2bdel7 mutant lines. (B) Survival of adult runx1del8/gata2bins5 double mutants obtained from the incross of runx1+/del8; gata2bins5/ins5 fish. Red dashed lines indicate the expected ratio of runx1−un recovery based on our previous experimental data (Figure 1E). Each bar segment shows the percentage and number of fish recovered for each genotype. (C) Schematic representation of gata2a genomic structure. The cyan box represents the 150-bp i4 enhancer that was removed using 2 CRISPR guides (red letters). (D) Photographs of representative 1-month-old runx1+/−gata2b−atgata2a+/− and runx1−ungata2b−atgata2a−at fish, with the latter more pale and smaller than the former. (E) Histologic analysis of kidney marrow of triple mutants runx1del8;gata2bins5;gata2ai4del1 at 1 or 2 months. Kidneys from runx1 wild-type and runx1+/− fish (panels II, IV, and VI) are similar to the kidney from the wild-type control (panel I) with marrows populated by blood progenitors. Kidneys from runx1del8/del8 fish with gata2b−atgata2a−at (III), gata2b+/−gata2a−at (V), or gata2b+/−gata2a+/− (VII) completely lack blood progenitors. See supplemental Figure 7 for additional characterizations of the zebrafish gata2b and gata2a mutants.
gata2b and gata2a are required for the development of definitive hematopoiesis in runx1 mutants. (A) Schematic representation of the gata2b gene showing the CRISPR targets T1 and T2 (red bars) used to generate the gata2bins5 and the gata2bdel7 mutant lines. (B) Survival of adult runx1del8/gata2bins5 double mutants obtained from the incross of runx1+/del8; gata2bins5/ins5 fish. Red dashed lines indicate the expected ratio of runx1−un recovery based on our previous experimental data (Figure 1E). Each bar segment shows the percentage and number of fish recovered for each genotype. (C) Schematic representation of gata2a genomic structure. The cyan box represents the 150-bp i4 enhancer that was removed using 2 CRISPR guides (red letters). (D) Photographs of representative 1-month-old runx1+/−gata2b−atgata2a+/− and runx1−ungata2b−atgata2a−at fish, with the latter more pale and smaller than the former. (E) Histologic analysis of kidney marrow of triple mutants runx1del8;gata2bins5;gata2ai4del1 at 1 or 2 months. Kidneys from runx1 wild-type and runx1+/− fish (panels II, IV, and VI) are similar to the kidney from the wild-type control (panel I) with marrows populated by blood progenitors. Kidneys from runx1del8/del8 fish with gata2b−atgata2a−at (III), gata2b+/−gata2a−at (V), or gata2b+/−gata2a+/− (VII) completely lack blood progenitors. See supplemental Figure 7 for additional characterizations of the zebrafish gata2b and gata2a mutants.
The normal survival and the absence of obvious hematopoietic phenotypes in both gata2b mutants raised the possibility of compensation by the paralogous gene, gata2a, which is also expressed in the aortic endothelium.34 Using a published CRISPR pair,34 we deleted the i4 enhancer of gata2a (gata2ai4del194) in runx1;gata2b fish to reduce gata2a expression specifically in the hemogenic endothelium (Figure 6C; supplemental Figure 7G). We assessed the hematopoietic phenotype in the triple mutant line (runx1del8, gata2bins5, and gata2ai4del194). At 15 dpf, the bloodless phenotype was observed only in runx1del8/del8 larvae, irrespective of gata2b and gata2a mutation status (supplemental Figure 7H). However, at 1 to 2 months of age, the only fish that remained bloodless (and smaller than their clutchmates) were runx1 del8/del8 with at least 3 gata2 mutant alleles (gata2b+/−/gata2a−/−, gata2b−/−/gata2a+/−, or gata2b−/−/gata2a−/−; Figure 6D). Moreover, histologic analysis showed that all runx1−/− fish with at least 3 gata2 mutant alleles had no hematopoietic progenitors in their kidneys (Figure 6E). These findings clearly indicated that gata2a and gata2b were required for the hematopoietic recovery in the runx1 nulls. Interestingly, hematopoiesis appeared normal in the kidneys of runx1wt;gata2b−/−;gata2a−/− fish. Although we could not exclude the presence of lineage-specific defects in the absence of GATA2, our data suggest that definitive hematopoiesis could proceed without gata2 (Figure 6E).
Discussion
The 3 new zebrafish runx1−/− lines and the previously reported runx1W84X/W84X failed to initiate definitive hematopoiesis during early embryonic development, but between 30% and 40% of the runx1−/− larvae could regain hematopoiesis and survive to fertile adults. These findings definitely proved the presence of a RUNX1-independent mechanism for HSC production and definitive hematopoiesis. Interestingly, the expression profile of runx1−/− adult kidney cells was relatively normal except for the thrombocyte lineage, which is dependent on RUNX1.14,35,36
We observed cd41:GFPlow cells in the AGM of runx1−/− embryos at 2.5 dpf, which were derived from hemogenic endothelium and possessed HSC-like gene expression profile. cd41:GFPlow HSC/HSPCs were later expanded in the kidney of runx1−/− larvae during the visible recovery of circulating blood cells. Therefore, we hypothesize that these cd41:GFPlow HSC/HSPCs are responsible for hematopoiesis recovery in runx1−/− larvae.
We characterized the cd41:GFPlow HSC/HSPCs in the runx1−/− larvae by scRNA-seq. At all stages, these cells differed significantly from wild-type cells in levels of heterogeneity and expression profile, with identification of signature genes unique to runx1−/− cd41:GFPlow HSC/HSPCs. In fact, the cd41:GFPlow HSC/HSPCs in the runx1−/− larvae clustered separately from the wild-type HSC/HSPCs at all stages, suggesting that they have a unique aberrant phenotype rather than having a developmental delay or block. Trajectory analysis across 3 larval stages demonstrated that runx1−/− cd41:GFPlow cells were skewed toward earlier stages of development. At 10 and 16 dpf, contributions to the development of the erythroid and myeloid branches could be observed in the runx1del8/del8, probably representing the hematopoietic expansion during the recovery period. runx1del8/del8 larvae appeared to have a large number of cd41:GFPlow erythroid progenitors, although cd41:GFP is not known to be expressed in erythroid cells.17,29,37 We speculate that these erythroid progenitors were recently generated from the GFPlow HSC/HSPCs and therefore still retained GFP expression.
To uncover the mechanism for RUNX1-independent hematopoiesis, we focused our attention on transcription factors differentially upregulated in the runx1−/− HSC/HSPCs. gata2b was the only transcription factor upregulated at all larval stages and in the kidney of runx1−/− adults. Importantly, gata2a was not differentially expressed in the runx1−/− at any time point. GATA2 is required for HSC development and is known to act upstream of RUNX1 in the hemogenic endothelium.8,38,39 Zebrafish contain 2 GATA2 paralogs, gata2a, which is expressed in the whole vasculature including hemogenic endothelium,34 and gata2b, which is specifically expressed in hemogenic endothelium.33 A previous publication showed that, at the onset of definitive hematopoiesis, gata2aΔi4/Δi4 mutants present an initial delay in the induction of hemogenic endothelium but then can progress with a normal hematopoietic development.34
gata2b mutants, on the other hand, present a reduction in HSC at the onset of definitive hematopoiesis and have defects in neutrophil and monocytic differentiation lineages as adults.40
Surprisingly, there were no obvious hematopoietic defects in the adult gata2b−/−;gata2a−/− fish, suggesting GATA2 is not required for hematopoiesis.34 However, recovery of definitive hematopoiesis in runx1−/− fish was completely abolished in the absence of at least 3 of the 4 gata2a/2b alleles. Our results show that GATA2 is responsible for RUNX1-independent hematopoiesis. Moreover, the results suggest that GATA2 and RUNX1 complement each other for their respective roles during hematopoiesis. Although there have been reports that they work synergistically,41 our findings suggest that they can work independently, providing redundant mechanisms for HSC production.
It has been reported that CD41+ pre-HSCs can be found in the ventral dorsal aorta of the Runx1ko mice around E10.5.42 Based on our analyses, Gata2 did not appear to be upregulated in the AGM of the Runx1ko mice. However, Gata2 is upregulated and identified as the top upstream regulator of the differentially expressed genes in the c-Kit+ HSPCs in adult Runx1−/− mice. Therefore, it is possible that a RUNX1-independent hematopoiesis initiates in both zebrafish and mice, but this process is successful only in zebrafish because of its larvae can survive in the absence of blood circulation. Because of this mechanism, several other bloodless mutants in the zebrafish could be partially or completely rescued through compensating mechanisms.43-46
Moreover, RUNX1 and GATA2 may interact with each other for leukemia development. As transcription factors, RUNX1 and GATA2 can interact with each other directly and form DNA-binding complexes.41 RUNX1 and GATA2 binding sites are found on a number of hematopoietic genes, and these 2 transcription factors have been shown to cooperate with other transcription factors to regulate genes considered critical for the balance between quiescence and proliferation of HSCs,41 as well as genes involved in leukemia.47 We recently found that GATA2 is frequently deleted in human CBF leukemias, those that are associated with RUNX1 and CBFB fusion genes.48 In addition, we demonstrated that Gata2 contributes to leukemogenesis associated with CBFB-MYH11 in a mouse model.49 Interestingly, we also demonstrated that Runx1 is required for leukemogenesis associated with CBFB-MYH11 in mouse models,50 raising the possibility that Gata2 and Runx1 function synergistically during leukemogenesis.
Overall, our data suggest that GATA2 serves as a safeguard for the formation of definitive HSCs/HSPCs in case RUNX1 is inactivated and that this mechanism is evolutionary conserved. It may not be surprising that GATA2 serves this role because both GATA2 and RUNX1 are key transcription factors for hematopoiesis. The interaction between RUNX1 and GATA2 at common target genes has previously been reported, and interestingly, Gata2+/−Runx1+/− mice are embryonic lethal with hematopoietic defects.41 However, it is surprising that GATA2 can bypass RUNX1 to establish functional hematopoiesis. Likewise, RUNX1 seems to be able to sustain hematopoiesis in the absence of GATA2. Only when losing both RUNX1 and at least 75% of GATA2 was hematopoiesis abolished, suggesting remarkable redundancy between GATA2 and RUNX1 to ensure the initiation and maintenance of HSC that can support hematopoiesis, a vital system for the survival of vertebrate animals.
Acknowledgments
The authors thank the National Institutes of Health (NIH) Intramural Sequencing Center (NISC) for A-seq of the kidney samples; Brant Weinstein for the Tg(kdrl:mCherry) fish line; all Liu laboratory members, Alberto Rissone, and Aniket Gore for helpful discussion and advice; and Faiza Naz for support with single cell cDNA synthesis.
The work described in this paper was supported by the Intramural Research Programs at the National Human Genome Research Institute, NIH, and the National Institute of Arthritis and Musculoskeletal and Skin Diseases, NIH. This work used the computational resources of the NIH HPC Biowulf cluster (http://hpc.nih.gov).
Authorship
Contribution: E. Bresciani, B.C., K.B., V.S.G., and E. Broadbridge designed and performed the experiments and analyzed the data; E. Bresciani, R.S., and P.L. designed and organized the experiments and analyzed the data; M.K. assisted with fluocytometry; U.H. assisted with genotyping; S.W. assisted with microscopy; S.D. and V.S. assisted with capture and sequencing of 10× genomics and provided technical support; T.Z. designed and performed mouse experiments; E. Bresciani, E.M.K., and K.Y. performed bioinformatic analysis; E. Bresciani and P.L. wrote the manuscript.
Conflict-of-interest disclosure: The authors declare no competing financial interests.
Correspondence: Paul Liu, 50 South Dr, Bldg 50, Rm 5222C, NHGRI, NIH, Bethesda, MD 20892; e-mail: pliu@mail.nih.gov.

