

Key Points
Acquired MCL-1 inhibitor resistance represents a heterogeneous adaptation process that is overcome by concurrent Bcl-xL or Bcl-2 inhibition.
MCL-1 inhibitors are novel MDR1 substrates.

Abstract
Antiapoptotic Bcl-2 family members have recently (re)emerged as key drug targets in cancer, with a tissue- and tumor-specific activity profile of available BH3 mimetics. In multiple myeloma, MCL-1 has been described as a major gatekeeper of apoptosis. This discovery has led to the rapid establishment of clinical trials evaluating the impact of various MCL-1 inhibitors. However, our understanding about the clinical impact and optimal use of MCL-1 inhibitors is still limited. We therefore explored mechanisms of acquired MCL-1 inhibitor resistance and optimization strategies in myeloma. Our findings indicated heterogeneous paths to resistance involving baseline Bcl-2 family alterations of proapoptotic (BAK, BAX, and BIM) and antiapoptotic (Bcl-2 and MCL-1) proteins. These manifestations depend on the BH3 profile of parental cells that guide the enhanced formation of Bcl-2:BIM and/or the dynamic (ie, treatment-induced) formation of Bcl-xL:BIM and Bcl-xL:BAK complexes. Accordingly, an unbiased high-throughput drug-screening approach (n = 528) indicated alternative BH3 mimetics as top combination partners for MCL-1 inhibitors in sensitive and resistant cells (Bcl-xL>Bcl-2 inhibition), whereas established drug classes were mainly antagonistic (eg, antimitotic agents). We also revealed reduced activity of MCL-1 inhibitors in the presence of stromal support as a drug-class effect that was overcome by concurrent Bcl-xL or Bcl-2 inhibition. Finally, we demonstrated heterogeneous Bcl-2 family deregulation and MCL-1 inhibitor cross-resistance in carfilzomib-resistant cells, a phenomenon linked to the MDR1-driven drug efflux of MCL-1 inhibitors. The implications of our findings for clinical practice emphasize the need for patient-adapted treatment protocols, with the tracking of tumor- and/or clone-specific adaptations in response to MCL-1 inhibition.
Introduction
Direct modulation of antiapoptotic molecules holds great promise as a novel treatment strategy in multiple myeloma (MM). The introduction of BH3 mimetics enables the direct inhibition of major antiapoptotic proteins (Bcl-2, MCL-1, Bcl-xL) because of their close structure homology with BH3-only proteins, which leads to the release and activation of proapoptotic molecules (eg, BAX, BAK, and BIM), permeabilization of the mitochondrial outer membrane, and induction of apoptosis.1 Pioneering studies have already demonstrated the beneficial activity of venetoclax in myeloma, particularly in patients carrying the translocation t(11;14).2,3 This subgroup-specific sensitivity has been linked to higher BCL-2/MCL-1 and BCL-2/BCL-xL expression ratios in patients bearing t(11;14)3-6 and, more recently, to reduced mitochondrial respiration in MM cells.7 Irrespective of the promising activity of venetoclax in a fraction of patients with myeloma, compounds that specifically target myeloid cell leukemia 1 (MCL-1) are proposed to have the highest potential in the future therapy of MM.
MCL-1 appears to surpass the impact of Bcl-2 inhibition in MM for several reasons: first, it has been identified as a key antiapoptotic factor in most myeloma cells;4,8,9 second, the bone marrow (BM) microenvironment further promotes MCL-1 dependency in MM cells;10 third, MCL-1 dependency increases during the course of the disease.5 Several clinical-grade MCL-1 inhibitors have been developed that demonstrate impressive preclinical activity in a diverse set of disease models,11-13 leading to the rapid translation of these candidate drugs into ongoing clinical trials (www.clinicaltrials.gov, NCT03218683, NCT02992483, and NCT02675452).
However, there are several unresolved issues regarding the therapeutic use of MCL-1 inhibitors in MM and other malignancies. Presently, we have no information about the putative mechanisms of acquired drug resistance. Recent studies have linked intrinsic MCL-1 inhibitor resistance to alternative Bcl-2 family dependencies and have demonstrated favorable activity of MCL-1 inhibitors in combination with venetoclax.9,14-16 There is currently no information on whether alternative mechanisms of resistance appear after prolonged MCL-1 inhibitor treatment of sensitive cells (eg, complete shutdown of key apoptotic molecules). Unbiased strategies to define optimal combination partners are likewise not available. Moreover, it is currently unknown whether certain frontline treatment approaches would affect the outcome of BH3 mimetic-based therapies. Although prior studies suggest that MCL-1 dependency increases with disease progression,5 this possibility has not been analyzed with individual treatment modalities. Given that proteasome inhibitors (PIs) induce MM cell apoptosis via modulation of MCL-1,17 one may speculate that this will affect the efficacy of subsequent MCL-1 inhibitor treatment. The relevance of these points is exemplified by data obtained from the use of venetoclax.18-21
In this study, we sought to address several of these open issues to advance our understanding of the mechanism of action of MCL-1 inhibitors in MM and lay the groundwork for their future use in precision medicine strategies. Our findings emphasize the importance of identifying tumor/clone-specific adaptations to therapeutic interventions and the need for careful selection of drug combinations for individualized treatment concepts.
Materials and methods
Cell culture
Human myeloma and stromal cell lines were cultured, as previously described.22 S63845 and the carfilzomib (CARF)- and ixazomib (IXA)-resistant cell line variants were obtained after prolonged culture in the presence of serially increasing doses of the drug of interest. Short tandem repeat profiles and the absence of mycoplasma contamination were verified regularly. Bone marrow mononuclear cells were isolated by Ficoll-Hypaque density sedimentation, and MM cells were purified with the EasySep Human CD138 Positive Selection Kit (Stem Cell Technologies, Cologne, Germany) and used for coculture experiments, as previously described.22 Written informed consent for the use of material for scientific studies was obtained from all patients according to institutional guidelines. This study was approved by the Ethics Committee of the City of Vienna and was conducted in accordance with the Declaration of Helsinki.
High-throughput drug screening
Drug screenings with 528 annotated compounds were performed in the presence or absence of a single S63845 concentration (10 nM in sensitive variants and 100 nM in resistant variants) on top of the 528 compounds, each having 5 different concentrations (supplemental Table 1). The 528 compounds were first preplated onto 384-well plates (Corning, Corning, NY) with the aid of an acoustic liquid handling device Echo 550 (Labcyte, Sunnyvale, CA). KMS12BM- and OPM2-S63845 cells were plated on the 384-well plates at 5000 cells per well (25 μL). The plates were gently shaken for 5 minutes and placed in a humidified environment at 37°C and 5% CO2 and incubated for 72 hours. Cell viability was assessed with the CellTiter-Glo assay (Promega, Madison, WI) on a PHERAstar microplate reader (BMG-Labtech, Offenburg, Germany).
Single-agent sensitivity evaluation
The measure of single-drug sensitivity, relative inhibition (RI), is estimated as the area under a log10-scaled dose-response curve with the lower boundary chosen at the first nonzero concentration. To make this measure relative we divided it into the area under the maximal possible dose-response curve starting from the same point.23 We considered a cell line to be sensitive to a drug if the corresponding RI score was >40. Besides, we found that there is an increased/decreased sensitivity when one compares condition A sensitivity (RIA) with condition B (RIB) if the absolute difference in the RI scores (RIdiff = RIA − RIB) is greater/smaller than 15.
Drug combination sensitivity and synergy scoring
For the drug combination experiment where a drug was tested at multiple concentrations, with S63845 being added at a fixed dose, we computed the drug combination sensitivity and synergy scores as in Malyutina et al.23 The combination sensitivity score (CSS) was obtained using the same strategy as for single drugs (supplementary Methods), but the dose-response curve was originated from the combination (Figure 2A). Meanwhile, we estimated the degree of interactions in a drug combination as the S synergy score,23 defined as the difference between half the CSS and RI scores, which is a robust metric for synergy evaluation. We considered a drug combination to be synergistic/antagonistic if its S synergy score was greater/less than 5.23 For the drug-combination experiment where the full dose-response matrices for 2 drugs were tested, we determined the zero interaction potency synergy scores,24 using the SynergyFinder R package.25
Statistical analysis
A 2-tailed unpaired Student t test was performed for the comparison of 2 means, and 1-way analysis of variance followed by the Tukey post hoc test was used to compare multiple samples, unless otherwise indicated (Prism 6; GraphPad Software Inc., La Jolla, CA). P < .05 were considered to be statistically significant. All graphs represent the mean ± standard deviation of 3 independent biological replicates (each based on 3 technical replicates), unless otherwise indicated.
A detailed description of previously reported methods can be found in the supplemental Information.
Results
Characterization of MCL-1 inhibitor-resistant cells reveals heterogeneous drug resistance profiles
To obtain insights into acquired MCL-1 inhibitor-resistance mechanisms, we selected 2 cell line models with different genomic background and high baseline sensitivity to MCL-1 inhibitors and generated S63845-resistant variants (OPM2-S63845 and KMS12BM-S63845) and their corresponding S63845-sensitive, long-term culture control variants (OPM2-dimethyl sulfoxide [DMSO] and KMS12BM-DMSO). Both resistant variants demonstrated a >10-fold shift in the S63845 50% inhibitory concentration (IC50; Figure 1A) and cross-resistance to other MCL-1 inhibitors (AZD5991, AMG-176, and A-1210477; >5-10-fold shift in IC50, respectively; supplemental Figure 1). BAK activity after S63845 treatment was completely diminished in resistant cells, as determined by coimmunoprecipitation analysis and flow cytometry (Figure 1B; supplemental Figure 2). No impact was observed on the efficacy of established anti-MM therapeutics or alternative BH3 mimetics (supplemental Figures 3 and 4).
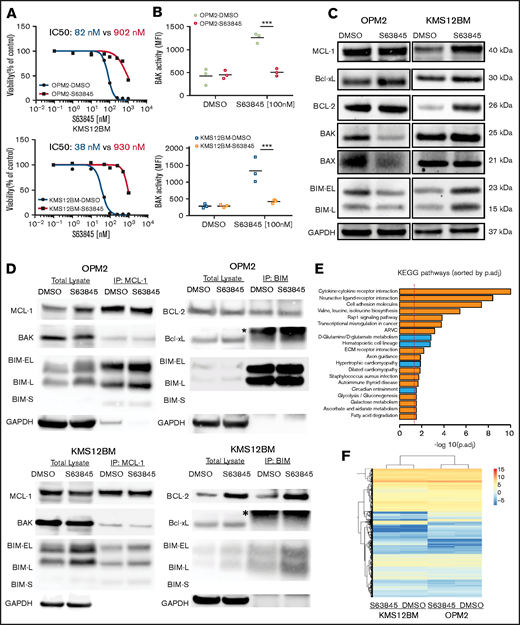
Characterization of S63845 resistant cells reveals heterogeneous resistance profiles. (A) Dose-response curves of S63845-sensitive vs -resistant cells indicate a >10-fold shift of IC50 values. Viability was assessed 72 hours after treatment (n = 3 biological replicates). (B) Lack of BAK activation after treatment with S63845 in resistant cells. BAK activation status was determined 4 hours after treatment with 100 nM S63845. Graphs represent the mean (horizontal lines) of 3 independent experiments. ***P < .001. (C) Baseline protein levels of Bcl-2 family members show cell line–specific adaptations in OPM2-S63845- vs KMS12BM-S63845-resistant cells. (D) Assessment of baseline BH3 family binding patterns in S63845-sensitive vs -resistant cells (n = 2 biological replicates). *Immunoglobulin light chain. (E) Top 20 significantly deregulated pathways in S63845-sensitive vs -resistant cells, as determined by the Ensemble of Gene Set Enrichment Analysis (EGSEA) method. (p.adj., adjusted P-value). (F) Hierarchical cluster analysis demonstrates a closer association between individual cell line pairs rather than sensitive vs resistant cell line status.
Characterization of S63845 resistant cells reveals heterogeneous resistance profiles. (A) Dose-response curves of S63845-sensitive vs -resistant cells indicate a >10-fold shift of IC50 values. Viability was assessed 72 hours after treatment (n = 3 biological replicates). (B) Lack of BAK activation after treatment with S63845 in resistant cells. BAK activation status was determined 4 hours after treatment with 100 nM S63845. Graphs represent the mean (horizontal lines) of 3 independent experiments. ***P < .001. (C) Baseline protein levels of Bcl-2 family members show cell line–specific adaptations in OPM2-S63845- vs KMS12BM-S63845-resistant cells. (D) Assessment of baseline BH3 family binding patterns in S63845-sensitive vs -resistant cells (n = 2 biological replicates). *Immunoglobulin light chain. (E) Top 20 significantly deregulated pathways in S63845-sensitive vs -resistant cells, as determined by the Ensemble of Gene Set Enrichment Analysis (EGSEA) method. (p.adj., adjusted P-value). (F) Hierarchical cluster analysis demonstrates a closer association between individual cell line pairs rather than sensitive vs resistant cell line status.
Surprisingly, baseline Bcl-2 family protein levels pointed to heterogeneous mechanisms of drug resistance in both model systems. We observed significant downregulation of proapoptotic proteins (BAK, BAX, and BIM) in OPM2-S63845, whereas prominent upregulation of the antiapoptotic molecules MCL-1 and Bcl-2 was found in KMS12BM-S63845 (Figure 1C). No baseline alterations were observed in the protein levels of other Bcl-2 family members (BAD, BID, NOXA, and PUMA; supplemental Figure 5A). Coimmunoprecipitation experiments confirmed an increased presence of Bcl-2:BIM complexes in KMS12BM-S63845 cells. However, binding patterns of MCL-1 to BIM, BAK, BAD, or NOXA were not affected in S63845-resistant cells, nor did we detect any other baseline alterations in either cell line (Figure 1D; supplemental Figure 5B-D). RNA-sequencing (RNA-seq) analysis further supported the presence of tumor- or clone-specific resistance paths. Although we observed multiple significantly deregulated pathways in resistant vs sensitive cells (66 pathways with adjusted P < .05), which mainly involve cell-cell cross talk and metabolic pathways, the differential gene expression analysis did not reveal significant genes (adjusted P > .05). Both resistant cell lines associated more closely with their sensitive parental control rather than with their resistant counterpart in hierarchical cluster analysis (Figure 1E-F; supplemental Tables 4-7).
High-throughput drug screenings reveal BH3 mimetics to be major combination partners for MCL-1 inhibitors
Based on the heterogeneous resistance profiles, we performed high-throughput drug screening analysis as an alternative, unbiased approach to reveal common vulnerabilities and optimal combination partners that boost and/or overcome MCL-1 inhibitor activity and resistance, respectively.
Single-agent relative inhibition (RI) scores of 528 tested compounds uncovered no drug with increased activity in S63845-resistant vs -sensitive cells (supplemental Table 2). Seven and 17 drugs showed reduced activity in KMS12BM-S63845 and OPM2-S63845, respectively. Among those, 2 drugs overlapped: S63845 and the Eg5 inhibitor litronesib, which was the only compound with reduced activity in both resistant cell lines that displayed RI values outside the range of additionally screened “control” MM cell lines (n = 8); however, S63845-resistant cells were still classified as sensitive to this drug (RI = 45.9 and 45.2 for KMS12BM- S63845 and OPM2-S63845, respectively). The categorization of drugs with reduced activity in S63845-resistant cells into drug classes indicated an enrichment of cell cycle–targeting agents, such as CDK or mitotic inhibitors (n = 9/n = 4 in OPM2- S63845 and KMS12BM-S63845 cells, respectively). Moreover, the heterogeneous picture persisted, as evidenced by an exclusive loss of activity of FGFR inhibitors in t(4;14)+ OPM2-S63845 cells (supplemental Figure 6).
Drug combination screening of the compound library with S63845 clearly showed that BH3 mimetics were major synergy partners in both S63845-sensitive and -resistant cell lines (Figure 2A, supplemental Figure 7, supplemental Table 1). Interestingly, Bcl-xL inhibitors were more potent than other Bcl-2 family inhibitors in potentiating the activity of S63845 in sensitive MM cells. This finding was independently validated by testing the combination partners at broader dose ranges (Figure 2B-C; supplemental Figures 8 and 9). In OPM2-S63845, synergy scores for Bcl-xL inhibitors (but not venetoclax) increased even further when compared with sensitive cells, but the opposite was true in KMS12BM-S63845 cells: synergy scores for Bcl-xL inhibitors fell below those of Bcl-2-targeting drugs (navitoclax, venetoclax), which was independently confirmed at broader dose ranges and via BAK activation assays (Figure 2C-D; supplemental Figures 8 and 9). Direct comparisons of combination screening results in sensitive vs resistant cells demonstrated a strong correlation (OPM2-DMSO vs OPM2-S63845: R = 0.86, P < 2.2e-16; KMS12BM: R = 0.81, P < 2.2e-16; eg, strong antagonism of S63845 in combination with HDAC, BET, CDK, and mitotic inhibitors; Figure 3A), but also revealed key differences. First, the dual Bcl-xL/Bcl-2 inhibitor navitoclax was the only compound with increased synergy scores in both resistant cell lines (Figure 3B). Second, Bcl-xL inhibitors including A-1331852 and A1155463 were the most potent combination partners for S63845 (exception, KMS12BM-S63845; Figure 3). Third, cell line and status-specific results (sensitive vs resistant) support the role of heterogeneous drug-resistance profiles. For instance, strong synergism of S63845 with IGF1R/PI3K/AKT inhibitors was exclusively noted in OPM2-S63845 cells (Figure 3B). These results suggest the existence of clone-specific therapeutic options, but overall define BH3 mimetics as major combination partners for MCL-1 inhibitors in MM.
![BH3 mimetics are the most promising combination partners for MCL-1 inhibitors in myeloma. (A) Outline of the 72-hour drug combination screening and representative hit selection based on synergy (S) score and CSS in OPM2-S63845 cells. (B) Ranking of selected drug combination partners (drug classes) based on S scores in all 4 cell line variants. Horizontal lines indicate average S scores for each drug class. (C) Independent validation experiments confirm strong synergism of S63845 with Bcl-xL and Bcl-2 inhibitors. Results are based on dose-response curves obtained 72 hours after treatment (n = 3 biological replicates). Zero interaction potency scores were determined with SynergyFinder. (D) BH3 mimetics reactivate BAK in S63845-resistant cells, whereas individual cell lines show preferences for either concurrent Bcl-xL or Bcl-2 blockade. BAK activation status was determined 4 hours after treatment with BH3 mimetics at the indicated concentrations. Horizontal lines indicate mean BAK activity (mean fluorescence intensity [MFI]). Results are based on 3 independent experiments performed in triplicate. *P < .05; ***P < .001; n.s., not significant.](https://ash.silverchair-cdn.com/ash/content_public/journal/bloodadvances/5/20/10.1182_bloodadvances.2020003826/2/m_advancesadv2020003826f2.png?Expires=1770449028&Signature=EPPnU1Nq5g8Vy-poboo6iRaI3jCAFAveAe0erAAvrGQSJS9UrU7w5MYciBzmmixvZrWO-63rEnQ9V7t6xWLDIp9skMvc1qBICWrldo29fzFE38Snl1XCMoFSjAIGI7K1gRX8a-Df-~TvrzkzJU0CUn6to2etvKgI~NCmRuQsFsiW~bmgtHd0-KI72T4MvXgvo0pReNkYd1hukNI~f7h8vuCI-yBdAVe1SgsAm8~MoLfdBQ2~4A-zmjeoEqL9aHNyDtxBaDI2eAcwlMKfq-nsDwfqzSINXVjm7sEYS79Tp0ADxHZNeZPuja8wMPvfxDmFoMRsFr7rjLa8g6qbS4UFyQ__&Key-Pair-Id=APKAIE5G5CRDK6RD3PGA)
BH3 mimetics are the most promising combination partners for MCL-1 inhibitors in myeloma. (A) Outline of the 72-hour drug combination screening and representative hit selection based on synergy (S) score and CSS in OPM2-S63845 cells. (B) Ranking of selected drug combination partners (drug classes) based on S scores in all 4 cell line variants. Horizontal lines indicate average S scores for each drug class. (C) Independent validation experiments confirm strong synergism of S63845 with Bcl-xL and Bcl-2 inhibitors. Results are based on dose-response curves obtained 72 hours after treatment (n = 3 biological replicates). Zero interaction potency scores were determined with SynergyFinder. (D) BH3 mimetics reactivate BAK in S63845-resistant cells, whereas individual cell lines show preferences for either concurrent Bcl-xL or Bcl-2 blockade. BAK activation status was determined 4 hours after treatment with BH3 mimetics at the indicated concentrations. Horizontal lines indicate mean BAK activity (mean fluorescence intensity [MFI]). Results are based on 3 independent experiments performed in triplicate. *P < .05; ***P < .001; n.s., not significant.
BH3 mimetics are the most promising combination partners for MCL-1 inhibitors in myeloma. (A) Outline of the 72-hour drug combination screening and representative hit selection based on synergy (S) score and CSS in OPM2-S63845 cells. (B) Ranking of selected drug combination partners (drug classes) based on S scores in all 4 cell line variants. Horizontal lines indicate average S scores for each drug class. (C) Independent validation experiments confirm strong synergism of S63845 with Bcl-xL and Bcl-2 inhibitors. Results are based on dose-response curves obtained 72 hours after treatment (n = 3 biological replicates). Zero interaction potency scores were determined with SynergyFinder. (D) BH3 mimetics reactivate BAK in S63845-resistant cells, whereas individual cell lines show preferences for either concurrent Bcl-xL or Bcl-2 blockade. BAK activation status was determined 4 hours after treatment with BH3 mimetics at the indicated concentrations. Horizontal lines indicate mean BAK activity (mean fluorescence intensity [MFI]). Results are based on 3 independent experiments performed in triplicate. *P < .05; ***P < .001; n.s., not significant.
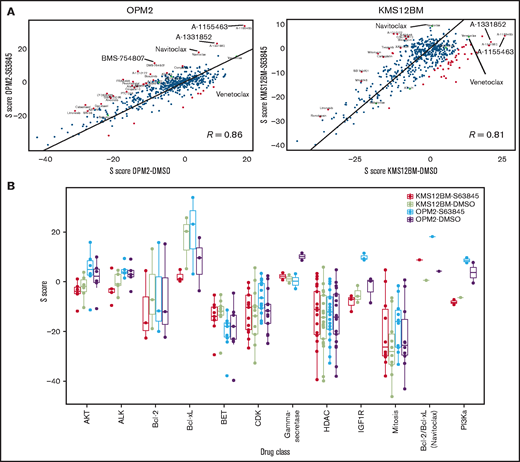
Cross-comparisons between S63845-sensitive and -resistant cell lines reveal common and cell line–specific combination partners. (A) Correlation analyses of S scores in S63845 sensitive vs resistant cells indicate a strong association between both cell line variants, but also revealed certain key differences. (B) S scores of all 4 screened cell line variants according to selected drug classes that underline common as well as cell line–specific patterns in response to S63845 combination treatments.
Cross-comparisons between S63845-sensitive and -resistant cell lines reveal common and cell line–specific combination partners. (A) Correlation analyses of S scores in S63845 sensitive vs resistant cells indicate a strong association between both cell line variants, but also revealed certain key differences. (B) S scores of all 4 screened cell line variants according to selected drug classes that underline common as well as cell line–specific patterns in response to S63845 combination treatments.
Dynamic regulation of Bcl-xL binding patterns in MCL-1 inhibitor–resistant cell line variants
We next investigated the molecular basis of the differential activity of BH3 mimetic combinations in S63845-resistant cells. Given the lack of major steady-state alterations in the Bcl-xL expression or binding affinity status, we speculated that dynamic responses after MCL-1 inhibitor treatment are the cause of the observed synergism. Importantly, we noted no persisting MCL-1:BAK and only minor MCL-1:BIM complexes (in sensitive and resistant cells), as well as previously reported MCL-1 stabilization11,13 with S63845 treatment, indicating that the key mechanism of action of MCL-1 inhibitors was not affected (supplemental Figure 10; Figure 4C). Protein expression levels of Bcl-2 and Bcl-xL were downregulated and appeared in their short, proapoptotic forms in sensitive cells, but were not affected by S63845 treatment in resistant cells. This result suggests that dynamic fluctuations of total protein levels of Bcl-2, Bcl-xL, and MCL-1 associate with apoptosis induction in sensitive cells (supplemental Figure 11). In contrast, we observed increased binding of Bcl-xL to BIM in OPM2-S63845 cells as early as 90 minutes after treatment. With KMS12BM-S63845, elevated Bcl-2:BIM complexes persisted during treatment, but we also detected treatment-induced binding of Bcl-xL to BAK (Figure 4A-C). In addition, minimal formation of Bcl-xL:BAD complexes after S63845 treatment was observed in both resistant cell line variants (supplemental Figure 12). This dynamic formation of Bcl-xL:BAK and Bcl-xL:BIM complexes was also confirmed in MM cells with doxycycline-inducible Bcl-xL expression, which likewise rescued them from MCL-1 inhibitor treatment (Figure 4D-E; supplemental Figure 13A-B). Moreover, confirmatory coimmunoprecipitation experiments with alternative primary antibodies (anti-Bcl-xL and anti-BAK) validated our findings in S63845-resistant cells (Figure 4B-C; supplemental Figure 13C).
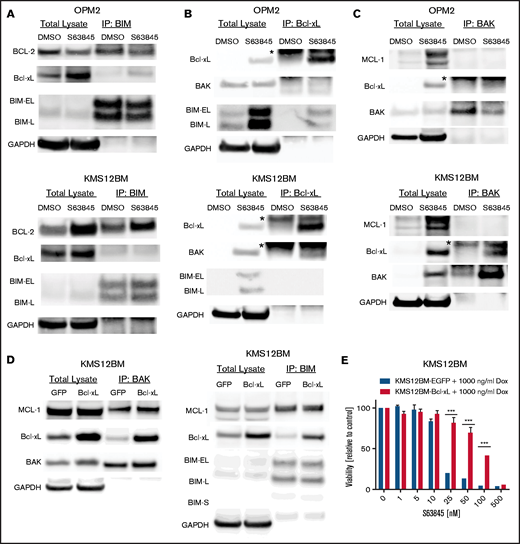
Dynamic Bcl-2 family binding patterns are involved in S63845 resistance. BIM (A), Bcl-xL (B), and BAK (C) coimmunoprecipitation experiments were performed 90 minutes (A) or 24 hours (B-C) after treatment with 100 nM S63845. Eluates were analyzed via sodium dodecyl sulfate polyacrylamide gel electrophoresis for the presence of BIM:Bcl-xL, BIM:Bcl-2, BAK:Bcl-xL, and BAK:MCL-1 complexes, respectively; GAPDH served as the loading control. Numbers are representative of 2 biological replicates. *Immunoglobulin light chain. (D) Doxycycline inducible KMS12BM-EGFP (control) and -Bcl-xL cells were treated for 24 hours with 1000 ng/mL doxycycline. Subsequently, cells were treated for 2 hours with 100 nM S63845 and used for BIM or BAK coimmunoprecipitation experiments, which confirmed the dynamic formation of BAK:Bcl-xL and BIM:Bcl-xL complexes. (E) Inducible Bcl-xL expression protects MM cells from S63845. Cells were treated in the presence of doxycycline and S63845 for 72 hours (n = 3 biological replicates). Cells with doxycycline-inducible EGFP expression served as the control. Graphs represent viability relative to control at the end of the incubation period. Mean ± standard deviation of 3 independent experiments. ***P < .001.
Dynamic Bcl-2 family binding patterns are involved in S63845 resistance. BIM (A), Bcl-xL (B), and BAK (C) coimmunoprecipitation experiments were performed 90 minutes (A) or 24 hours (B-C) after treatment with 100 nM S63845. Eluates were analyzed via sodium dodecyl sulfate polyacrylamide gel electrophoresis for the presence of BIM:Bcl-xL, BIM:Bcl-2, BAK:Bcl-xL, and BAK:MCL-1 complexes, respectively; GAPDH served as the loading control. Numbers are representative of 2 biological replicates. *Immunoglobulin light chain. (D) Doxycycline inducible KMS12BM-EGFP (control) and -Bcl-xL cells were treated for 24 hours with 1000 ng/mL doxycycline. Subsequently, cells were treated for 2 hours with 100 nM S63845 and used for BIM or BAK coimmunoprecipitation experiments, which confirmed the dynamic formation of BAK:Bcl-xL and BIM:Bcl-xL complexes. (E) Inducible Bcl-xL expression protects MM cells from S63845. Cells were treated in the presence of doxycycline and S63845 for 72 hours (n = 3 biological replicates). Cells with doxycycline-inducible EGFP expression served as the control. Graphs represent viability relative to control at the end of the incubation period. Mean ± standard deviation of 3 independent experiments. ***P < .001.
Subsequent drug combination studies with venetoclax and A-1331852 further demonstrated the dual importance of Bcl-xL and Bcl-2 in KMS12BM- but not OPM2-S63845 cells, as evidenced by high S synergy scores in comparison with other BH3 mimetic combinations (supplemental Figure 14). The modular use of Bcl-2 and Bcl-xL in response to S63845 therefore explains the discrepant drug combination results in our S63845-resistance models and supports the existence of clone-specific Bcl-2 family adaptation processes.
Concurrent Bcl-xL inhibition is effective in the presence of stromal support
The MCL-1 inhibitor AZD5991 has recently been shown to display reduced activity in the presence of stromal support.14 We therefore decided to validate our screening hit candidates in the presence of stromal support and examined whether the identified hits overcome this phenomenon as they have in the published combination studies of venetoclax.14,21 The protective effect of bone marrow stromal cells was confirmed with the MCL-1 inhibitors S63845 and A-1210477, in 2 independent stromal cell lines (MSCT+ and HS-5) in 5 of 7 MM cell lines tested (Figure 5A-C; supplemental Figure 15), indicating that stromal protection is a drug class effect. Stromal rescue effects were cell-cell–contact dependent in our model systems (Figure 5D), and concurrent Bcl-xL and Bcl-2 inhibition overcame the protective environment. Of note, the Bcl-xL inhibitor A-1331852 outperformed venetoclax (Figure 5E). No rescue effect was observed with any of the Bcl-2 family-independent hit candidates of our drug combination screening (eg, bexarotene, BMS-754807, and prednisone; data not shown). In line with our findings in MM cell lines, we observed a complete loss of activity of S63845 in CD138-purified primary MM cells in coculture, but concurrent Bcl-xL blockade completely overcame this protective effect and outperformed venetoclax in all patient samples tested (Figure 5F). This result was independent of the genetic background of patients with MM (supplemental Table 3).
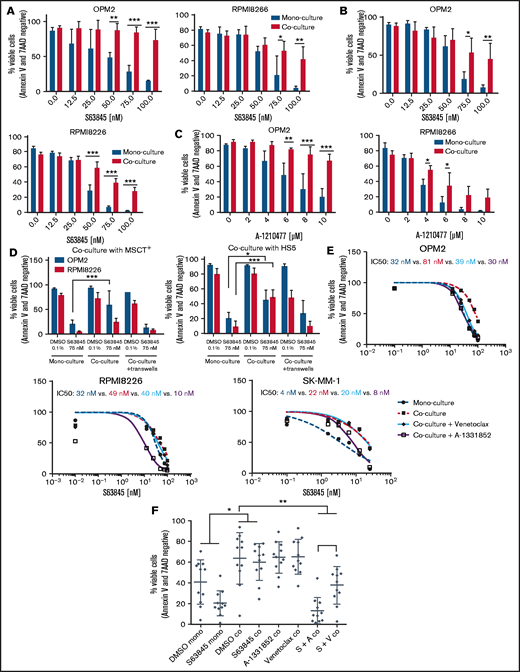
Concurrent Bcl-xL blockade outperforms venetoclax in the presence of stromal support. (A-B) Dose-response curves of S63845 in the presence or absence of stromal support: MSCT+ cells (A); HS-5 cells (B). (C) Dose-response curves of A-1210477 in the presence or absence of stromal support (MSCT+). (D) Efficacy studies of S63845 in MM cell monoculture, direct cell-cell contact coculture or Transwell coculture with MSCT+ or HS-5 stromal cells. (A-D) Graphs represent the mean ± standard deviation of 3 independent experiments performed in triplicate. *P < .05, **P < .01; ***P < .001. (E) Dose-response curves of S63845 in monoculture and coculture (MSCT+) in the presence or absence of the Bcl-xL inhibitor A-1331852 (100 nM) or the Bcl-2 inhibitor venetoclax (100 nM), respectively. Corresponding IC50 values are indicated. Dose-response curves represent the mean of 3 independent experiments performed in triplicate. (F) Primary CD138+ MM cells (n = 10) escape S63845 therapy in the presence of stromal support (MSCT+). This effect is overcome by the concurrent treatment with A-1331852 (complete rescue) or venetoclax (partial rescue). Viable cells were determined via annexin V/7 AAD staining 24 hours after treatment initiation. Graph shows median viability with interquartile range. *P < .05; **P < .01.
Concurrent Bcl-xL blockade outperforms venetoclax in the presence of stromal support. (A-B) Dose-response curves of S63845 in the presence or absence of stromal support: MSCT+ cells (A); HS-5 cells (B). (C) Dose-response curves of A-1210477 in the presence or absence of stromal support (MSCT+). (D) Efficacy studies of S63845 in MM cell monoculture, direct cell-cell contact coculture or Transwell coculture with MSCT+ or HS-5 stromal cells. (A-D) Graphs represent the mean ± standard deviation of 3 independent experiments performed in triplicate. *P < .05, **P < .01; ***P < .001. (E) Dose-response curves of S63845 in monoculture and coculture (MSCT+) in the presence or absence of the Bcl-xL inhibitor A-1331852 (100 nM) or the Bcl-2 inhibitor venetoclax (100 nM), respectively. Corresponding IC50 values are indicated. Dose-response curves represent the mean of 3 independent experiments performed in triplicate. (F) Primary CD138+ MM cells (n = 10) escape S63845 therapy in the presence of stromal support (MSCT+). This effect is overcome by the concurrent treatment with A-1331852 (complete rescue) or venetoclax (partial rescue). Viable cells were determined via annexin V/7 AAD staining 24 hours after treatment initiation. Graph shows median viability with interquartile range. *P < .05; **P < .01.
Concurrent loss of MCL-1 inhibitor activity in CARF-resistant myeloma cells
Having identified BH3 mimetics as the top combination partners for MCL-1 inhibitors, we continued to evaluate the impact of prolonged PI exposure on the efficacy of BH3 mimetics. As outlined earlier, PIs were chosen to model prior frontline treatments because of their known impact on MCL-1 regulation.17 Intriguingly, we demonstrated a striking loss of activity of 3 of 4 MCL-1 inhibitors (S63845, AZD5991, and A-1210477) in 4 cell line models with acquired CARF resistance. AMG-176 was the only compound that showed similar efficacy in sensitive and resistant cells (median IC50: 422 nM vs 272 nM; Figure 6A; supplemental Figure 16). Alternative BH3 mimetics (venetoclax, navitoclax, and A-13381852) showed reduced activity in KMS12PE-CARF, but in none of the other CARF-resistant cell line variants (supplemental Figure 17).
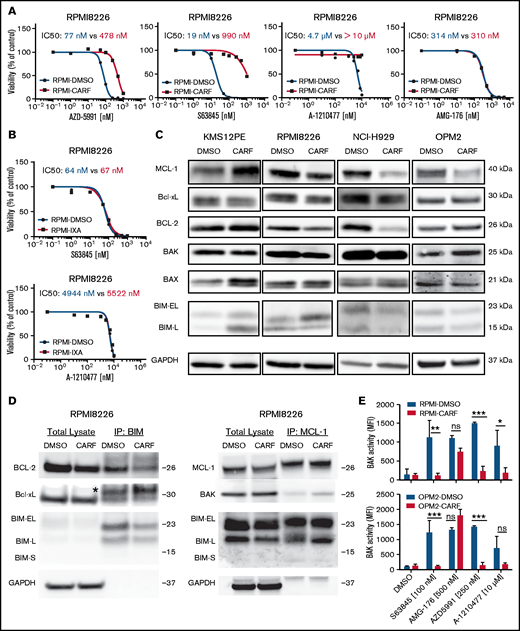
MCL-1 inhibitors are less effective in CARF-resistant myeloma cells. (A) Dose-response curves of MCL-1 inhibitors in CARF-sensitive and -resistant RPMI8226 cells (n = 3 biological replicates). Viability was assessed 72 hours after treatment induction. (B) Dose-response curves of MCL-1 inhibitors in IXA-sensitive and -resistant RPMI8226 cells. Viability was assessed 72 hours after treatment induction (n = 3 biological replicates). (C) Baseline Bcl-2 family protein levels in CARF-sensitive and -resistant cell line variants (n = 3 biological replicates). (D) Coimmunoprecipitation experiments in CARF-sensitive (DMSO) and -resistant (CARF) RPMI8226 cells revealed no explanation for the reduced activity of MCL-1 inhibitors (n = 2 biological replicates). *Immunoglobulin light chain. (E) BAK activity status in CARF-sensitive and -resistant cells 4 hours after treatment with MCL-1 inhibitors (n = 3 biological replicates). *P < . 05; **P < .01, ***P < .001; ns, not significant.
MCL-1 inhibitors are less effective in CARF-resistant myeloma cells. (A) Dose-response curves of MCL-1 inhibitors in CARF-sensitive and -resistant RPMI8226 cells (n = 3 biological replicates). Viability was assessed 72 hours after treatment induction. (B) Dose-response curves of MCL-1 inhibitors in IXA-sensitive and -resistant RPMI8226 cells. Viability was assessed 72 hours after treatment induction (n = 3 biological replicates). (C) Baseline Bcl-2 family protein levels in CARF-sensitive and -resistant cell line variants (n = 3 biological replicates). (D) Coimmunoprecipitation experiments in CARF-sensitive (DMSO) and -resistant (CARF) RPMI8226 cells revealed no explanation for the reduced activity of MCL-1 inhibitors (n = 2 biological replicates). *Immunoglobulin light chain. (E) BAK activity status in CARF-sensitive and -resistant cells 4 hours after treatment with MCL-1 inhibitors (n = 3 biological replicates). *P < . 05; **P < .01, ***P < .001; ns, not significant.
Next, we wanted to confirm the impact of prior PI treatment on MCL-1 inhibitor activity in an independent panel (n = 4) of IXA-resistant cell lines. Surprisingly, MCL-1 inhibitors were comparably effective in IXA-resistant vs -sensitive cells (Figure 6B; supplemental Figure 18). This result suggests that specific CARF-induced alterations induce MCL-1 inhibitor cross-resistance. We therefore analyzed baseline protein levels of Bcl-2 family members, but the analysis revealed a heterogeneous picture of cell line–specific rather than common alterations (Figure 6C). Similarly, baseline binding patterns of proapoptotic and antiapoptotic proteins assessed via coimmunoprecipitation experiments revealed no common changes in CARF-sensitive vs -resistant cells. Although we detected increased binding of Bcl-2 to Bim in KMS12PE-CARF cells (which may explain their reduced sensitivity against non-MCL-1–targeting BH3 mimetics), neither Bcl2:Bim, Bcl-xL:Bim, or MCL-1:Bim nor MCL-1:Bak complexes were significantly changed in any of the other cell lines (Figure 6D; supplemental Figure 19). Results of experiments combining BH3 mimetics with CARF likewise did not explain and/or reverse PI or MCL-1 inhibitor resistance (not shown). Considering the importance of BAK for the activity of MCL-1 inhibitors, we also excluded the presence of an inactive BAK variant. Although S63845, AZD-5991, and A-1210477 failed to activate BAK in CARF-resistant cells, AMG-176 significantly increased BAK activity, which reached similar levels in CARF-sensitive and -resistant cells. This finding excludes the possibility of BAK inactivation as the underlying cause of the observed MCL-1 inhibitor resistance (Figure 6E).
Drug efflux via MDR1 mediates MCL-1 inhibitor resistance
Given the lack of consistent alterations of Bcl-2 family members and the maintained functionality of the apoptotic signaling cascade (ie, BAK activity) in CARF-resistant cell lines, we speculated that the CARF-induced upregulation of MDR1 causes MCL-1 inhibitor cross-resistance. In accordance with prior reports,26,27 we observed a striking upregulation of MDR1 in CARF- but not in IXA-resistant MM cells (Figure 7A). Treatment of CARF-resistant cells with established MDR1 inhibitors (nelfinavir, tariquidar, verapamil, and reserpine) restored MCL-1 inhibitor sensitivity in all the tested cell lines, thus strongly supporting our hypothesis (Figure 7B; supplemental Figures 20 and 21). To corroborate this finding, we established a mass spectrometry–based assay that enabled us to measure intracellular concentrations of S63845. This analysis demonstrated significantly reduced S63845 levels in CARF-resistant vs -sensitive cell line variants 6 hours after treatment, which was reversed by the concurrent treatment with tariquidar or verapamil (Figure 7C; supplemental Figure 22). Moreover, concurrent treatment of CARF-resistant cells with MCL-1 inhibitors and nelfinavir (or tariquidar) restored BAK activation, thereby emphasizing the potential of a ready-to-use drug class (HIV protease inhibitors) to reinduce the apoptotic machinery (Figure 7D).
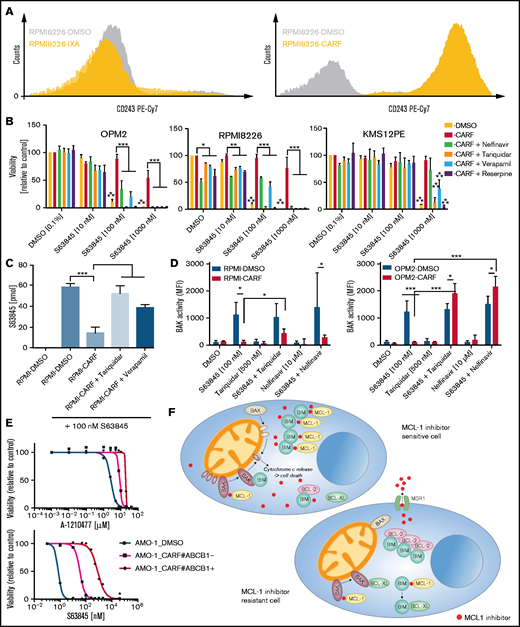
Concurrent loss of activity of MCL-1 inhibitors is mediated via MDR1-driven drug efflux in CARF-resistant myeloma cells. (A) Surface CD243 (MDR1) expression on proteasome inhibitor sensitive, IXA-resistant as well as CARF-resistant RPMI8226 cells. (B) Drug combination studies of S63845 and established inhibitors of MDR1 demonstrated a reversal of the observed cross-resistance. Viability was assessed 72 hours after treatment initiation. Graphs show the mean ± standard deviation (SD) of 3 independent experiments performed in triplicate. Cells treated with 0.1% DMSO served as the control. Asterisks indicate statistically significant differences between CARF-resistant cells treated with single-agent DMSO or S63845 at the indicated concentrations. *P < .05; **P < .01; ***P < .001. (C) Intracellular S63845 concentrations were determined 6 hours after treatment via a mass spectrometry–based assay in RPMI8226-sensitive (DMSO) and CARF-resistant cells in the presence or absence of established MDR1 inhibitors (tariquidar and nelfinavir; n = 3 biological replicates). **P < .01; ***P < .001. (D) BAK activity status in CARF-sensitive and -resistant cells 4 hours after treatment with MCL-1 inhibitors in the presence or absence of MDR1 inhibitors (tariquidar and nelfinavir; n = 3 biological replicates. *P < .05; ***P < .001. (E) Dose-response curves of A-1210477 and S63845 in CARF-sensitive, CARF-resistant, and CARF-resistant-MDR1-knockout cells. Viability was assessed 72 hours after treatment. Graphs represent the mean ± SD of 3 independent experiments performed in triplicate. (F) Proposed mechanisms of MCL-1 inhibitor resistance in myeloma. In sensitive cells, MCL-1 inhibitors disrupt the binding between MCL-1 and proapoptotic molecules (BIM and/or BAK), which leads to the activation and oligomerization of BAK, release of cytochrome c and induction of apoptosis. Multiple modes of resistance exist in MCL-1 inhibitor insensitive cells. Downregulation of proapoptotic molecules (BAK, BAX, and BIM) or upregulation of antiapoptotic molecules (MCL-1, Bcl-2, and Bcl-xL) raise the threshold for apoptosis induction. The same is true of drug efflux–driven resistance, which limits the availability of intracellular MCL-1 inhibitors. In addition, altered binding patterns of pro- and antiapoptotic molecules (eg, Bcl-2:BIM > MCL-1:BIM complexes) affect MCL-1 inhibitor sensitivity levels, which are also mediated via dynamic responses such as treatment-induced sequestration of BAK and BIM via Bcl-xL.
Concurrent loss of activity of MCL-1 inhibitors is mediated via MDR1-driven drug efflux in CARF-resistant myeloma cells. (A) Surface CD243 (MDR1) expression on proteasome inhibitor sensitive, IXA-resistant as well as CARF-resistant RPMI8226 cells. (B) Drug combination studies of S63845 and established inhibitors of MDR1 demonstrated a reversal of the observed cross-resistance. Viability was assessed 72 hours after treatment initiation. Graphs show the mean ± standard deviation (SD) of 3 independent experiments performed in triplicate. Cells treated with 0.1% DMSO served as the control. Asterisks indicate statistically significant differences between CARF-resistant cells treated with single-agent DMSO or S63845 at the indicated concentrations. *P < .05; **P < .01; ***P < .001. (C) Intracellular S63845 concentrations were determined 6 hours after treatment via a mass spectrometry–based assay in RPMI8226-sensitive (DMSO) and CARF-resistant cells in the presence or absence of established MDR1 inhibitors (tariquidar and nelfinavir; n = 3 biological replicates). **P < .01; ***P < .001. (D) BAK activity status in CARF-sensitive and -resistant cells 4 hours after treatment with MCL-1 inhibitors in the presence or absence of MDR1 inhibitors (tariquidar and nelfinavir; n = 3 biological replicates. *P < .05; ***P < .001. (E) Dose-response curves of A-1210477 and S63845 in CARF-sensitive, CARF-resistant, and CARF-resistant-MDR1-knockout cells. Viability was assessed 72 hours after treatment. Graphs represent the mean ± SD of 3 independent experiments performed in triplicate. (F) Proposed mechanisms of MCL-1 inhibitor resistance in myeloma. In sensitive cells, MCL-1 inhibitors disrupt the binding between MCL-1 and proapoptotic molecules (BIM and/or BAK), which leads to the activation and oligomerization of BAK, release of cytochrome c and induction of apoptosis. Multiple modes of resistance exist in MCL-1 inhibitor insensitive cells. Downregulation of proapoptotic molecules (BAK, BAX, and BIM) or upregulation of antiapoptotic molecules (MCL-1, Bcl-2, and Bcl-xL) raise the threshold for apoptosis induction. The same is true of drug efflux–driven resistance, which limits the availability of intracellular MCL-1 inhibitors. In addition, altered binding patterns of pro- and antiapoptotic molecules (eg, Bcl-2:BIM > MCL-1:BIM complexes) affect MCL-1 inhibitor sensitivity levels, which are also mediated via dynamic responses such as treatment-induced sequestration of BAK and BIM via Bcl-xL.
Finally, we confirmed the postulated role of MDR1 in a previously reported AMO-1-CARF-MDR1–knockout model.27 In accordance with our findings, AMO-1-CARF cells displayed cross-resistance to both MCL-1 inhibitors (S63845 and A-1210477). Similar to nelfinavir, we were able to show that the HIV protease inhibitor lopinavir restored the activity of the tested MCL-1 inhibitors in this cell line model (supplemental Figure 23). Importantly, CRISPR/Cas9-mediated knockout of MDR1 in CARF-resistant cells likewise overcame the observed cross-resistance (Figure 7E). This result establishes MCL-1 inhibitors as novel MDR1 substrates and drug efflux as another level of defense among a diverse set of resistance mechanisms that enable myeloma cells to escape MCL-1 inhibition (Figure 7F).
Considering the dominant effect of MDR1 on intracellular S63845 levels, we also examined a potential role for MDR1 in the MCL-1 inhibitor-resistant cell lines. There was no change in MDR1 surface expression, nor did any of the tested drug efflux inhibitors (tariquidar, nelfinavir, verapamil, or reserpine) overcome S63845 resistance (supplemental Figure 24A-B). Surprisingly, however, intracellular S63845 levels were moderately decreased in KMS12BM cells 6 hours after treatment (43% reduction; supplemental Figure 24C). This was not the case in resistant OPM2 cells and other compounds prone to drug efflux (eg, CARF and panobinostat), which showed similar activity in KMS12BM-sensitive and -resistant variants in the drug-screening data. Analysis of the complete set of ABC transporters in our RNA-seq data set did not define any significant changes or trends (supplemental Figure 24D). Our data therefore suggest that drug efflux may contribute to acquired MCL-1 inhibitor resistance, but not as a stand-alone mechanism of action. This phenomenon is probably driven by the combined activity of several nonspecific pumps or presently undisclosed interactors that influence the intracellular accumulation of S63845.
Discussion
Tumor cells impress by their extensive ability to develop novel survival strategies under therapeutic pressure. This ability is shown by myeloma cells as well, and available results on drug resistance in MM point to a plethora of evasion strategies, such as an increase in the mutational load of drug target pathways,28,29 deregulation of target molecules,30 metabolic adaptations,31 environmental support32 and dynamic mechanisms of drug escape.5 BH3 mimetics bypass the need for overcoming upstream antiapoptotic mechanisms, raising the hope that MM cells will not be able to rely on these modes of resistance. We therefore aimed to define key resistance mechanisms to MCL-1 inhibitors with the prospect of overcoming potential barriers and restoring their activity.
The positive findings show that myeloma cells with acquired S63845 resistance did not shift to an apoptosis-refractory state (eg, complete loss or mutation of key apoptosis-inducing molecules). The negative observation, however, is that, similar to other established anti-MM drugs, a diverse set of defense modes enabled myeloma cells to evade MCL-1 inhibition. We therefore used an unbiased high-throughput drug-screening approach that revealed common vulnerabilities and demonstrated that BH3 mimetics are the most promising combination partners. Such an approach has already been successfully exploited in several studies by concurrent inhibition of MCL-1, together with Bcl-2 blockade with venetoclax.9,14-16 Our results, however, revealed that Bcl-xL inhibitors are the most effective compounds for potentiating the activity of MCL-1 inhibitors. This effect was also maintained in the presence of stromal support, thereby confirming previous results with AZD599114 and clearly demonstrating that reduced efficacy of MCL-1 inhibitors is a drug class effect that is effectively overcome by concurrent Bcl-xL or Bcl-2 inhibition. No other screening hits overcame stromal protection, and Bcl-xL outperformed Bcl-2 inhibition.
Our results are supported by previous data showing that Bcl-xL is involved in intrinsic MM cell line resistance (ie, in non-MCL-1–dependent cell lines) to A-1210477.5 Moreover, Bcl-xL expression levels and ectopic overexpression of Bcl-xL were linked to reduced activity of dual S63845 and venetoclax treatment.9 We showed that cells with high S63845 baseline sensitivity (OPM2, MCL-1 dependent; and KMS12BM, Bcl-2/MCL-1 codependent) similarly use Bcl-xL to handle prolonged MCL-1 inhibition. Analogous shifts of Bcl-2 family binding patterns have been reported in ABT-737–resistant MM cells.33 Surprisingly, Bcl-xL binding patterns differed as evidenced by the formation of increased Bcl-xL:BIM complexes in OPM2-S63845 and Bcl-xL:BAK complexes in KMS12BM-S63845 cells after treatment, which is in support of a dynamic regulation of the conformation and affinity status of Bcl-xL.34 The additionally observed complex formation between Bcl-xL and the proapoptotic sensitizer protein BAD demonstrates that future research studies should concentrate on the exploration of the functional relevance of different Bcl-xL binding partners in the establishment of MCL-1 inhibitor resistance. However, these are not the only factors that affect MCL-1 inhibitor resistance in view of the very heterogeneous alterations observed in this study.
Acquired resistance was associated with the deregulation of Bcl-2 family members. Both upregulation of antiapoptotic molecules and downregulation of proapoptotic molecules were observed. Upregulation of Bcl-2 in concert with Bcl-2:BIM complexes in KMS12BM-S63845 suggests that baseline BH3 dependencies drive the path to resistance. This possibility is also corroborated by similar Bcl-2 family adaptations in t(11;14)+ KMS12BM-S63845 and KMS12PE-CARF cells. The heterogeneous S63845 drug-resistance profile was supported by RNA-seq and drug screening results, which demonstrated a close association between parental and resistant cell lines. Only 1 compound (the dual Bcl-2/Bcl-xL inhibitor navitoclax) displayed significantly higher synergy scores in both resistant variants. This result demonstrated the dynamic interplay between all 3 major antiapoptotic molecules and was verified by the efficacy of dual Bcl-2/Bcl-xL targeting. On the contrary, several cell line– and status-specific combination partners were observed, such as an increased synergy of S63845 with IGF1R/PI3K/mTOR inhibitors in OPM2-S63845 cells. Concurrent treatment of OPM2-S63845 cells with autophagy inhibitors indeed surmounted resistance, but we were not able to link it to deregulation of autophagic flux (data not shown).
Our results demonstrating MCL-1 inhibitor cross-resistance in CARF-resistant cells add another level of complexity to the activity profile of MCL-1 inhibitors. This phenomenon is clearly linked to CARF-induced MDR1 expression and activity. Although MDR1+ MM cases are infrequently observed at diagnosis (<10% of patients), a striking increase of up to 80% positive cases after treatment with vincristine- and/or doxorubicin-based protocols, as well as strong expression of MDR1 in circulating plasma cells, has been reported.27,35 It is currently unknown whether certain agents of today’s MM treatment protocols lead to an upregulation of functional MDR1 in vivo. In addition, MCL-1 inhibitors are intensively tested in acute myeloid leukemia, which is marked by a high fraction of MDR1+ cases at diagnosis.36,37 Given the ease of MDR1 assessment via flow cytometry, we strongly recommend evaluating MDR1 surface expression (and activity) status before MCL-1 inhibitor therapy. In cases with MDR1 efflux, MCL-1 inhibitors that lack MDR1 substrate specificity (eg, AMG-176) or combination treatments that impair MDR1 activity should be considered.
Although our in vitro findings point to numerous novel modes of resistance, there is no doubt that our study was limited by the lack of adequate in vivo validation. Aside from the exploration of acquired MCL-1 inhibitor resistance in recently developed mouse models,13,38 in-depth analysis of patient samples is needed to determine the clinical impact of our results. If the ongoing early-phase testing of MCL-1 inhibitors in myeloma turns out to be successful, subsequent trials should analyze Bcl-2 family alterations in MM cells, modifications of stromal cells, and MDR-1–driven drug efflux after prolonged MCL-1 inhibitor treatment. Although MDR-1 was not upregulated in our S63845-resistance models, drug efflux appeared to contribute to the resistance observed in KMS12BM cells. Interestingly, the activity of other drug efflux–sensitive compounds (eg, CARF and panobinostat) was not affected in this cell line variant, suggesting a role for undisclosed drug pumps. Unbiased approaches, such as CRISPR/Cas9 screenings, are currently planned in our model systems to elucidate these additional, so far unrecognized, mediators of MCL-1 inhibitor resistance in myeloma.
All evidence taken together, we showed that baseline BH3 profiles drive acquired MCL-1 inhibitor resistance that leads to a heterogeneous deregulation of Bcl-2 family proteins. Interestingly, both steady-state alterations (eg, increased Bcl-2:BIM complexes) and dynamic alterations (Bcl-xL binding after S63845 treatment) are involved. BH3 mimetics are the most promising combination partners to enhance the efficacy of (or overcome resistance to) MCL-1 inhibitors, and Bcl-xL inhibitors typically outperform venetoclax. In addition, most MCL-1 inhibitors are prone to drug efflux–mediated resistance. This arsenal of evasion strategies by myeloma cells stresses the importance of identifying tumor-specific adaptations for the future implementation of optimized, precision medicine–guided treatment approaches.
Acknowledgments
The authors thank Christina Pfeiffer, Waltraud Scherbler, Anja Schneller, Maiju-Emilia Huppunen, and Minna Suvela for excellent technical assistance; the FIMM Technology Centre (TC) High Throughput Biomedicine Unit for preparation of drug plates (Laura Turunen, Jani Saarela); FIMM TC NGS Transcriptomics Service for sequencing; and the patients for the use of their samples in this study.
This work was supported by the Austrian Forum against Cancer, a hematology research grant from the Austrian Society of Hematology and Oncology (ÖGHO) (A. Bolomsky), the Academy of Finland (grant 1320185), the Cancer Society of Finland and Sigrid Jusélius Foundation (C.A.H.); and ERC starting grant 716063 (A.M., J.T.).
Authorship
Contribution: A. Bolomsky designed the study, performed the experiments, analyzed and interpreted the data, and wrote the paper; J.J.M., A.M., A. Besse, and L.B., designed and performed the experiments, analyzed and interpreted the results, and essentially contributed to the final manuscript draft; J.H., S.F., H.B., A.P., J.T.H. and K.K., performed the experiments and analyzed and interpreted the results; S.K., J.C., W.H., C.D., J.T., C.A.H., and H.L. designed the study, provided essential support and resources, and analyzed and interpreted the data; M.S. and N.Z. provided patient samples and data; and all authors participated in the writing of the manuscript and approved the final version.
Conflict-of-interest disclosure: The authors declare no competing financial interests.
Correspondence: Heinz Ludwig, Wilhelminen Cancer Research Institute, Department of Medicine I, Wilhelminenspital, Montleartstraße 37, 1160 Vienna, Austria; e-mail: heinz.ludwig@wienkav.at.

