

Key Points
TIMPs impact the BM niche characteristics in hematopoiesis.
TIMP-deficient BM niche has reduced LepR+ cells and excessive soluble CXCL12.

Abstract
Bone marrow (BM) is the primary site of hematopoiesis and is responsible for a lifelong supply of all blood cell lineages. The process of hematopoiesis follows key intrinsic programs that also integrate instructive signals from the BM niche. First identified as an erythropoietin-potentiating factor, the tissue inhibitor of metalloproteinase (TIMP) protein family has expanded to 4 members and has widely come to be viewed as a classical regulator of tissue homeostasis. By virtue of metalloprotease inhibition, TIMPs not only regulate extracellular matrix turnover but also control growth factor bioavailability. The 4 mammalian TIMPs possess overlapping enzyme-inhibition profiles and have never been studied for their cumulative role in hematopoiesis. Here, we show that TIMPs are critical for postnatal B lymphopoiesis in the BM. TIMP-deficient mice have defective B-cell development arising at the pro-B-cell stage. Expression analysis of TIMPless hematopoietic cell subsets pointed to an altered B-cell program in the Lineage−Sca-1+c-Kit+ (LSK) cell fraction. Serial and competitive BM transplants identified a defect in TIMP-deficient hematopoietic stem and progenitor cells for B lymphopoiesis. In parallel, reverse BM transplants uncovered the extrinsic role of stromal TIMPs in pro- and pre-B-cell development. TIMP deficiency disrupted CXCL12 localization to LepR+ cells, and increased soluble CXCL12 within the BM niche. It also compromised the number and morphology of LepR+ cells. These data provide new evidence that TIMPs control the cellular and biochemical makeup of the BM niche and influence the LSK transcriptional program required for optimal B lymphopoiesis.
Introduction
B cells produce antibodies against foreign antigens, providing the specificity to humoral immunity. Abnormal B-cell function underlies diseases related to immunodeficiency and autoimmunity.1 B cells are generated in the bone marrow (BM) from precursors called common lymphoid progenitors (CLPs), which originate from hematopoietic stem cells (HSCs). The development of B cells is accomplished by passing through multiple progenitor steps. CLPs subsequently give rise to pro-pre- (fraction A), pro- (fraction B/C/C′), pre- (fraction D), and immature B-cell populations, and the latter migrate into the peripheral lymphoid organs.2 Once they encounter an antigen, B cells become activated and differentiate into antibody-producing plasma cells.
B-cell progenitors are defined by the extent of immunoglobulin gene rearrangement and are phenotypically identified by expression of specific cell-surface markers.2,3 B-cell development is regulated by cell-autonomous and -extrinsic “niche” cues with each progenitor stage requiring a specific set of growth factors.2,4 BM mesenchymal cells are a physiological source of CXCL12 and interleukin 7 (IL7) for B-cell progenitors.5,6 Pro-B cells localize to the vicinity of CXCL12+IL7+ mesenchymal cells, where CXCL12-CXCR4 signals facilitate pro-B-cell retention. IL7 signaling in turn promotes CXCR4 and focal adhesion kinase expression in pro-B cells and also activates signals for survival, proliferation, and inhibition of differentiation.6,7 In early pre-B cells, pre-B-cell receptor signaling further increases CXCR4 expression and lowers focal adhesion kinase–mediated adhesion to stroma. Consequently, pre-B cells mobilize and spend less time in the proximity of mesenchymal cells, which attenuates IL7 signaling. The BM tissue matrix provides a scaffold for resident cells and serves both as a source and a sink for growth factors and chemokines, providing a controlled environment for regulated cell survival, growth, and function.8
Metalloproteases, including matrix metalloproteinases (MMPs) and a disintegrin and metalloproteinases (ADAMs), degrade matrix proteins and process growth factors to regulate cell behavior during immune responses,9 and their 4 tissue inhibitors (tissue inhibitor of metalloproteinases [TIMPs]) endogenously control the processing of such substrates.10 The metalloprotease-TIMP axis is implicated in CXCL12 bioactivity, and also impinges on hematopoiesis within the BM niche.11-14 Yet, it is vastly understudied. The known redundancy of TIMPs over the multitude of metalloproteases, and their underlying array of substrates, produces a biological complexity that remains unresolved for most tissues. A compound deletion of all TIMPs has highlighted the skeletal system as having one of the most affected tissues with phenotypes of low bone mass and abnormal bone isometry.15,16 Here, we demonstrate that the complete absence of TIMPs in mice (TIMPless mice) results in a B-cell developmental defect that culminates in low B-cell numbers in the BM from an early age. The reduced B-lymphopoiesis potential of TIMPless hematopoietic cells is observed in wild-type (WT) BM, and a TIMP-deficient niche is also detrimental for pro- and pre-B-cell progenitors. We attribute the underlying mechanism of the TIMP-deficient environment to CXCL12 mislocalization and an LepR+ population dearth in the BM.
Methods
Mice and tissue analysis
Timp genetic mice are pure C57BL/6 background and genotyped by polymerase chain reaction (PCR) (supplemental Table 1). TIMPless mice are born at a lower rate (∼20%) and fail to thrive past 3 to 4 weeks with even fewer surviving >8 weeks of age. NOD/SCID or BoyJ mice were used in transplantation studies. Mice were housed and cared for, and experiments were performed, following the protocols approved by the Animal Care Committee of the Ontario Cancer Institute, which follows the guidelines established by the Canadian Council for Animal Care. Mice were euthanized by CO2 asphyxiation. Dissected bones were fixed in neutral-buffered formalin (48 hours; room temperature [RT]) prior to decalcification in 14% EDTA; they were paraffin embedded, sectioned (4 μm), and stained. High-resolution micro–computed tomography imaging of hind limbs was performed as described previously.15 Immunofluorescence was performed following Kusumbe et al17 using antibodies listed in supplemental Table 2. Pregnant mice were euthanized on embryonic day 15.5 (E15.5) and fetal livers were manually disrupted through a 40-μm filter. Blood was collected by cardiac puncture: red blood cells (RBCs) were lysed, and the cells were stained and then analyzed by flow cytometry. Blood was taken from the saphenous vein for RBCs; platelets were enumerated using VetScan HM5.
BM cell preparation, flow cytometry, and transplants
Femurs and tibiae were crushed in phosphate-buffered saline and the filtrate (BM soluble fraction) used for CXCL12 and IL7 enzyme-linked immunosorbent assay (ELISA). After RBC lysis, cells were stained with antibodies (supplemental Table 3) for 20 minutes on ice and analyzed on a BD LSRFortessa flow cytometer. Cells sorted using BD FACSAria II-SC were collected into culture media or TRIzol for RNA extraction. For transplants, BM from donor mice was injected into the tail vein of irradiated (6 and 5 Gy, 2 hours apart; 24 hours prior to injection) recipients and given enrofloxacin (Baytril) in water. Tail blood and/or BM were analyzed by flow cytometry. A single-cell suspension from BM was stained with LepR-biotin antibody and conjugated secondary antibody for flow cytometric analysis following Zhou et al.18
Gene expression and statistical analysis
RNA extracted from sorted B cells, stromal cells, CLPs, and Lineage−Sca-1+c-Kit+(LSK) cells were converted into complementary DNA and subjected to Microarrays (Affymetrix oligonucleotide GeneChip Mouse Gene 2.0 ST; raw CEL files preprocessed by the robust multiarray average algorithm are available at Gene Expression Omnibus). Statistical analyses included linear modeling (limma package), standard error (Bayesian moderation based on an all model-based Student t test19 ), and false discovery rate (FDR) adjustment.20 Differentially expressed genes were identified (FDR < 0.25) and Volcano plots created (latticeExtra and BPG21 packages). Gene-ontology terms were used to identify genes involved in B-cell development (ie, proliferation, differentiation); genes of interest mapped to the data matrix (P < .05, 2-tailed Student t test) and heatmaps depicting z scores were created (pheatmap R package). Pathways were analyzed using g:GOSt in the g:profiler Web database (build 2017-06-20). Significantly enriched pathways (hypergeometric test; FDR < 0.05) were visualized using Cytoscape. Primers used for quantitative reverse transcription PCR and droplet digital PCR (ddPCR) are in supplemental Table 4. ddPCR was performed using the QX200-ddPCR system with EvaGreen dye and Quanta-Soft software. For quantitative reverse transcription PCR, we used SYBR Green reagent and normalized to β-actin.
Spleen cell functional assays
Single-cell suspensions of splenocytes from 4-week-old mice were cultured in RPMI1640 plus 5% fetal bovine serum plus 50 µM β-mercaptoethanol media (37°C, 5% CO2) with/without cell death-inducing cues heat shock (42°C, 10 minutes), irradiation (1-2 Gy), and dexamethasone (0.1 nM). After 24 hours, cells were stained for surface markers and 4′,6-diamidino-2-phenylindole and analyzed by flow cytometry. Splenocytes were labeled with carboxyfluorescein diacetate succinimidyl ester (CFSE) (5 µM, 10 minutes), washed, and cultured for 4 days with stimulants (lipopolysaccharide [LPS], 25 µg/mL; IL4, 50 ng/mL); the proliferation index was calculated using FlowJo software.22,23 ELISA plates were coated with antibody (5 µg/mL), washed, and blocked (3% fetal calf serum in phosphate-buffered saline, 1 hour, RT). Samples/standards (immunoglobulin G1 [IgG1] and IgM) were added and incubated (1 hour, RT). Detection antibodies (1/2000 dilution) were added (2 hours, RT) and read at 450 nm. Serum concentrations of IgG and IgM were interpolated using a standard curve.
Cell culture and CXCL12 measurement
We compared several protocols for BM-derived stromal cell (BMSC) generation and selected the one by Cen et al24 because it produced adequate stromal cell growth while minimizing immune cell contamination. Briefly, 20 × 106 BM cells were plated (75-cm2 flasks, complete OPTI media) with overnight adhesion with weekly media changes. CXCL12 and IL7 (R&D Systems) were analyzed by sandwich ELISA following the manufacturer’s protocol. Fluorescence-activated cell sorted (FACS) pro-B cells (CD19+IgD−IgM−B220+CD43+) from BM were cultured in a 96-well plate (5 × 10³ to 10 × 103 cells per well) in complete OPTI media containing 1/200 IL7 (a gift from Christopher Paige, University Health Network, Toronto, ON, Canada) and conditioned media from plates of equally numbered BMSCs. Cells were collected after 6 days for analysis. For B-cell migration, 106 BM cells were plated on the upper Transwell chamber (6.5-mm insert; 5-μm pore polycarbonate membrane) in a 24-well plate, with media plus 100 ng/mL recombinant CXCL12 (rCXCL12; R&D Systems) or BMSC culture supernatant in the bottom chamber. Cells were analyzed by a flow cytometer after 3 hours.
Results
TIMPless BM has reduced B-cell number and progenitors
Our previously established breeding strategy15 produced experimental mouse cohorts lacking either all 4 Timps (quadruple knockout [QT]: Timp1−/−Timp2−/−Timp3−/−Timp4−/−) or harboring a single Timp3 allele (QT3+/−: Timp1−/−Timp2−/−Timp3+/−Timp4−/−) (Figure 1A); the QT and QT3+/− groups are also called TIMPless or TIMP-deficient, respectively. QT mice have a short lifespan, retarded postnatal growth, loss of trabeculae in the long bones (Figure 1B-E), and altered BM structure and cellularity (Figure 1D). Flow cytometry profiling of BM showed no major differences in total BM cell numbers, long-term HSCs, and short-term HSCs in 4-week-old WT and QT mice (supplemental Figure 1A-D). Multipotent progenitors, lymphoid-primed multipotent progenitors, and CLPs were also comparable (supplemental Figure 1E), and there were no significant differences in erythroid and megakaryocyte progenitor cells (supplemental Figure 1F-H). The enumeration of lymphoid cells indicated reduced frequency and number of B cells in QT3+/− and QT vs WT. The total myeloid cell count was unchanged, and the relative increase of myeloid cells was likely due to lower B-cell frequency (Figure 1F-G; supplemental Figure 2A). A marked decline in B-cell progenitors and pro-B-cell and pre-B-cell percentage as well as pre-B-cell number was noted in these young QT3+/− mice (Figure 1H-I; supplemental Figure 2B).
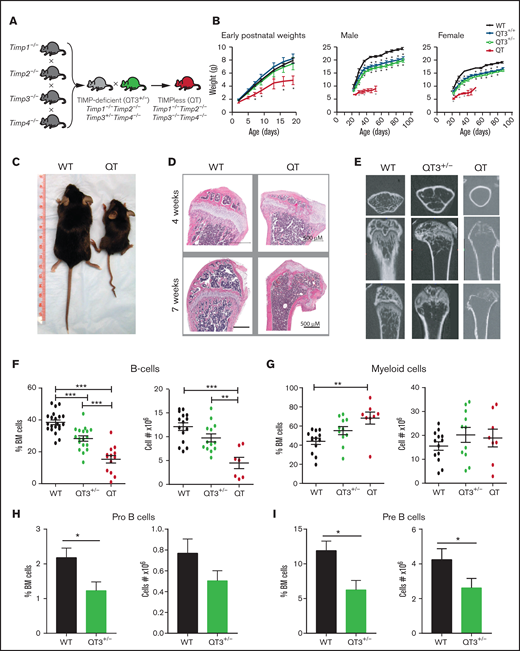
Abnormal BM composition in TIMP-compromised mice. (A) Breeding strategy to generate QT3+/− and QT mice. (B) Growth curves of: left, young WT (n = 12), QT3+/+ (n = 7), QT3+/− (n = 6), and QT mice (n = 5); middle, adult male WT (n = 6), QT3+/+ (n = 12), QT3+/− (n = 12), and QT (n = 4) mice; and right, adult female WT (n = 10), QT3+/+ (n = 10), QT3+/− (n = 11), and QT (n = 2) mice. QT pups are indistinguishable from their littermates at birth but show growth restriction by 5 days of age. Male and female QT mice are runted and have shortened lifespans. Data points are the mean plus or minus standard error of the mean (SEM). Statistics by 1-way analysis of variance (ANOVA) with *P < .05. (C) Representative image of WT and QT mice at 7 weeks of age. (D) Sagittal tibiae sections from 4-week-old mice (top panel) and sagittal femoral sections from 7-week-old mice (bottom panel) stained with hematoxylin and eosin (H&E); scale bar, 500 μm. (E) Isosurface rendering of femurs from 7-week-old mice using high-resolution micro–computed tomography imaging highlights the partial loss of trabecular bone in QT3+/− mice and complete loss in QT mice. Top panels, transverse view; middle and bottom panels, planer views at different depth. (F) Percentage (left) and total number (right) of live B-cell (B220+) in WT (percentage, n = 21; cell number, n = 15), QT3+/− (percentage, n = 18; cell number, n = 13), and QT (percentage, n = 13; cell number, n = 7) BM from 4-week-old littermates. Statistics by 1-way ANOVA; individual data points are shown as well as the mean plus or minus SEM with **P < .01, and ***P < .001. (G) Percentage (left) and total number (right) of CD11b+Gr-1+ myeloid cells in WT (n = 13), QT3+/− (n = 11), and QT (n = 8) BM from 4-week-old mice. Statistics by 1-way ANOVA; data represent mean plus or minus SEM with ***P < .001. (H) Percentage and total pro-B-cell in BM of 4- to 5-week old WT (n = 11) and QT3+/− (n = 10) mice. Statistics by the Student t test; data represent mean plus or minus SEM with *P < .05. (I) Percentage and total pre-B-cell in BM of 4- to 5-week old WT (n = 11) and QT3+/− (n = 10) mice. Statistics by the Student t test; data represent mean plus or minus SEM with *P < .05.
Abnormal BM composition in TIMP-compromised mice. (A) Breeding strategy to generate QT3+/− and QT mice. (B) Growth curves of: left, young WT (n = 12), QT3+/+ (n = 7), QT3+/− (n = 6), and QT mice (n = 5); middle, adult male WT (n = 6), QT3+/+ (n = 12), QT3+/− (n = 12), and QT (n = 4) mice; and right, adult female WT (n = 10), QT3+/+ (n = 10), QT3+/− (n = 11), and QT (n = 2) mice. QT pups are indistinguishable from their littermates at birth but show growth restriction by 5 days of age. Male and female QT mice are runted and have shortened lifespans. Data points are the mean plus or minus standard error of the mean (SEM). Statistics by 1-way analysis of variance (ANOVA) with *P < .05. (C) Representative image of WT and QT mice at 7 weeks of age. (D) Sagittal tibiae sections from 4-week-old mice (top panel) and sagittal femoral sections from 7-week-old mice (bottom panel) stained with hematoxylin and eosin (H&E); scale bar, 500 μm. (E) Isosurface rendering of femurs from 7-week-old mice using high-resolution micro–computed tomography imaging highlights the partial loss of trabecular bone in QT3+/− mice and complete loss in QT mice. Top panels, transverse view; middle and bottom panels, planer views at different depth. (F) Percentage (left) and total number (right) of live B-cell (B220+) in WT (percentage, n = 21; cell number, n = 15), QT3+/− (percentage, n = 18; cell number, n = 13), and QT (percentage, n = 13; cell number, n = 7) BM from 4-week-old littermates. Statistics by 1-way ANOVA; individual data points are shown as well as the mean plus or minus SEM with **P < .01, and ***P < .001. (G) Percentage (left) and total number (right) of CD11b+Gr-1+ myeloid cells in WT (n = 13), QT3+/− (n = 11), and QT (n = 8) BM from 4-week-old mice. Statistics by 1-way ANOVA; data represent mean plus or minus SEM with ***P < .001. (H) Percentage and total pro-B-cell in BM of 4- to 5-week old WT (n = 11) and QT3+/− (n = 10) mice. Statistics by the Student t test; data represent mean plus or minus SEM with *P < .05. (I) Percentage and total pre-B-cell in BM of 4- to 5-week old WT (n = 11) and QT3+/− (n = 10) mice. Statistics by the Student t test; data represent mean plus or minus SEM with *P < .05.
Beyond the BM, B-cell numbers were unchanged in the fetal (E15.5) QT3+/− and QT compared with WT livers (supplemental Figure 2C). In the spleen, B-cell percentage was lower at 4 but not 8 weeks in these groups (supplemental Figure 2D), whereas the number of total B cells in blood remained comparable (supplemental Figure 2E). T-cell subsets were unchanged in the thymus of QT3+/− (supplemental Figure 2F). In 4- to 5-month-old mice, analysis of WT and QT3+/− peripheral blood showed no difference in total white cell count, RBCs, platelets, and myeloid cells, although an increase in B-cell frequency and a decrease in T-cell frequency was noted (supplemental Figure 3A). In the spleen, myeloid cell frequency was lower with no difference in lymphoid cells. Finally, lymph nodes had comparable immune cell populations in these mice (supplemental Figure 3B).
BM analysis was performed in 1-, 2-, 6-, and 24-month-old mice. As expected with aging,25 B-cell frequency and total cell number declined sharply by 6 months while myeloid cells increased in both WT and QT3+/− groups (Figure 2A). Interestingly, 1-month-old QT mice had fewer B cells than 24-month-old WT, whereas their myeloid cell number was comparable. Examination of B-cell developmental stages revealed that a TIMP-deficient state resulted in decreased fraction B and C and C′ as early as 1 month of age (Figure 2B-C; supplemental Figure 4A-C). QT mice are not amenable to analysis after 2 months due to their short lifespan. These data demonstrate the necessity of TIMPs for normal B lymphopoiesis from an early age.
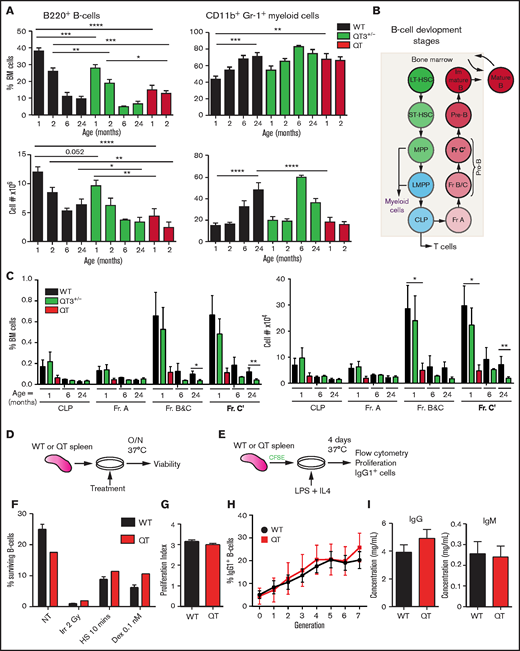
B-cell defect detectable in fraction B and C in TIMPless mice. (A) Percentage (top) and total number (bottom) of live B220+ B cells and CD11b+Gr-1+ myeloid cells in the BM (2 femurs and 2 tibiae) WT, QT3+/−, and QT mice of different ages. Mature B cell as a percentage of total BM cells is shown for WT (1 month, n = 21; 2 months, n = 17; 6 months, n = 2; 24 months, n = 7), QT3+/− (1 month, n = 18; 2 months, n = 13; 6 months, n = 2; 24 months, n = 10), and QT (1 month, n = 13; 2 months, n = 8) BM. The absolute number (bottom) of live B220+ B cells in WT (1 month, n = 15; 2 months, n = 12; 6 months, n = 2; 24 months, n = 7), QT3+/− (1 month, n = 13; 2 months, n = 9; 6 months, n = 2; 24 months, n = 10), and QT (1 month, n = 7; 2 months, n = 3) BM. The B-cell percentage data were compared for using the ANOVA Bonferroni multiple comparisons test (1-month WT vs QT3+/−, QT3+/− vs QT) and the 2-tailed unpaired Student t test (2-month WT vs QT3+/−, QT3+/− vs QT). Absolute B-cell numbers were compared using Sidak multiple comparison (1-month WT vs QT, 2-month WT vs QT) and the 2-tailed unpaired Student t test (1-month WT vs QT3+/−, 24-month WT vs QT3+/−). For both, data represent mean plus or minus SEM with *P < .05, **P < .01, and ***P < .001, and ****P < .0001. (B) Schematic of B-cell developmental stages from HSCs in BM. (C) Percentage (left) and absolute number (right) of B-cell developmental fractions (Fr.) in WT, QT3+/−, and QT BM. These values are for 1 month (WT, n = 8; QT3+/−, n = 9; QT, n = 4), 6 month (WT, n = 2; QT3+/−, n = 2), and 24 months (WT, n = 4; QT3+/−, n = 7) old mice. Data represent mean plus or minus SEM and statistical comparison was by 2-way ANOVA using the Sidak multiple comparisons test between the age groups; *P < .05 and **P < .01. (D) Schematic showing the experimental method for assessing in vitro response of B cells to cell death cues. Splenic B cells were plated with a variety of death-inducing cues and incubated overnight (O/N) at 37°C before viability analysis by flow cytometry. (E) Schematic showing the experimental method for assessing proliferation of splenic B cells in response to LPS, as well as class switch recombination in response to IL4. Splenic B cells were dyed with CFSE before plating with LPS and IL4. After 4 days of culture at 37°C, CFSE levels and the number of IgG1+ cells were determined by flow cytometry. (F) B-cell response to death-inducing cues, including no treatment (NT), irradiation at 2 Gy (Irr), heat shock for 10 minutes (HS), and dexamethasone at a concentration of 0.1 nM (Dex 0.1 nM). This graph represents WT n = 3 and QT n = 1, but this experiment was repeated with slightly different conditions each time for a total of WT n = 9 and QT n = 3. (G) Proliferation index (average number of divisions undergone by a cell) of WT and QT splenocytes after 4 days in culture with LPS and IL4 (schematic shown in panel E). WT (n = 6), QT (n = 2); statistics by the unpaired Student t test. (H) Class switch recombination of splenocytes to IgG1+ cells throughout 7 generations, plotted as the frequency of cells that expressed IgG1 per generation. WT (n = 6), QT (n = 2), each in technical triplicate. Statistics by 2-way ANOVA. (I) Serum levels of IgG and IgM of 4-week-old mice as measured by ELISA. WT (n = 5), QT (n = 5); statistics by the unpaired Student t test. LMPP, lymphoid-primed multipotent progenitor; LT-HSC, long-term HSC; MPP, multipotent progenitor; ST-HSC, short-term HSC.
B-cell defect detectable in fraction B and C in TIMPless mice. (A) Percentage (top) and total number (bottom) of live B220+ B cells and CD11b+Gr-1+ myeloid cells in the BM (2 femurs and 2 tibiae) WT, QT3+/−, and QT mice of different ages. Mature B cell as a percentage of total BM cells is shown for WT (1 month, n = 21; 2 months, n = 17; 6 months, n = 2; 24 months, n = 7), QT3+/− (1 month, n = 18; 2 months, n = 13; 6 months, n = 2; 24 months, n = 10), and QT (1 month, n = 13; 2 months, n = 8) BM. The absolute number (bottom) of live B220+ B cells in WT (1 month, n = 15; 2 months, n = 12; 6 months, n = 2; 24 months, n = 7), QT3+/− (1 month, n = 13; 2 months, n = 9; 6 months, n = 2; 24 months, n = 10), and QT (1 month, n = 7; 2 months, n = 3) BM. The B-cell percentage data were compared for using the ANOVA Bonferroni multiple comparisons test (1-month WT vs QT3+/−, QT3+/− vs QT) and the 2-tailed unpaired Student t test (2-month WT vs QT3+/−, QT3+/− vs QT). Absolute B-cell numbers were compared using Sidak multiple comparison (1-month WT vs QT, 2-month WT vs QT) and the 2-tailed unpaired Student t test (1-month WT vs QT3+/−, 24-month WT vs QT3+/−). For both, data represent mean plus or minus SEM with *P < .05, **P < .01, and ***P < .001, and ****P < .0001. (B) Schematic of B-cell developmental stages from HSCs in BM. (C) Percentage (left) and absolute number (right) of B-cell developmental fractions (Fr.) in WT, QT3+/−, and QT BM. These values are for 1 month (WT, n = 8; QT3+/−, n = 9; QT, n = 4), 6 month (WT, n = 2; QT3+/−, n = 2), and 24 months (WT, n = 4; QT3+/−, n = 7) old mice. Data represent mean plus or minus SEM and statistical comparison was by 2-way ANOVA using the Sidak multiple comparisons test between the age groups; *P < .05 and **P < .01. (D) Schematic showing the experimental method for assessing in vitro response of B cells to cell death cues. Splenic B cells were plated with a variety of death-inducing cues and incubated overnight (O/N) at 37°C before viability analysis by flow cytometry. (E) Schematic showing the experimental method for assessing proliferation of splenic B cells in response to LPS, as well as class switch recombination in response to IL4. Splenic B cells were dyed with CFSE before plating with LPS and IL4. After 4 days of culture at 37°C, CFSE levels and the number of IgG1+ cells were determined by flow cytometry. (F) B-cell response to death-inducing cues, including no treatment (NT), irradiation at 2 Gy (Irr), heat shock for 10 minutes (HS), and dexamethasone at a concentration of 0.1 nM (Dex 0.1 nM). This graph represents WT n = 3 and QT n = 1, but this experiment was repeated with slightly different conditions each time for a total of WT n = 9 and QT n = 3. (G) Proliferation index (average number of divisions undergone by a cell) of WT and QT splenocytes after 4 days in culture with LPS and IL4 (schematic shown in panel E). WT (n = 6), QT (n = 2); statistics by the unpaired Student t test. (H) Class switch recombination of splenocytes to IgG1+ cells throughout 7 generations, plotted as the frequency of cells that expressed IgG1 per generation. WT (n = 6), QT (n = 2), each in technical triplicate. Statistics by 2-way ANOVA. (I) Serum levels of IgG and IgM of 4-week-old mice as measured by ELISA. WT (n = 5), QT (n = 5); statistics by the unpaired Student t test. LMPP, lymphoid-primed multipotent progenitor; LT-HSC, long-term HSC; MPP, multipotent progenitor; ST-HSC, short-term HSC.
Mature B cells in TIMPless mice are not functionally defective
Given the consistently reduced B-cell population in TIMP-deficient mice, we next determined whether TIMP loss affects B-cell function using splenic B cells from 4-week-old WT and TIMPless mice; we evaluated response to death-inducing cues, proliferation in response to LPS, ability to undergo class switch recombination to IgG1, and ability to secrete immunoglobulins IgG and IgM (Figure 2D-I). There was no difference in splenocyte survival against irradiation, heat shock, or dexamethasone (Figure 2F). B-cell proliferation using CFSE dye23 was comparable (Figure 2G). The frequency of B cells that underwent class switch recombination to IgG1 with each subsequent generation of cell division also remained comparable (Figure 2H). Finally, the baseline serum IgG and IgM levels in WT and TIMPless mice showed no difference (Figure 2I). This indicates that the B-cell defect in TIMPless mice is restricted to total B-cell and progenitor counts, but not to mature B-cell functional capacity.
TIMP-deficient BM is less competent at B lymphopoiesis
We next performed competitive transplants to compare the B-cell output of BM from 1-month (young) and 24-month (old) mice, using NOD/SCID recipients: 1-month-old WT or QT3+/−, and 2-year-old WT or QT3+/−, were compared against a common WT competitor (1 month, CD 45.1; Figure 3A). Peripheral blood lymphoid and myeloid cell number at 4 and 20 weeks posttransplantation showed that both WT and QT3+/− donors contributed less to the B-cell lineage and more to the myeloid lineage with age (Figure 3B-C). Importantly, the contribution from young QT3+/− donors to B-cell (but not myeloid) lineage was significantly lower at 4- and 20-week time points than WT. This phenotype was not seen in aged QT3+/− donors, which showed a comparable B-cell output to their WT controls. A colony-forming assay showed reduced B lymphopoiesis in vitro by young TIMP-deficient BM (Figure 3D-E), whereas granulocytic clonogenicity remained unchanged. Therefore, the lineage potential of TIMP-deficient BM is skewed away from the B-cell lineage at an early age.
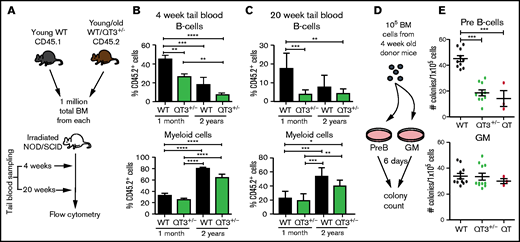
TIMP-deficient BM cells have reduced B-lymphopoiesis potential. (A) Schematic of experimental pipeline for competitive BM transplant. (B) Percentage of QT3+/− donor’s B cells (of total B cells) or myeloid cells (of total myeloid cells) in tail vein blood of recipient mice, 4 weeks after either young WT (n = 9), young QT3+/− (n = 10), old WT (n = 8), or old QT3+/− (n = 16) donor BM transplant. Statistics by 1-way ANOVA; data represent mean plus or minus SEM; **P < .01, ***P < .001, and ****P < .0001 by the Bonferroni multiple comparisons test. (C) Percentage of experimental donor (CD45.2+) B cells (top) or myeloid cells (bottom) in recipient tail blood at 20 weeks posttransplant, having received either young WT (n = 8), young QT3+/− (n = 8), old WT (n = 3), or old QT3+/− (n = 5) BM. For both statistics by 1-way ANOVA; data represent mean plus or minus SEM; *P < .05, **P < .01, and ***P < .001 by the Bonferroni multiple comparisons test. (D) Schematic outline of methylcellulose colony-forming assay, using either pre-B or granulocyte/macrophage (GM) supporting media. (E) The number of pre-B-cell and GM colonies that developed in 6 days per 1 × 10⁵ BM cells from 4-week-old mice (WT, n = 10; QT3+/−, n = 10; QT, n = 3). Statistics by 1-way ANOVA; individual data points are shown as well as the mean plus or minus SEM; ***P < .001 by the Bonferroni multiple comparisons test.
TIMP-deficient BM cells have reduced B-lymphopoiesis potential. (A) Schematic of experimental pipeline for competitive BM transplant. (B) Percentage of QT3+/− donor’s B cells (of total B cells) or myeloid cells (of total myeloid cells) in tail vein blood of recipient mice, 4 weeks after either young WT (n = 9), young QT3+/− (n = 10), old WT (n = 8), or old QT3+/− (n = 16) donor BM transplant. Statistics by 1-way ANOVA; data represent mean plus or minus SEM; **P < .01, ***P < .001, and ****P < .0001 by the Bonferroni multiple comparisons test. (C) Percentage of experimental donor (CD45.2+) B cells (top) or myeloid cells (bottom) in recipient tail blood at 20 weeks posttransplant, having received either young WT (n = 8), young QT3+/− (n = 8), old WT (n = 3), or old QT3+/− (n = 5) BM. For both statistics by 1-way ANOVA; data represent mean plus or minus SEM; *P < .05, **P < .01, and ***P < .001 by the Bonferroni multiple comparisons test. (D) Schematic outline of methylcellulose colony-forming assay, using either pre-B or granulocyte/macrophage (GM) supporting media. (E) The number of pre-B-cell and GM colonies that developed in 6 days per 1 × 10⁵ BM cells from 4-week-old mice (WT, n = 10; QT3+/−, n = 10; QT, n = 3). Statistics by 1-way ANOVA; individual data points are shown as well as the mean plus or minus SEM; ***P < .001 by the Bonferroni multiple comparisons test.
Microarrays reveal aberrant transcription factor expression in the LSK fraction of TIMPless BM
We performed microarray expression profiling of FACS-purified B-cell, CLP, LSK, and stromal cell fractions from TIMPless and WT groups (Figure 4A). Distinct patterns of gene expression across all 4 cell types were observed (supplemental Figure 5A). B cells displayed the highest number of significantly altered genes between WT and QT cohorts, as evident in volcano plots and a Venn diagram (Figure 4B-C). Manual inspection of 207 B-cell lineage hallmark gene-ontology term genes showed 49 genes to be significantly altered in all fractions, with the highest number noted in the LSK fraction (which includes hematopoietic stem and progenitor cells [HSPCs]) (Figure 4D; supplemental Figure 5B). Gene-set enrichment analysis pointed to “B-cell receptor signaling” and “B-cell activation” as the core altered pathways in QT LSK (Figure 4E). We then confirmed downregulation of 3 candidate B-cell–related genes (VpreB, Ebf1, Rag1) in the QT LSK fraction by ddPCR (Figure 4F). Interrogation of transcription factors related to B-cell development revealed the following to be altered: Zbtb7a, Foxop1, Lef1, Ikzf3, Pou2f2, Myb, and Ebf1 in HSPCs; Stat5a, and Myb in CLPs; and Bcl6 and Bmi1 in the B cell (Figure 4D; supplemental Figure 5B). This list included many transcription factors known to play a key role in regulating early B-cell development, especially the pro- to pre-B-cell transition. These data suggest that TIMPless HSPCs may be compromised in B-cell programming.
![Altered gene-expression profile of TIMPless LSK cells to reduce B lymphopoiesis. (A) Schematic of experimental pipeline for microarray. (B) Volcano plot for differential messenger RNA (mRNA) abundance levels in the 4 cell compartments. x-axis (fold change [FC]), Coefficients from linear model in log2 scale; y-axis, P values adjusted for multiple testing. The dotted line depicts q value < 0.25. Genes with q value < 0.25 and absolute log2 [FC] > 2 are labeled directly on the graphs. (C) Venn diagram of significantly altered genes (q value < 0.25). (D) Heat map display of significantly altered B-cell–related genes in LSK cells. Asterisks mark transcription factors (WT, n = 3; QT, n = 3). (E) G:profiler pathway analysis visualized by Cytoscape using significant (q value < 0.25) genes in the LSK compartment. (F) mRNA levels of 3 candidate B-cell–related genes in WT (n = 3) and QT (n = 3) LSK cells, relative to glucuronidase β (GusB) control mRNA, by ddPCR. Data represented as mean plus or minus SEM; statistics by the 2-tailed unpaired Student t test; **P < .01, and ***P < .001. FSC-A, forward scatter area; SSC-A, side scatter area.](https://ash.silverchair-cdn.com/ash/content_public/journal/bloodadvances/5/20/10.1182_bloodadvances.2020004101/1/m_advancesadv2020004101f4.png?Expires=1767724082&Signature=Ag4pq6uZA4vbZllv0vQAQeW90m0D4osvN7EY5Dib9r8jDj4sM7es1VxJfl6ys2TXY89LlmT92fjE~g5u4~acCs~paCHzVGBjXpoUqmfLZ6QDyzg6SLNEVa8SLuXeVOIHauglllJo~SjsKiWmcQyOfxZD3PiL5GCv8Lb-L8GM-QsUiE5tz-NpJZ1hpCx8AIFxAYMJNx90hpCzKOgndpf9eZcyS37KJtPmdU8G1Ts0B6LasfdZU2GE6NuyQE9RUBu2~C~QXeYCafT6mcGRyr8HINa9NJU-VKVkqGKb3cDlZSVNOUlSBWGrdqMYPeySnvY204FRlQGnnXwIUQU0pIDDwA__&Key-Pair-Id=APKAIE5G5CRDK6RD3PGA)
Altered gene-expression profile of TIMPless LSK cells to reduce B lymphopoiesis. (A) Schematic of experimental pipeline for microarray. (B) Volcano plot for differential messenger RNA (mRNA) abundance levels in the 4 cell compartments. x-axis (fold change [FC]), Coefficients from linear model in log2 scale; y-axis, P values adjusted for multiple testing. The dotted line depicts q value < 0.25. Genes with q value < 0.25 and absolute log2 [FC] > 2 are labeled directly on the graphs. (C) Venn diagram of significantly altered genes (q value < 0.25). (D) Heat map display of significantly altered B-cell–related genes in LSK cells. Asterisks mark transcription factors (WT, n = 3; QT, n = 3). (E) G:profiler pathway analysis visualized by Cytoscape using significant (q value < 0.25) genes in the LSK compartment. (F) mRNA levels of 3 candidate B-cell–related genes in WT (n = 3) and QT (n = 3) LSK cells, relative to glucuronidase β (GusB) control mRNA, by ddPCR. Data represented as mean plus or minus SEM; statistics by the 2-tailed unpaired Student t test; **P < .01, and ***P < .001. FSC-A, forward scatter area; SSC-A, side scatter area.
Altered gene-expression profile of TIMPless LSK cells to reduce B lymphopoiesis. (A) Schematic of experimental pipeline for microarray. (B) Volcano plot for differential messenger RNA (mRNA) abundance levels in the 4 cell compartments. x-axis (fold change [FC]), Coefficients from linear model in log2 scale; y-axis, P values adjusted for multiple testing. The dotted line depicts q value < 0.25. Genes with q value < 0.25 and absolute log2 [FC] > 2 are labeled directly on the graphs. (C) Venn diagram of significantly altered genes (q value < 0.25). (D) Heat map display of significantly altered B-cell–related genes in LSK cells. Asterisks mark transcription factors (WT, n = 3; QT, n = 3). (E) G:profiler pathway analysis visualized by Cytoscape using significant (q value < 0.25) genes in the LSK compartment. (F) mRNA levels of 3 candidate B-cell–related genes in WT (n = 3) and QT (n = 3) LSK cells, relative to glucuronidase β (GusB) control mRNA, by ddPCR. Data represented as mean plus or minus SEM; statistics by the 2-tailed unpaired Student t test; **P < .01, and ***P < .001. FSC-A, forward scatter area; SSC-A, side scatter area.
B-lymphopoiesis defect in TIMPless HSPCs is observed in a WT microenvironment
BM transplants are functional readouts of the lineage potential of primitive HSCs. To determine the cell-intrinsic role of TIMPs in immune cell generation, we transplanted TIMPless or WT BM (2 × 10⁶ cells, 4- to 5-week-old donors) into WT recipients (Figure 5A). After 16 weeks of primary transplantation, the numbers of both total and donor-derived BM cells in the recipients were comparable (Figure 5B). A marked reduction in B cells from TIMPless BM was observed, which was concomitant with decreased pro- and pre-B progenitor cells along with a percentage of fraction C′ (Figure 5C-D). A secondary transplant (16 week) of WT (WT→WT→WT) and TIMPless (QT→WT→WT) BM (Figure 5E) again revealed a decrease in QT total B cells (Figure 5F-H). Donor-derived myeloid cells were higher in both primary and secondary transplants (Figure 5C,G). Thus, TIMPless HSPCs are likely intrinsically defective.
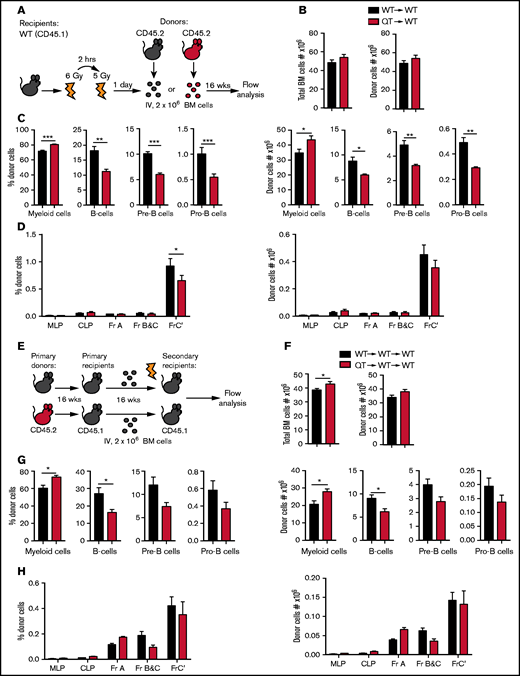
TIMPless HSCs have reduced B-lymphopoiesis potential in vivo. (A) Schematic showing the experimental procedure for WT or QT BM transplant into WT mice. WT recipient were irradiated twice and 2 million BM cells from donor mice were injected IV. Recipient BM were analyzed by flow cytometry 16 weeks later. (B) Total BM cells (left panel) and donor-derived (CD45.2+) total BM cell (right panel), 16 weeks posttransplantation, in recipient mice (WT→WT, n = 5; QT→WT, n = 4). Data represent mean plus or minus SEM; groups were compared by the unpaired Student t test; *P < .05, **P < .01, and ***P < .001. (C) Percentage (left panel) and absolute count (right panel) of donor-derived (CD45.2+), CD11b+Gr-1+ myeloid cells, B cells, pre-B and pro-B cells, from the experiment in panel B. Data represent mean plus or minus SEM; groups were compared by the unpaired Student t test; *P < .05, **P < .01, and ***P < .001. (D) Percentage (left) and absolute number (right) of cells in the B-cell developmental fractions multilineage progenitor (MLP), CLP , Fr-A, Fr-B and C, Fr-C′ of transplanted cells (CD45.2+), from the experiment in panel B. Data represent mean plus or minus SEM; groups were compared by 2-way ANOVA; *P < .05. (E) Schematic showing the experimental procedure for secondary BM transplant. Transplanted BM of WT or QT from WT primary recipient subsequently injected into irradiated secondary WT recipient. Total 2 million BM cells transplanted into secondary recipient and analyzed by flow cytometry 16 weeks later. (F) Total BM cells (left panel) and donor-derived (CD45.2+) total BM cells count (right panel), 16 weeks postsecondary transplantation, in recipient mice (WT→WT→WT, n = 4; QT→WT→WT, n = 5). Data represent mean plus or minus SEM; WT or QT groups were compared by the unpaired Student t test; *P < .05. (G) Percentage (left panel) and absolute count (right panel) of donor-derived (CD45.2+), CD11b+Gr-1+ myeloid cells, B cells, pre-B-cell and pro-B cell, from the experiment in panel F. Data represent mean plus or minus SEM; groups were compared by the unpaired Student t test; *P < .05. (H) Percentage (left) and absolute number (right) of B-cell developmental fractions MLP, CLP, Fr-A, Fr-B and C, Fr-C′ of transplanted cells in recipient mice from the experiment in panel F. Data represent mean plus or minus SEM; WT and QT groups were compared by 2-way ANOVA.
TIMPless HSCs have reduced B-lymphopoiesis potential in vivo. (A) Schematic showing the experimental procedure for WT or QT BM transplant into WT mice. WT recipient were irradiated twice and 2 million BM cells from donor mice were injected IV. Recipient BM were analyzed by flow cytometry 16 weeks later. (B) Total BM cells (left panel) and donor-derived (CD45.2+) total BM cell (right panel), 16 weeks posttransplantation, in recipient mice (WT→WT, n = 5; QT→WT, n = 4). Data represent mean plus or minus SEM; groups were compared by the unpaired Student t test; *P < .05, **P < .01, and ***P < .001. (C) Percentage (left panel) and absolute count (right panel) of donor-derived (CD45.2+), CD11b+Gr-1+ myeloid cells, B cells, pre-B and pro-B cells, from the experiment in panel B. Data represent mean plus or minus SEM; groups were compared by the unpaired Student t test; *P < .05, **P < .01, and ***P < .001. (D) Percentage (left) and absolute number (right) of cells in the B-cell developmental fractions multilineage progenitor (MLP), CLP , Fr-A, Fr-B and C, Fr-C′ of transplanted cells (CD45.2+), from the experiment in panel B. Data represent mean plus or minus SEM; groups were compared by 2-way ANOVA; *P < .05. (E) Schematic showing the experimental procedure for secondary BM transplant. Transplanted BM of WT or QT from WT primary recipient subsequently injected into irradiated secondary WT recipient. Total 2 million BM cells transplanted into secondary recipient and analyzed by flow cytometry 16 weeks later. (F) Total BM cells (left panel) and donor-derived (CD45.2+) total BM cells count (right panel), 16 weeks postsecondary transplantation, in recipient mice (WT→WT→WT, n = 4; QT→WT→WT, n = 5). Data represent mean plus or minus SEM; WT or QT groups were compared by the unpaired Student t test; *P < .05. (G) Percentage (left panel) and absolute count (right panel) of donor-derived (CD45.2+), CD11b+Gr-1+ myeloid cells, B cells, pre-B-cell and pro-B cell, from the experiment in panel F. Data represent mean plus or minus SEM; groups were compared by the unpaired Student t test; *P < .05. (H) Percentage (left) and absolute number (right) of B-cell developmental fractions MLP, CLP, Fr-A, Fr-B and C, Fr-C′ of transplanted cells in recipient mice from the experiment in panel F. Data represent mean plus or minus SEM; WT and QT groups were compared by 2-way ANOVA.
TIMP-deficient BM niche hinders B-cell progenitor development
The BM niche is required for optimal B-cell development.2 The TIMPless state alters the biophysical and biochemical characteristics of long bones, which also exhibit increased protease activity.15,16 Quantification of Timp expression in FACS-sorted LSK, CLP, B-cell, and BMSC fractions showed Timp2 in LSK and CLP compartments, whereas Timp1, Timp3, and Timp4 were only found in BMSCs (supplemental Figure 6A-B). To determine whether the TIMP-deficient BM niche affects B-cell development, we used QT3+/− or WT mice as recipients of WT BM (Figure 6A). Total and donor-derived BM cell numbers were significantly higher in QT3+/− recipients at 16 weeks posttransplantation (Figure 6B). We observed a reduction in the percentage of B cells and progenitors, pre- and pro-B-cell, although this change was not reflected in their absolute numbers likely due to the total increase in BM cell content of QT3+/− recipients (Figure 6C). When enumerated using another gating strategy,26 a strong decline in the frequency and absolute number of fraction C′ was apparent in QT3+/− recipients (Figure 6D). These data suggest that a TIMP-deficient BM microenvironment is robust at supporting BM transplantation, yet this BM niche negatively influences B-cell progenitor development. Therefore, extrinsic factors in addition to cell-intrinsic defects arising from TIMP deficiency contributed to inadequate B-cell development in the BM.
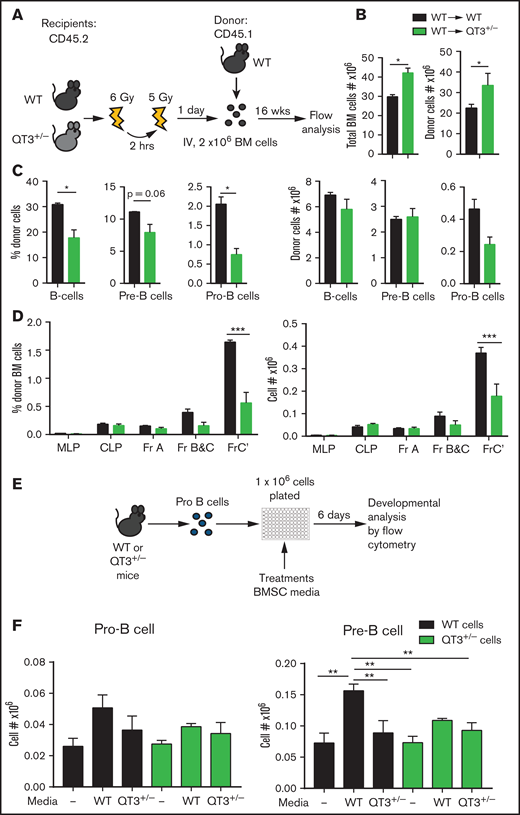
TIMP-deficient microenvironment is suboptimal for B-cell development. (A) Schematic showing the experimental procedure for WT BM transplants into WT or QT3+/−. Recipients were irradiated twice for a total of 11 Gy and 2 million BM cells from donor mice were injected 24 hours later. After 16 weeks, recipient BM were analyzed by flow cytometry. (B) Total BM cells (left panel) and donor-derived (CD45.2−) total BM cell count (right panel), 16 weeks posttransplantation, in recipient mice (WT→WT, n = 3; WT→QT3+/−, n = 3). Data represent mean plus or minus SEM; groups were compared by the unpaired Student t test; *P < .05. Experiment was repeated twice, and similar results were seen. (C) Percentage and absolute count of donor’s (CD45.2−) B cells, pre-B-cell and pro-B-cell experiment in panel B (WT→WT, n = 4; WT→QT3+/−, n = 4). Data represent mean plus or minus SEM; groups were compared by the unpaired Student t test; *P < .05. (D) Percentage (left) and absolute number (right) of B-cell developmental fractions MLP, CLP, Fr-A, Fr-B and C, Fr-C′ of transplanted cells (CD45.2−) in recipient mice from the experiment in panel B. Data represent mean plus or minus SEM; groups were compared by 2-way ANOVA; ***P < .001. (E) Schematic outlining the protocol to analyze WT and QT3+/− B-cell development in vitro. Pro-B cells were FACS-sorted from WT or QT3+/− mice, plated in 96-well plates, and cultured with conditioned media from WT or QT3+/− BMSC cultures. (F) Number of pro-B (left) and pre-B (right) cells after 6 days’ culture of FACS-sorted pro-B cells, with or without conditioned media of WT-BMSCs or QT3+/− BMSCs, expressed as fraction of total cells plated. **P < 0.01.
TIMP-deficient microenvironment is suboptimal for B-cell development. (A) Schematic showing the experimental procedure for WT BM transplants into WT or QT3+/−. Recipients were irradiated twice for a total of 11 Gy and 2 million BM cells from donor mice were injected 24 hours later. After 16 weeks, recipient BM were analyzed by flow cytometry. (B) Total BM cells (left panel) and donor-derived (CD45.2−) total BM cell count (right panel), 16 weeks posttransplantation, in recipient mice (WT→WT, n = 3; WT→QT3+/−, n = 3). Data represent mean plus or minus SEM; groups were compared by the unpaired Student t test; *P < .05. Experiment was repeated twice, and similar results were seen. (C) Percentage and absolute count of donor’s (CD45.2−) B cells, pre-B-cell and pro-B-cell experiment in panel B (WT→WT, n = 4; WT→QT3+/−, n = 4). Data represent mean plus or minus SEM; groups were compared by the unpaired Student t test; *P < .05. (D) Percentage (left) and absolute number (right) of B-cell developmental fractions MLP, CLP, Fr-A, Fr-B and C, Fr-C′ of transplanted cells (CD45.2−) in recipient mice from the experiment in panel B. Data represent mean plus or minus SEM; groups were compared by 2-way ANOVA; ***P < .001. (E) Schematic outlining the protocol to analyze WT and QT3+/− B-cell development in vitro. Pro-B cells were FACS-sorted from WT or QT3+/− mice, plated in 96-well plates, and cultured with conditioned media from WT or QT3+/− BMSC cultures. (F) Number of pro-B (left) and pre-B (right) cells after 6 days’ culture of FACS-sorted pro-B cells, with or without conditioned media of WT-BMSCs or QT3+/− BMSCs, expressed as fraction of total cells plated. **P < 0.01.
TIMP-deficient BMSCs fail to trigger pro-B→pre-B-cell differentiation
Given the extrinsic regulation of B cells in a TIMP-deficient niche and the fact that BMSCs express 3 of the 4 TIMPs, we generated primary cultures to study B-cell differentiation ex vivo using a BMSC isolation protocol that consistently maintains BMSC growth devoid of myeloid cell contamination24 (supplemental Figure 6C). An FACS-purified pro-B-cell fraction was cultured in conditioned media derived from primary WT or QT3+/− BMSCs (Figure 6E). Following their initial 6-day expansion, the addition of WT BMSC media effectively stimulated pro-B→pre-B-cell differentiation of WT pro-B cells, but not of QT3+/− pro-B cells (Figure 6F); this observation is consistent with the cell-intrinsic defect observed in QT HSPCs. Further differentiation into immature and mature B cells was comparable between the 2 genotypes (supplemental Figure 6D). Additionally, a significantly lower differentiation into the pre-B stage was noted for both WT and QT3+/− pro-B cells when cultured in QT3+/− BMSC media, suggesting that TIMP-deficient conditioned media lacked the capacity to trigger proper B-cell differentiation.
Mislocalization of CXCL12 within TIMP-deficient BM
CXCL12 and IL7 are essential for B-cell development in BM. Cell-specific deletion of CXCL12 from mesenchymal cells27 and conditional deletion of IL7Ra at the pro-B-cell stage lowers the B-cell developing fraction in the BM.6 IL7 levels were comparable in the BM-secreted fraction of WT and TIMPless groups (supplemental Figure 7A). We also quantified CXCL12 in serum, BM, and BMSC cultures. Soluble CXCL12 levels were far greater in QT BM (5.3-fold) and QT3+/− BMSC media (5.4-fold) (Figure 7A-B), whereas serum CXCL12 levels remained unchanged (data not shown). Furthermore, ELISA for active, full-length CXCL12 showed an elevation, albeit of only ∼1.6-fold, in the QT3+/− BM-secreted fraction (supplemental Figure 7B). We then used a 3-hour transmigration assay to test the migratory potential of BM cells in vitro. Mature and total B cells from QT3+/− BM showed a higher baseline migration, and the addition of rCXCL12 effectively stimulated transmigration of BM cells of both genotypes (Figure 7C). On the other hand, BMSC-conditioned media from QT3+/− BMSCs did not induce a greater BM cell migration despite having higher CXCL12 compared with WT BMSC media (Figure 7D). Flow cytometry of CXCR4- and CD49d-expressing B cells showed no major difference in their fractions between the 2 genotypes (supplemental Figure 7C). Thus, despite having higher soluble CXCL12 and intact migratory molecules, this chemokine proved suboptimal in TIMP-deficient mice.
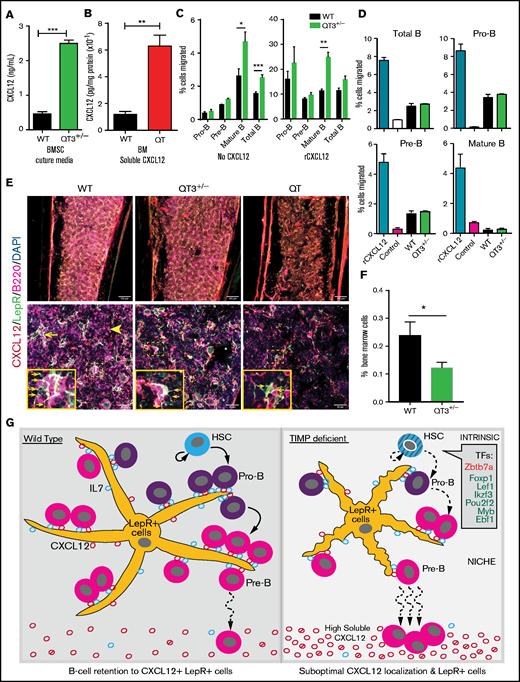
CXCL12 mislocalization limits B-cell development in TIMP deficiency. (A) CXCL12 protein concentration in media obtained from in vitro BMSC cultures, measured by sandwich ELISA. BMSCs were cultured for 2 weeks (WT, n = 3; QT3+/−, n = 3). Statistics by the unpaired Student t test; ***P < .001. (B) Soluble CXCL12 protein concentration in BM from WT and QT mice at 4 weeks of age, assayed by sandwich ELISA (WT, n = 3; QT, n = 3). Data represent mean plus or minus SEM; groups were compared by the unpaired Student t test; **P < .01. (C) Transmigration of pro-B, pre-B mature, and total B cells toward recombinant CXCL12. Data presented as percentage of input cell number migrated to the bottom chamber from both WT (n = 5) and QT3+/− (n = 4) BM. Statistics by 1-way ANOVA; *P < .05,**P < .01, ***P < .001. (D) Transmigration of pro-B, pre-B mature, and total B cells toward WT and QT3+/− BMSC culture media as well as positive and negative controls. Data presented as percentage of cell migrated to the bottom chamber for both WT (n = 2) and QT3+/− (n = 2) BM. (E) Representative images of CXCL12 (red), B220 (magenta), and LepR (green) staining of BM (diaphysis) from WT, QT3+/−, and QT tibia. Image showing B220+ B cells localizing around LepR+CXCL12+ (yellow; arrow) mesenchymal cells in WT, whereas in TIMP-deficient mice, morphology of mesenchymal cells is altered and with few B cells (arrowhead) around them. Insets, Magnified images of selected areas with arrows pointing to LepR+ cell processes. Scale bars, 150 µm (top panels), 40 µm (bottom panels), and 3× (insets). (F) Flow cytometric quantification of LepR+ cells in BM of 4-month-old WT and QT3+/− mice (gating strategy in supplemental Figure 7D). Statistics by the Student t test with *P < .05. (G) Summary schematic showing HSCs generating B-cell subsets. TIMP-deficient HSCs show cell-intrinsic defects, at least in part, due to the altered expression of transcription factors (TFs) critical for B-cell development. Within the BM niche, LepR+ mesenchymal cells provide IL7 for pro-B-cell proliferation and survival. CXCL12 production by LepR+ cells facilitate pro-B-cell retention to the vicinity of LepR+ cells for optimal IL7 dose. Differentiation into pre-B-cell requires CXCL12-mediated mobilization of precursors away from mesenchymal cells. LepR+ cells are fewer and have smaller processes in TIMP-deficient BM. Additionally, excessive soluble CXCL12 (both active and inactive forms) disrupts association of the developing B-cell population within this suboptimal stromal niche consequently reducing their numbers. DAPI, 4′,6-diamidino-2-phenylindole.
CXCL12 mislocalization limits B-cell development in TIMP deficiency. (A) CXCL12 protein concentration in media obtained from in vitro BMSC cultures, measured by sandwich ELISA. BMSCs were cultured for 2 weeks (WT, n = 3; QT3+/−, n = 3). Statistics by the unpaired Student t test; ***P < .001. (B) Soluble CXCL12 protein concentration in BM from WT and QT mice at 4 weeks of age, assayed by sandwich ELISA (WT, n = 3; QT, n = 3). Data represent mean plus or minus SEM; groups were compared by the unpaired Student t test; **P < .01. (C) Transmigration of pro-B, pre-B mature, and total B cells toward recombinant CXCL12. Data presented as percentage of input cell number migrated to the bottom chamber from both WT (n = 5) and QT3+/− (n = 4) BM. Statistics by 1-way ANOVA; *P < .05,**P < .01, ***P < .001. (D) Transmigration of pro-B, pre-B mature, and total B cells toward WT and QT3+/− BMSC culture media as well as positive and negative controls. Data presented as percentage of cell migrated to the bottom chamber for both WT (n = 2) and QT3+/− (n = 2) BM. (E) Representative images of CXCL12 (red), B220 (magenta), and LepR (green) staining of BM (diaphysis) from WT, QT3+/−, and QT tibia. Image showing B220+ B cells localizing around LepR+CXCL12+ (yellow; arrow) mesenchymal cells in WT, whereas in TIMP-deficient mice, morphology of mesenchymal cells is altered and with few B cells (arrowhead) around them. Insets, Magnified images of selected areas with arrows pointing to LepR+ cell processes. Scale bars, 150 µm (top panels), 40 µm (bottom panels), and 3× (insets). (F) Flow cytometric quantification of LepR+ cells in BM of 4-month-old WT and QT3+/− mice (gating strategy in supplemental Figure 7D). Statistics by the Student t test with *P < .05. (G) Summary schematic showing HSCs generating B-cell subsets. TIMP-deficient HSCs show cell-intrinsic defects, at least in part, due to the altered expression of transcription factors (TFs) critical for B-cell development. Within the BM niche, LepR+ mesenchymal cells provide IL7 for pro-B-cell proliferation and survival. CXCL12 production by LepR+ cells facilitate pro-B-cell retention to the vicinity of LepR+ cells for optimal IL7 dose. Differentiation into pre-B-cell requires CXCL12-mediated mobilization of precursors away from mesenchymal cells. LepR+ cells are fewer and have smaller processes in TIMP-deficient BM. Additionally, excessive soluble CXCL12 (both active and inactive forms) disrupts association of the developing B-cell population within this suboptimal stromal niche consequently reducing their numbers. DAPI, 4′,6-diamidino-2-phenylindole.
CXCL12 and IL7 are produced by LepR+ mesenchymal cells in the BM and provide a favorable niche for B-cell development.5,6 Immunostaining was performed on WT, QT3+/−, and QT bone sections for CXCL12, LepR+, and B220. Most of the B cells in the BM were in physical contact with LepR+CXCL12+ mesenchymal cells in WT. Strikingly, QT3+/− and QT tissues displayed an altered morphology of LepR+ mesenchymal cells, which had fewer processes as well as fewer B cells in their proximity. Furthermore, LepR+ cells were not as abundant in the TIMP-deficient groups as in WT when visualized by immunofluorescence (diaphysis and endosteal regions shown), which was confirmed by flow cytometry (Figure 7E-F; supplemental Figure 7D-E). Altogether, CXCL12 is no longer localized to the critical LepR+ mesenchymal population but is found as a shed chemokine. TIMP regulation of CXCL12 bioavailability and priming of B-cell precursors for differentiation is modeled in Figure 7G.
Discussion
The functional redundancy of TIMPs is well acknowledged.15,28 Skeletal defects observed in a TIMPless mouse prompted us to investigate the BM and hematopoiesis.15,29 To this end, we studied the cumulative effect of 4 Timp gene losses in mice carrying either no TIMP or a single Timp3 allele because the latter genotype prolongs the mouse lifespan while almost preserving the overt phonotypes of TIMPless animals. The loss of TIMPs suppressed B lymphopoieses through multiple critical parameters. First, it intrinsically affected HSPCs, as evident in BM transplant experiments. Microarray data confirmed that the largest number of affected genes was in the HSPC compartment, and several transcription factors involved in early B-cell development were downregulated. Second, TIMP loss also impacted the stromal compartment. TIMPs are expressed by the BM stromal fraction, and reverse BM transplants into TIMP-deficient recipients revealed their BM niche to be suboptimal for pre- and pro-B-cell progenitor development, which was also the case in QT3+/− BMSC culture media. Previously we showed that the metalloprotease–tumor necrosis factor α–DKK1 axis in the TIMPless BMSCs skews the differentiation capacity toward osteoclasts rather than osteoblasts.17 Here, we found far fewer LepR+ mesenchymal cells, which provide IL7 and CXCL12 as instructive local signals to developing B cells in the TIMPless bone. Ex vivo differentiation of WT pro-B cells confirmed TIMP-deficient BMSCs to be incompetent at supporting B-cell growth. Finally, CXCL12 mislocalization was a prominent feature of the TIMP-deficient bone; normally sequestered to the LepR+ cells, CXCL12 was instead abundant in the soluble fraction. Other cell-surface molecules, such as CXCR4 and the integrin CD49d, remained comparable to WT, pointing to aberrant CXCL12 as the main culprit for the compromised B lymphopoiesis. These intrinsic and niche events are modeled in Figure 7G.
Age-associated phenotypes have been noted in relation to TIMPs. Aging affects the hematopoietic process in humans and mice with a decline in B lymphocytes and expansion of the myeloid compartment by a cell-autonomous process .30 The cumulative TIMP loss severely reduces B-cell numbers in BM by 4 weeks of age, which persists in old mice. Competitive BM transplants from 2 age groups (1 month and 2 years) revealed significantly lower B-cell potential of young QT3+/− donors, but not of old donors compared with their old WT controls. TIMPs influence aging of the mammary gland and their stem cell capacity28 and also hippocampal-dependent cognition in mice.31 Our expression profiling revealed the TIMP impact on the differentiation program in the LSK fraction. A functional analysis of HSC potential to generate B cells, as measured by competitive and serial transplantation of TIMPless donors, confirmed their intrinsic defect. Further studies are required to better understand the role of TIMPs in aging and hematopoiesis.
Several examples have emerged regarding the role of the TIMP-metalloprotease axis in hematopoiesis.14 MMP9 facilitated HSPC mobilization from BM to peripheral blood in Mmp9−/− mice,32 although this finding was subsequently challenged.33 MMP14 deletion reduced total B cells and their progenitors after the pro-pre-B-cell stage where it cleaved Dll1 from BMSCs, lowering Notch activity.34 Notch signaling requires ADAM10, and the ablation or overexpression of ADAM10 affected B-cell development in BM and spleen.35,36 Sox9-specific ADAM17 inactivation in mesenchymal cells lowered B- and T-lymphocyte development in BM while increasing myeloid cells.37 The only known role of TIMPs in B lymphopoiesis relates to TIMP1 expression promoting a plasmablastic phenotype of a Burkitt lymphoma cell line.38 These examples center on a few metalloproteases that target Notch signaling, although the potential of this protease family in hematopoiesis remains understudied. A pan-metalloprotease imaging beacon reveals excessive proteolysis throughout the skeleton of TIMPless mice.15 The spatially organized regions of long bones have distinct physical landscapes that depend on localized delivery of specific growth factors to trigger cell-differentiation programs. Proteolysis in TIMPless long bones enhanced fibroblast growth factor 2 bioavailability in chondrocytes leading to growth plate closure.15 In osteoblasts, it upregulated tumor necrosis factor α bioavailability and blocked osteoblastic differentiation, reducing the bone mass.16 BM harbors the complex HSC niche and the current study highlights TIMP function in governing niche constituents including bone structure, mesenchymal cells, and chemokine signals. TIMPless and TIMP-deficient genetic strains offer opportunities to study the broader function of metalloproteases, although a lack of multiplex methods to screen and measure metalloprotease activity makes this challenging.
CXCL12 is required to position B-cell progenitors near IL7-secreting mesenchymal cells. CXCL12 deletion in mesenchymal cells results in fewer pre-pro-B-cell precursors.27 In BM, >80% of IL7+ cells are LepR+ mesenchymal cells, which are the major source of CXCL12 and create a niche for B-cell development.5 IL7 deletion in LepR+ cells reduces CLPs with an effect downstream of pro-B-cell stages.5 We noted an ∼50% reduction in LepR+ cells in TIMP-deficient BM. WT B cells were spatially proximal to CXCL12+LepR+ cells, whereas TIMPless mesenchymal cells were morphologically altered with fewer B cells around them. Cell-retention activity of CXCL12 works through its binding to the matrix, which creates a chemokine gradient and immobilizes cells via the CXCR4 receptor.39 The pro-B-cell developmental defect together with higher circulating B cells in TIMP-deficient mice indicate aberrant CXCL12 function. In fact, TIMP-deficient BM supernatant and BMSC culture media had higher soluble CXCL12 levels yet failed to enhance cell migration in vitro. We previously reported elevated pan-metalloprotease activity in the TIMPless bone,15 which is likely responsible for the increased soluble CXCL12. MMPs have been shown to cleave CXCL12 and disable its chemotactic activity11 although MMP2-processed CXCL12 in BMSC culture preserved this function.40 Overall, the complex metalloprotease network is poised to affect the localization and bioavailability of CXCL12 in the BM niche, and proteases relevant to TIMPless BM require further investigation. Our study provides new insight into chemokine biology and the role of TIMPs in hematopoiesis.
Acknowledgments
The authors thank Sadiya Yousef (University Health Network Animal Care Facility) for injection assistance, and Frances Tong (University Health Network Flow Cytometry Facility) for FACS assistance.
This work was supported by grants from the Canadian Institute of Health Research (R.K.) and the Canadian Cancer Society Research Institute (R.K.).
Authorship
Contribution: A.W., S.S., and R.K. conceived and designed the experiments; A.W., A.A., S.S., Y.W.S., H.F., S.N., and R.S. performed the experiments; K.A. conducted bioinformatic analysis; and S.S., A.W., P.D.W., and R.K. analyzed the data and wrote the manuscript.
Conflict-of-interest disclosure: The authors declare no competing financial interests.
Correspondence: Rama Khokha, Princess Margaret Cancer Centre, 101 College St, Room 13-314, Toronto, ON M5G 1L7, Canada; e-mail: rama.khokha@uhnresearch.ca.

