

Key Points
In 2 cohorts of patients with acute leukemia, Akkermansia expansion in the gut predicted a higher risk for neutropenic fever.
Metabolomics analysis suggested oxidative stress as the mediating pathway, thus offering potential targets for personalized prophylaxis.

Abstract
Despite antibiotic prophylaxis, most patients with acute leukemia receiving mucotoxic chemotherapy develop neutropenic fever (NF), many cases of which remain without a documented etiology. Antibiotics disrupt the gut microbiota, with adverse clinical consequences, such as Clostridioides difficile infection. A better understanding of NF pathogenesis could inform the development of novel therapeutics without deleterious effects on the microbiota. We hypothesized that metabolites absorbed from the gut to the bloodstream modulate pyrogenic and inflammatory pathways. Longitudinal profiling of the gut microbiota in 2 cohorts of patients with acute leukemia showed that Akkermansia expansion in the gut was associated with an increased risk for NF. As a prototype mucolytic genus, Akkermansia may influence the absorption of luminal metabolites; thus, its association with NF supported our metabolomics hypothesis. Longitudinal profiling of the serum metabolome identified a signature associated with gut Akkermansia and 1 with NF. Importantly, these 2 signatures overlapped in metabolites in the γ-glutamyl cycle, suggesting oxidative stress as a mediator involved in Akkermansia-related NF. In addition, the level of gut microbial–derived indole compounds increased after Akkermansia expansion and decreased before NF, suggesting their role in mediating the anti-inflammatory effects of Akkermansia, as seen predominantly in healthy individuals. These results suggest that Akkermansia regulates microbiota-host metabolic cross talk by modulating the mucosal interface. The clinical context, including factors influencing microbiota composition, determines the type of metabolites absorbed through the gut barrier and their net effect on the host. Our findings identify novel aspects of NF pathogenesis that could be targets for precision therapeutics. This trial was registered at www.clinicaltrials.gov as #NCT03316456.
Introduction
Neutropenic fever (NF) is often the earliest and only sign of infection in patients with acute leukemia.1,2 Therefore, a major goal of supportive care during antileukemia chemotherapy is to prevent NF. Unfortunately, however, the success of antibiotic prophylaxis has been modest because most patients develop NF despite prophylaxis.3 Because of our limited understanding of NF pathogenesis, effective strategies to complement antibiotics in preventing NF are unavailable.4 In addition, excessive antibiotic use has led to alarming rates of antibiotic resistance and Clostridioides difficile infection.5,6
Disturbances in microbiota-host interactions at the gut mucosal interface result in infection and immune deregulation.7,8 By damaging all 3 components (host immunity, microbiota, and the gut barrier), intensive chemotherapy represents a unique setting in which an immunocompromised host faces a dysbiotic microbiome across a damaged gut barrier. The gut microbiota in acute leukemia patients undergoes major changes, some of which have been associated with the risk of NF and infection.9–11 Considering that the gut microbiota regulates the level of many circulating metabolites,12,13 we hypothesized that circulating metabolomics changes resulting from gut microbiota alterations during antileukemia chemotherapy may modulate inflammatory and pyrogenic pathways and have a role in NF pathogenesis. We reasoned that gut mucosal damage in these patients will likely increase the contribution of the gut microbiota to the circulating metabolome.
We previously reported that the expansion of the mucolytic genus Akkermansia in the fecal microbiome predicted subsequent increases in circulating flagellin, the main component of flagellum in motile bacteria.11 Akkermansia muciniphila, a nonmotile bacterium and the only known human-associated Akkermansia species, makes up 1% to 4% of the colonic microbiome in most healthy adults.14,15 Akkermansia resides in the mucous layer and uses mucin as its sole carbon and nitrogen source.14 Our finding suggested that mucus erosion by Akkermansia potentiated the translocation of motile bacteria to the bloodstream. We considered that other pathobionts and microbial-derived metabolites may similarly cross the attenuated gut barrier, reach the bloodstream, and cause systemic effects. Using high-throughput longitudinal analysis of the gut microbiome and serum metabolome in acute leukemia patients receiving chemotherapy, we find that Akkermansia expansion in the gut is followed by a plethora of metabolomics changes in the serum, some of which are associated with a higher risk for NF. These findings establish the first connection among the gut microbiome, circulating metabolome, and NF and offer potential novel targets for therapeutics.
Methods
Participants and samples
Patients and samples.
We enrolled 2 cohorts of adult patients with acute leukemia (newly diagnosed or relapsed/refractory) receiving intensive inpatient chemotherapy. Intensive chemotherapy was defined as any regimen with expected ∼4 weeks of hospitalization. No other inclusion or exclusion criteria were used. The study was a noninterventional prospective biorepository protocol (www.clinicaltrials.gov #NCT03316456) that was approved by the University of Minnesota Institutional Review Board; it required written informed consent and was conducted in accordance with the Declaration of Helsinki. We previously reported on cohort 1,10,11,16 which included 20 patients with acute lymphoblastic leukemia (ALL) or acute myeloid leukemia (AML). Cohort 2 had an identical structure, with 2 exceptions: only AML patients were enrolled, and sample collection occurred twice weekly (Monday and Thursday), as opposed to the Monday-Wednesday-Friday schedule in cohort 1. Both schedules were calendar driven, independent of clinical factors, and continued from hospital admission until day 28 of chemotherapy or discharge (whichever occurred first). A window of ±1 day was allowed to collect each planned stool sample. Stool samples were collected in 95% ethanol-filled sterile tubes and stored at −80°C. Serum samples were collected preprandially between 6 and 8 am in standard red-top tubes, split in 250-μL aliquots, and stored at −80°C within 2 hours of collection.
Definitions and standards of care.
NF was defined as an oral temperature of 100.4°F combined with an absolute neutrophil count ≤ 0.5 × 10⁹/L.17 An episode of NF was considered new if it occurred after >24 hours of no fever. Clinical and supportive care in both cohorts were independent of study participation and followed our standard institutional algorithm. Deviations per the treating physicians’ discretion were permitted. Our antibiotic stewardship recommends acyclovir for viral prophylaxis, an azole for fungal prophylaxis, and levofloxacin for bacterial prophylaxis for the duration of neutropenia. Bacterial prophylaxis is continued until the development of NF or the first increase in absolute neutrophil count > 1 × 10⁹/L, whichever occurs first. When oral intake decreases to <60% of the lower limit of estimated energy and protein needs for 7 days, we generally initiate parenteral nutrition. All patients have a central venous catheter during hospitalization for intensive antileukemia chemotherapy. We ask patients to avoid flossing and to use soft toothbrushes.
Gut microbiome and serum metabolome profiling
The gut microbiome was profiled using 16S ribosomal RNA gene sequencing and serum metabolome using ultrahigh performance liquid chromatography-tandem mass spectroscopy (UPLC-MS/MS). Methodological details are provided in supplemental Methods. Raw sequence reads were uploaded to the National Center for Biotechnology Information Sequence Read Archive and are accessible under BioProject ID SRP141394. Source metabolomics data are provided in supplemental Data 1.
γ-Glutamyl transferase activity
Serum samples were analyzed for γ-glutamyl transferase (GGT) activity fluorometrically using a commercially available kit (Abcam, Cambridge, MA). GGT in samples catalyzes the hydrolysis of the γ-glutamyl bond in L-γ-glutamyl-p-nitroanilide, thus promoting the release of the chromogen p-nitroanilide. The absorbance (418 nm) is measured on a microtiter plate reader. Samples were tested in duplicate, and values were interpolated from a log-log fitted standard curve.
Statistical analysis
All analyses were performed in R using custom scripts and the following packages: phyloseq, vegan, lme4, boot, MaAsLin2, mixOmics, and changepoint. All P values were adjusted for multiple comparisons by the Benjamini-Hochberg method18 and, unless specified otherwise, a threshold of 0.10 for the corrected P values (q value) was used to define statistical significance.
Gut microbiome vs NF.
We separated the stool samples into 2 groups: high-risk if a new episode of NF occurred within 7 days after sample collection and low-risk (rest of the samples). Linear discriminant analysis (LDA) coupled with effect size measurements (linear discriminant analysis effect size [LEfSe]) using patient number as “subject” was used to find taxa that differed significantly (LDA score > 3.0; P < .05) between the 2 groups.19 We used operational taxonomic units (OTUs) as input for LEfSe and mapped the significant ones to Greengenes taxa to the deepest taxonomy level. Species-level taxonomy was not considered given our short amplicon methodology. We used mixed effect logistic regression with samples as units of analysis to evaluate whether Akkermansia abundance in the gut is associated with the risk of subsequent NF. Sample day, measured relative to day 1 of chemotherapy, was used as a fixed effect; patient number was used as a random effect. Akkermansia relative abundance (arcsine square root transformed) was the main predictor. The confidence intervals and their corresponding P values for regression coefficients were estimated using 500 bootstraps. The glmer function was used with a binomial distribution to predict NF within the next 7 days as a binary variable. We used the changepoint package in R (cpt.mean function, “at most 1 change” method, and default parameters) to detect the time point at which the greatest change occurred in gut Akkermansia relative abundance. The results of this analysis were compared with the histogram of NF probability at different time points.
Serum metabolome vs NF.
We classified the serum samples into 2 groups: high-risk if a new episode of NF occurred within 24 hours after sample collection and low-risk (the rest of the samples). Metabolomics results from UPLC-MS/MS were subjected to filtering, normalization, and imputation. First, metabolites that could not be detected in at least half of the samples were filtered. Missing data in our experimental protocol were expected to occur primarily as the result of being below the limit of quantification. To avoid information loss, we imputed missing values of a metabolite by replacing them with half of its lowest observed value across all samples. This procedure generates less bias than discarding missing data, unless a large percentage of data are missing.20 For each metabolite that was undetectable in more than half of the samples, we generated a 2 × 2 contingency table using the number of samples with detectable vs undetectable metabolite. We applied a Fisher’s exact test to these tables and corrected the P values for multiple testing. Metabolites with q < .10 were included in the final list for analysis. Metabolites were log transformed, and their levels were compared between the groups using Welch’s t test. Metabolites with q < .10 were considered differentially abundant. Logarithmically transformed fold changes and their corresponding q values were used to generate volcano plots. Differentially abundant metabolites were then used for overrepresentation analysis (ORA). Because there were many more metabolic subpathways than pathways, and subpathways are more informative, we used subpathways for ORA. The P value for each subpathway was determined by calculation of the hypergeometric distribution21 and corrected for multiple testing. A q value threshold of .05 was used to define statistical significance in ORA.
Gut Akkermansia vs serum metabolome.
We linked each serum sample to its nearest prior stool sample. These pairs were the units of analysis. Using the MaAsLin2 package, we applied multivariable mixed effect regression to determine the independent association between gut Akkermansia and serum metabolites while controlling for sex, use of parenteral nutrition (within 7 days prior to serum sample; binary), and serum sample day as fixed effects and patient number as random effect. A separate model was built for each metabolite, after log transformation and pareto scaling,22 as the outcome variable. The regression coefficient for Akkermansia was considered its effect size, and the corresponding P value was corrected for multiple testing. These values were used to generate volcano plots. ORA was performed similar to the previous analysis for metabolome-NF association.
Results
Overall structure of the study
We analyzed longitudinal research samples collected from 2 independent cohorts of acute leukemia patients between hospital admission and day 28 of inpatient chemotherapy or discharge from the hospital, whichever occurred first. Patient characteristics in the 2 cohorts are summarized in Table 1. Cohort 1 included 20 consecutive patients with acute leukemia (AML, n = 16; ALL, n = 4) who provided 207 stool samples on a thrice-weekly schedule. Cohort 2 included 23 consecutive AML patients who provided 201 twice-weekly stool samples. Sample collection in both cohorts was calendar driven, independent of clinical events. In addition, patients provided preprandial (6-8 am) serum samples on the same schedule as for stool samples. One hundred and twenty-eight serum samples collected from cohort 2 were available for metabolomics analysis; the other serum samples from cohort 2 and all of those collected from cohort 1 had been exhausted in other projects. Stool and serum samples underwent 16S ribosomal RNA gene (V4 hypervariable region) sequencing and UPLC-MS/MS, respectively.
Patient characteristics and outcomes
| Discovery cohort (n = 20) | Validation cohort (n = 23) | |
|---|---|---|
| Age, median (range), y | 53 (22-74) | 59 (27-79) |
| Sex | ||
| Male | 9 (45) | 10 (43) |
| Female | 11 (55) | 13 (57) |
| Acute leukemia type | ||
| Myeloid (AML) | 16 (80) | 23 (100) |
| Lymphoblastic (ALL) | 4 (20) | 0 |
| Treatment phase | ||
| First induction | 13 (65) | 6 (26) |
| Reinduction/salvage | 7 (35) | 17 (74) |
| Chemotherapy regimen | ||
| 7 + 3 | 9 (45) | 16 (70) |
| Clo/Ara-C | 2 (10) | 7 (30) |
| MEC | 5 (25) | 0 |
| PETHEMA ALL-AR-0349 | 2 (10) | 0 |
| GRAAPH-200550 : | 2 (10) | 0 |
| Total parenteral nutrition | 5 (25) | 9 (39) |
| NF | 19 (95) | 23 (100) |
| No. of new episodes per patient, mean | 1.8 | 1.5 |
| Bloodstream infection by day 28 | 6 (30) | 8 (35) |
| Bacteroides fragilis, n | 0 | 1 |
| Enterobacter cloacae, n | 0 | 1 |
| Enterococcus faecalis, n | 0 | 1 |
| Enterococcus faecium, n | 1 | 4 |
| Staphylococcus aureus, n | 1 | 0 |
| Staphylococcus epidermidis, n | 0 | 1 |
| Staphylococcus haemolyticus, n | 0 | 1 |
| Streptococcus mitis, n | 3 | 2 |
| Streptococcus sanguinis, n | 1 | 0 |
| C difficile infection | 4 (20) | 3 (13) |
| Antibacterial antibiotics by day 28 | ||
| Fluoroquinolones | 18 (90) | 19 (83) |
| Cephalosporins (generation 3+) | 15 (75) | 23 (100) |
| Carbapenems | 3 (15) | 3 (13) |
| Piperacillin-tazobactam | 6 (30) | 15 (65) |
| Metronidazole | 7 (35) | 10 (43) |
| Oral vancomycin | 3 (15) | 3 (13) |
| IV vancomycin | 10 (50) | 17 (74) |
Unless otherwise noted, data are n (%).
Clo/Ara-C, clofarabine plus cytarabine; MEC, mitoxantrone plus etoposide plus cytarabine; 7 + 3, cytarabine plus anthracycline (daunorubicin or idarubicin) with or without other drugs.
Analysis was done in 4 steps (Figure 1). (1) Gut Akkermansia association with NF: in both cohorts separately and combined, we found that gut Akkermansia expansion was associated with a higher risk for a new episode of NF in the following 7 days. This analysis provided compelling evidence for the association between gut Akkermansia and NF. In the following steps, we identified potential serum metabolomics mediators of this association. (2) Serum metabolomics signature preceding NF: using the available serum samples from cohort 2, we identified serum metabolomics changes that occurred within 24 hours before NF. We chose the short interval of 24 hours because we did not expect delayed effects by circulating metabolites on NF as an acute clinical event. (3) Serum metabolomics signature of gut Akkermansia: using stool and serum samples from cohort 2, we identified serum metabolomics changes that were associated with Akkermansia abundance in the nearest prior stool sample. (4) Overlap between serum metabolomics signatures of NF and gut Akkermansia: we determined the overlap between the lists of metabolites in steps 2 and 3. Considering the temporal sequence incorporated in the study design (gut microbiota followed by serum metabolomics followed by NF), the overlap between the 2 signatures identified putative metabolites that may mediate the association between gut Akkermansia and NF.
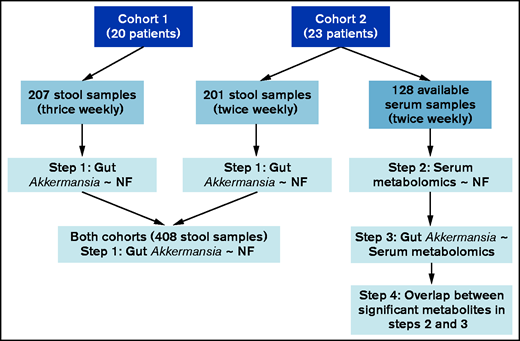
Consort diagram of patients, samples, and major analytic steps. All serum samples from cohort 1 and some from cohort 2 had been exhausted in prior projects; thus, the remaining samples from cohort 2 were used for analysis.
Consort diagram of patients, samples, and major analytic steps. All serum samples from cohort 1 and some from cohort 2 had been exhausted in prior projects; thus, the remaining samples from cohort 2 were used for analysis.
Akkermansia abundance in the gut is associated with the risk of NF
We already reported the microbiome characteristics of cohort 1.10 The most abundant genera from cohort 1 are shown in Figure 2A (upper panel). After excluding 9 samples because of low depth, 192 stool samples in cohort 2 containing 4 050 483 high-quality sequences (mean reads per sample: 21 096) that clustered into 866 OTUs were analyzed. The most abundant genera from cohort 2 are shown in Figure 2A (lower panel). The 2 most abundant genera in both cohorts were Bacteroides and Enterococcus. Akkermansia was an abundant genus in both cohorts, making up, on average, 4% of the microbiome in cohort 1 and 6% of the microbiome in cohort 2.
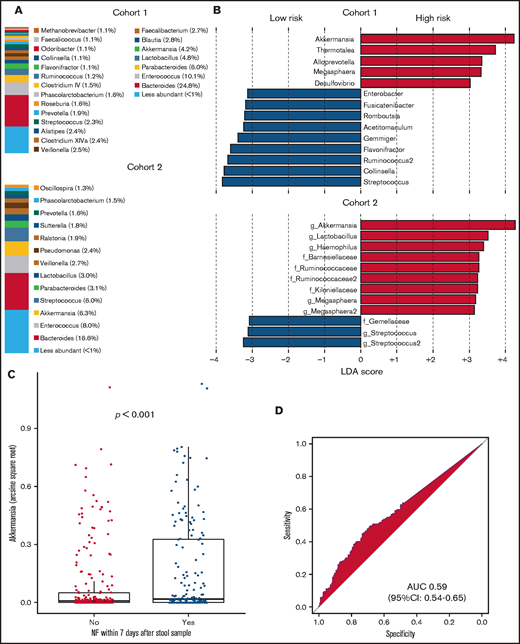
Gut microbiome and NF in patients with AML. (A) Relative abundances of genera in the 2 cohorts. Mean relative abundances across all samples are shown. Genera with a relative abundance < 1% are shown in aggregate. (B) LDA coupled with effect size measurements (LEfSe) in the 2 cohorts. Differentially abundant OTUs (LDA score > 3.0; P < .05) in high-risk samples are shown as red bars to the right; those more abundant in low-risk samples are shown as blue bars to the left. “f” and “g” in the plot for cohort 2 indicate family and genus, respectively. All significant taxa in cohort 1 were classifiable to the genus level, thus “f” and “g” notations are not used. High- and low-risk samples are defined by whether were followed or not by a new episode of NF within 7 days, respectively. (C) Relative abundance of Akkermansia in stool samples followed vs not followed by a new episode of NF within 7 days, with the 2 cohorts combined. A horizontal jitter was added for better visualization. The P value was derived from Welch’s t test. (D) Receiver operating characteristic curve analysis for the relative abundance of Akkermansia as a predictor of a new episode of NF within the next 7 days. AUC, area under the curve; CI, confidence interval.
Gut microbiome and NF in patients with AML. (A) Relative abundances of genera in the 2 cohorts. Mean relative abundances across all samples are shown. Genera with a relative abundance < 1% are shown in aggregate. (B) LDA coupled with effect size measurements (LEfSe) in the 2 cohorts. Differentially abundant OTUs (LDA score > 3.0; P < .05) in high-risk samples are shown as red bars to the right; those more abundant in low-risk samples are shown as blue bars to the left. “f” and “g” in the plot for cohort 2 indicate family and genus, respectively. All significant taxa in cohort 1 were classifiable to the genus level, thus “f” and “g” notations are not used. High- and low-risk samples are defined by whether were followed or not by a new episode of NF within 7 days, respectively. (C) Relative abundance of Akkermansia in stool samples followed vs not followed by a new episode of NF within 7 days, with the 2 cohorts combined. A horizontal jitter was added for better visualization. The P value was derived from Welch’s t test. (D) Receiver operating characteristic curve analysis for the relative abundance of Akkermansia as a predictor of a new episode of NF within the next 7 days. AUC, area under the curve; CI, confidence interval.
We separated the stool samples into 2 groups: high-risk (169 samples; 92 in cohort 1, 77 in cohort 2) if a new episode of NF occurred within 7 days after sample collection and low-risk (rest of the samples; n = 230; 115 samples in each cohort). Using LEfSe to find differentially abundant taxa in the 2 risk groups, the top taxon in high-risk samples was Akkermansia (cohort 1: LDA score, 4.8; P = .01; cohort 2: LDA score, 4.3; P = .039; Figure 2B). Because the results so far were consistent between the 2 cohorts, we combined the cohorts to find the level of Akkermansia that best predicted NF. A univariate comparison of the 2 risk groups showed a higher relative abundance of Akkermansia in the high-risk group (P < .001, Welch’s t test; Figure 2C). Receiver operating characteristic curve analysis suggested a relative abundance of 0.1% to be the optimal threshold for Akkermansia in a model that contained only Akkermansia as a predictor of NF. The performance of this model was significant but weak (area under the curve, 0.59; 95% confidence interval, 0.54-0.65; Figure 2D), indicating that Akkermansia alone is not an adequate predictive biomarker for NF. To eliminate the possibility that the association between Akkermansia and NF was driven by samples from a few patients, we built a mixed-effect logistic regression model with NF as the binary outcome variable, arcsine square root transformed Akkermansia relative abundance as the fixed effect, and patient number as a categorical random effect. In this model, higher abundance of Akkermansia predicted a higher risk for NF within the next 7 days (regression coefficient, 3.2; 95% confidence interval, 0.4-7.4; P < .01). Consistent with these analyses, the greatest change in Akkermansia abundance occurred 5 to 7 days before the greatest increase in NF incidence (supplemental Figure 1). Together, these results suggest that gut Akkermansia modulates the risk of NF.
Patients can have >1 new episode of NF, with a subsequent episode occurring after an initial defervescence. In post hoc exploratory analysis, we considered that changes in the gut microbiota before the first episode of NF may be different from those before the second episode of NF. This could be due to further alteration of the gut microbiota resulting from broad-spectrum antibiotics used to treat the first NF, among other causes. Specifically, if Akkermansia abundance were a predictor of only the first or second NF (but not both), considering all samples together could dilute the strength of the association. To evaluate this possibility, we performed separate LEfSe analyses using subgroups of samples collected before the first NF vs between the first and second episodes of NF (supplemental Figure 2). Differentially abundant taxa in high- vs low-risk samples showed little similarity between the subgroups, with Akkermansia being a notable exception. Specifically, Akkermansia was differentially abundant in high-risk samples in both subgroups (first NF: LDA, 3.9; P = .003; second NF: LDA, 3.4; P = .022). This finding supported our approach to consider all new episodes of NF together.
NF is preceded by serum metabolomics changes
We separated the serum samples into 2 groups: high-risk (n = 37) if a new episode of NF occurred within 24 hours after sample collection and low-risk (rest of the samples; n = 91). Using UPLC-MS/MS, we detected 1031 circulating metabolites, 872 of which were detectable in at least half of the samples and were stored for further analysis. In addition, 37 of the remaining 159 metabolites were detected more frequently in 1 of the 2 risk groups (q < .05; Fisher’s exact test). We included these 37 metabolites in the list of potential candidates along with the 872 original metabolites, to make a total of 909 metabolites for further analysis. Supplement data 1 is a detailed list of these metabolites and their corresponding metabolic pathways, subpathways, and mass spectrometric details. The distribution of these metabolites into each metabolic pathway is shown in Figure 3A. Metabolites with putative biological relevance to NF were identified by comparing the amount of each metabolite in high- and low-risk samples (supplemental Data 1). The level of 310 metabolites was significantly different between the groups (q < .10, Welch’s t test; Figure 3B). The distribution of these metabolites into each metabolic pathway is shown in Figure 3C. Examination of supplemental Data 1 revealed strong associations for acetaminophen metabolites and dexamethasone, supporting the internal validity of our metabolomics methodology. The results of post hoc exploratory analysis for subgroups of samples collected before the first NF vs between the first and second NF are shown in supplemental Data 2 and 3 and supplemental Figure 3. Because the number of samples in each group was small, these results should be interpreted with caution.
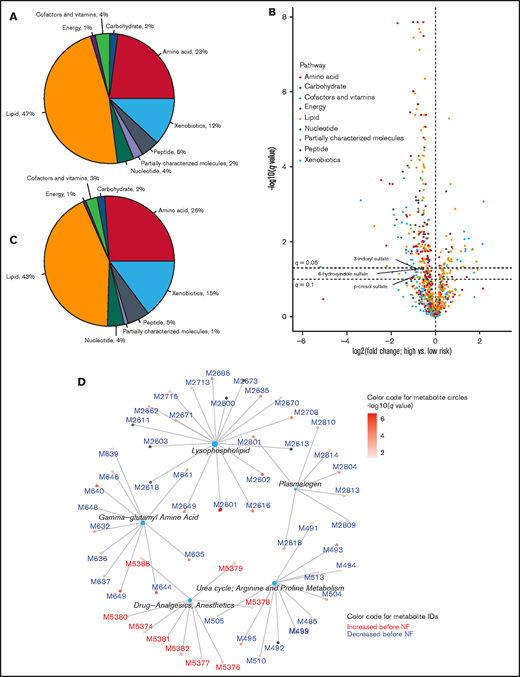
Serum metabolomics associated with NF. (A) Distribution of serum metabolites into pathways. (B) Volcano plot showing the magnitude and significance of metabolomics changes within 24 hours before NF. High-risk (preceding NF within 24 hours) and low-risk samples (not preceding NF within 24 hours) were compared. Points to the right (left) of the vertical line (no change) represent metabolites that were increased (decreased) before NF. Select metabolites of interest in this work are labeled (the orange circle representing p-cresol sulfate is nearly completely hidden behind 2 green circles). The horizontal lines represent q = .05 and q = .1, above which the metabolites are statistically significant according to the corresponding threshold. p values from Welch’s t-test were corrected for multiple testing to derive the q values. (C) Distribution of metabolites with q < .1 in (B) into pathways. (D) Overrepresentation analysis using subpathways. Metabolites with q < .05 in (B) were considered for overrepresentation of their subpathways using a hypergeometric test with a corrected P value threshold of .05. Each central node represents an overrepresented subpathway, and the peripheral nodes connected to the central node represent the metabolites within that subpathway that are significant in (B). The number of these metabolites in each overrepresented subpathway is proportional to the size of the central node. The complete list of metabolites is provided in supplemental Data 1.
Serum metabolomics associated with NF. (A) Distribution of serum metabolites into pathways. (B) Volcano plot showing the magnitude and significance of metabolomics changes within 24 hours before NF. High-risk (preceding NF within 24 hours) and low-risk samples (not preceding NF within 24 hours) were compared. Points to the right (left) of the vertical line (no change) represent metabolites that were increased (decreased) before NF. Select metabolites of interest in this work are labeled (the orange circle representing p-cresol sulfate is nearly completely hidden behind 2 green circles). The horizontal lines represent q = .05 and q = .1, above which the metabolites are statistically significant according to the corresponding threshold. p values from Welch’s t-test were corrected for multiple testing to derive the q values. (C) Distribution of metabolites with q < .1 in (B) into pathways. (D) Overrepresentation analysis using subpathways. Metabolites with q < .05 in (B) were considered for overrepresentation of their subpathways using a hypergeometric test with a corrected P value threshold of .05. Each central node represents an overrepresented subpathway, and the peripheral nodes connected to the central node represent the metabolites within that subpathway that are significant in (B). The number of these metabolites in each overrepresented subpathway is proportional to the size of the central node. The complete list of metabolites is provided in supplemental Data 1.
Next, we performed ORA to identify metabolic subpathways that were overrepresented among metabolites that had significantly different levels between the 2 risk groups. The largest overrepresented subpathways were lysophospholipid (lipid pathway) and γ-glutamyl amino acid (amino acid pathway) (Figure 3D). The level of metabolites in these subpathways decreased before NF. In addition, examination of supplemental Data 1 revealed decreased levels of several tryptophan metabolites, including indole acetyl glutamine (q = .02), indoleacetate (q = .03), and 3-indoxyl sulfate (q = .06), although the parent subpathway (tryptophan metabolism) was not overrepresented in ORA. Together, these results indicate a serum metabolomics signature shortly before NF, suggesting a mechanistic connection.
Akkermansia abundance in the gut is associated with serum metabolomics in the following days
We linked each serum sample to its nearest prior stool sample. Our frequent calendar-driven sample-collection schedule resulted in a short and relatively uniform interval of 1 to 3 days between serum and stool samples of each pair. These pairs were the units of analysis, where we used multivariable mixed-effect regression to determine the association between Akkermansia abundance in the gut and the level of serum metabolites (outcome variable), adjusting for sex, use of parenteral nutrition within 7 days prior to the serum sample, and serum sample day as fixed effects and patient number as random effect. Akkermansia abundance was associated with the level of 51 metabolites (q < 0.10; Figure 4B; supplemental Data 4). The distribution of these metabolites into each metabolic pathway (Figure 4C) showed a relative expansion of partially characterized molecules and xenobiotic metabolites compared with all metabolites together (Figure 4A). Strikingly, the top 13 metabolites in this analysis (those with the strongest association with Akkermansia abundance) showed a positive association, increasing with increasing Akkermansia abundance. 3-Indoxyl sulfate had 1 of the strongest associations (regression coefficient, 0.20; q = .005).
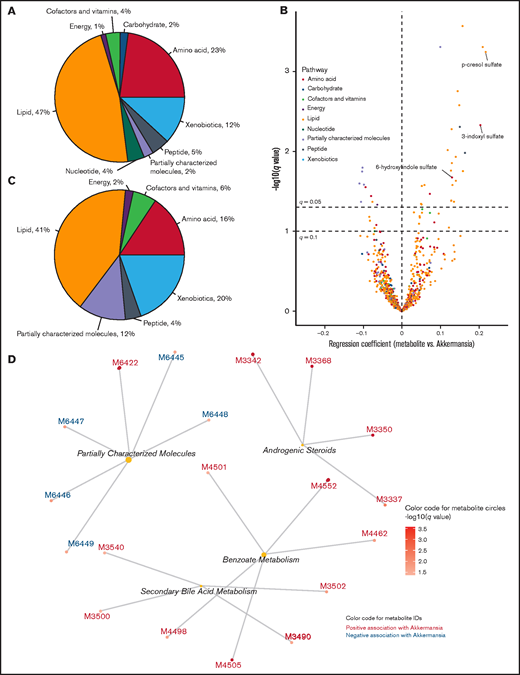
Serum metabolomics associated with gut Akkermansia. (A) Distribution of serum metabolites into pathways, provided to facilitate comparison with (C). (B) Volcano plot showing the strength and significance of the association between serum metabolite levels (outcome variable) and abundance of gut Akkermansia (predictor) in the nearest prior stool sample. For each metabolite, a separate mixed effect regression was created, adjusting for sex, use of parenteral nutrition, serum sample day, and patient number (random effect). The regression coefficient for Akkermansia was considered its effect size (x-axis), and the corresponding P value was corrected for multiple testing to derive the q value (y-axis). Select metabolites of interest in this work are labeled. The horizontal lines represent q = .05 and q = .1, above which the metabolites are statistically significant according to the corresponding threshold. (C) Distribution of metabolites with q < .1 in (B) into pathways. (D) Overrepresentation analysis using subpathways. Metabolites with q < .05 in (B) were considered for overrepresentation of their subpathways using a hypergeometric test with a corrected P value threshold of .05. Each central node represents an overrepresented subpathway, and the peripheral nodes connected to the central node represent the metabolites within that subpathway that are significant in (B). The number of these metabolites in each overrepresented subpathway is proportional to the size of the central node. The complete list of metabolites is provided in supplemental Data 2.
Serum metabolomics associated with gut Akkermansia. (A) Distribution of serum metabolites into pathways, provided to facilitate comparison with (C). (B) Volcano plot showing the strength and significance of the association between serum metabolite levels (outcome variable) and abundance of gut Akkermansia (predictor) in the nearest prior stool sample. For each metabolite, a separate mixed effect regression was created, adjusting for sex, use of parenteral nutrition, serum sample day, and patient number (random effect). The regression coefficient for Akkermansia was considered its effect size (x-axis), and the corresponding P value was corrected for multiple testing to derive the q value (y-axis). Select metabolites of interest in this work are labeled. The horizontal lines represent q = .05 and q = .1, above which the metabolites are statistically significant according to the corresponding threshold. (C) Distribution of metabolites with q < .1 in (B) into pathways. (D) Overrepresentation analysis using subpathways. Metabolites with q < .05 in (B) were considered for overrepresentation of their subpathways using a hypergeometric test with a corrected P value threshold of .05. Each central node represents an overrepresented subpathway, and the peripheral nodes connected to the central node represent the metabolites within that subpathway that are significant in (B). The number of these metabolites in each overrepresented subpathway is proportional to the size of the central node. The complete list of metabolites is provided in supplemental Data 2.
In ORA (Figure 4D), the largest overrepresented subpathway was partially characterized molecules. Benzoate metabolism, secondary bile acid metabolism, and androgenic steroids were the other overrepresented subpathways, with all metabolites showing a positive association with Akkermansia abundance. Secondary bile acids are produced via biotransformation of primary bile acid conjugates by the gut microbiota.23 Although p-cresol sulfate, 1 of the strongest correlates of Akekrmansia, was classified under the xenobiotics pathway (a biotransformation product of toluene) and benzoate metabolism subpathway, its main source in human serum is tyrosine fermentation by anaerobic bacteria in the colon.24 Together, these findings identified a serum metabolomics signature for gut Akkermansia that was characterized by increased levels of gut bacterial–derived metabolites.
Serum metabolomics signatures of gut Akkermansia and NF overlap
We identified 310 serum metabolites with significantly altered levels within 24 hours before NF and 51 serum metabolites with significant association with Akkermansia abundance in the nearest prior stool sample. Considering the temporal sequence of our comparisons (gut microbiome vs subsequent serum metabolome; serum metabolome vs subsequent NF), the overlap between these 2 lists of metabolites identifies putative metabolites that may mediate the Akkermansia-NF association. We found 9 metabolites that were shared between the 2 lists that represented 18% of the metabolomics signature of Akkermansia and 3% of the metabolomics signature of NF (Figure 5A; supplemental Data 5). Of these metabolites, 2 did not have authentic standards available for confirmation and, thus, were classified as Metabolomics Standards Initiative level 2/3.25 The top 3 metabolites in the shared list with the strongest associations with Akkermansia abundance were colonic bacteria–derived tryptophan and tyrosine metabolites (3-indoxyl sulfate, 6-hydroxyindole sulfate, and p-cresol sulfate).26 The level of these metabolites increased after Akkermansia expansion (supplemental Data 5) but decreased before NF (Figure 5B-D; supplemental Data 5), suggesting anti-inflammatory or antipyrogenic effects. The other metabolite with a similar association was hippurate (Figure 5E; supplemental Data 5), which is the glycine (Gly) conjugate of benzoic acid, a colonic bacteria–derived metabolite of polyphenolic dietary compounds.27 Because of their opposite direction of association with Akkermansia and NF, these 3 metabolites cannot mediate the Akkermansia-NF association. Rather, these metabolites may mediate some of the anti-inflammatory effects of Akkermansia on the host that have been extensively described in other clinical settings.28,29
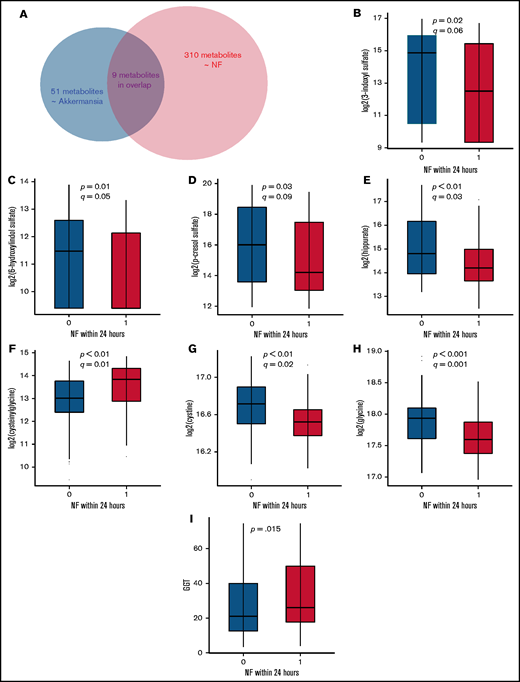
Changes in the level of select metabolites before NF. (A) A total of 310 serum metabolites were associated with NF, 51 metabolites were associated with abundance of gut Akkermansia, and 9 metabolites were associated with both. (B-I) Serum samples preceding vs not preceding NF within 24 hours were compared for select metabolites using Welch’s t test. (B-E) show colonic bacteria–derived metabolites from dietary tyrosine and tryptophan degradation. (F-H) show select metabolites in the γ-glutamyl cycle. Metabolites in (B-H) were measured by UPLC-MS/MS. GGT in (I) was measured fluorometrically. The boxplots show the median and interquartile range.
Changes in the level of select metabolites before NF. (A) A total of 310 serum metabolites were associated with NF, 51 metabolites were associated with abundance of gut Akkermansia, and 9 metabolites were associated with both. (B-I) Serum samples preceding vs not preceding NF within 24 hours were compared for select metabolites using Welch’s t test. (B-E) show colonic bacteria–derived metabolites from dietary tyrosine and tryptophan degradation. (F-H) show select metabolites in the γ-glutamyl cycle. Metabolites in (B-H) were measured by UPLC-MS/MS. GGT in (I) was measured fluorometrically. The boxplots show the median and interquartile range.
Cysteinylglycine (Cys-Gly) and Gly, 2 other metabolites that are shared between the 2 signature lists, showed concordant associations with Akkermansia abundance and NF. Cys-Gly increased after Akkermansia expansion and before NF (Figure 5F), whereas Gly decreased after Akkermansia expansion and before NF (Figure 5H). Therefore, these 2 metabolites may mediate a pyrogenic effect by Akkermansia. Cys-Gly is produced by extracellular degradation of glutathione (GSH) by GGT and is broken down into Gly and cysteine by a dipeptidase. Cysteine is rapidly auto-oxidized to the more stable cystine in the extracellular space. The action of GGT on GSH also generates a γ-glutamyl moiety that is transferred to acceptor molecules, such as amino acids.30 Cys, Gly, and γ-glutamyl amino acids are taken up by the cell to replenish GSH and, thus, intracellular antioxidant defense. Concurrent depletion of cystine (q = .02; Figure 5G; supplemental Data 1), Gly, and γ-glutamyl amino acids (Figure 3; supplemental Data 1) and elevation of Cys-Gly before NF are consistent with GSH deficiency and oxidative stress, resulting in adaptive upregulation of GGT to degrade extracellular GSH and generate GSH constituents (Gly, Cys, and glutamate), followed by their intense uptake by the cell to produce GSH.31
GGT activity, measured fluorometrically, was somewhat higher in serum samples preceding NF within 24 hours vs not preceding NF within 24 hours (34.7 ± 22.8 vs 28.4 ± 20.1 nmol/mL; P =.15; Welch’s t test; Figure 5I). Although the difference did not reach formal statistical significance, this finding supports our theory that GGT upregulation is the mechanism for the increase in Cys-Gly before NF. GGT activity is regulated by oxidative stress, as well as by numerous other factors, such as drugs and liver damage, potentially explaining the lack of a more marked difference between the groups. Together, these results suggest dual effects for Akkermansia: an inflammatory/pyrogenic effect via oxidative stress and an anti-inflammatory/antipyrogenic effect via gut bacteria–derived metabolites of tryptophan and tyrosine.
Discussion
Motivated by the unclear pathogenesis of NF in many patients with acute leukemia, we evaluated whether specific changes in the gut microbiota alter the serum metabolome and, thereby, the risk of NF. Our results support a model in which Akkermansia regulates microbiota-host metabolic cross talk at the gut mucosal interface. The mucus-thinning effect of Akkermansia may synergize with the epithelial damage caused by chemotherapy to augment metabolite absorption across the gut barrier. We propose that microbiota disruptions during chemotherapy result in an abnormal luminal metabolomics repertoire; its more liberal absorption into the bloodstream will lead to pathology.
The top candidate pathway found in this study to potentially mediate the association between Akkermansia expansion and a higher risk for NF was the γ-glutamyl pathway. GSH is a ubiquitous intracellular antioxidant. The metabolomics changes in this pathway that we found are consistent with a state of oxidative stress, leading to adaptive upregulation of GGT activity and intense import of GSH constituents into the cell. The gut microbiota is a regulator of GSH metabolism in the host.32 Specific gut bacteria (eg, Escherichia coli) use GSH as a cysteine and nitrogen source.33,34 In addition, formylated peptides produced by specific members of the gut microbiota activate enterocyte NADPH oxidases, generating reactive oxygen species.35-37 Also, tumor necrosis factor-α, an intrinsic pyrogen secreted by lipopolysaccharide (LPS)-stimulated monocytes,38 upregulates GGT expression.39 Therefore, bacterial translocation and endotoxemia, facilitated by the mucolytic action of Akkermansia, could cause oxidative stress, which is a known mechanism for LPS-induced fever.40,41
Tryptophan metabolism was the top candidate pathway associated with gut Akkermansia that showed a negative association with NF. Indole compounds are bacteria-derived products of dietary tryptophan fermentation, and their blood levels are highly dependent on tryptophan metabolism by the gut microbiota,12 especially commensal Clostridium spp., as well as other bacteria (eg, E coli).42 Indole compounds are important mediators of diet-induced host-microbiota cross talk and exert antioxidant and anti-inflammatory effects.42-44 As an example, indoleacrylic acid inhibits interleukin-6 and interleukin-1β production by LPS-stimulated human peripheral blood mononuclear cells and stimulates antioxidant pathways within those cells.44 We were originally puzzled by the apparent discrepancy between our results connecting Akkermansia expansion with an adverse clinical phenotype (NF) and the previously established plethora of Akkermansia-related beneficial impacts on the host.28,29 Our findings support the theory that Akkermansia effects are contextual and may be detrimental in clinical settings like intensive chemotherapy where severe gut barrier damage and dysbiosis often occur. Although as a mucus-adherent genus, Akkermansia is anatomically closer than luminal bacteria to the host (making direct effects possible), some effects of Akkermansia on the host may be through other bacteria and their metabolites. Mucus thinning by Akkermansia may increase the absorption of indole metabolites to the bloodstream. Gut Akkermansia abundance in a previous microbiome-metabolome study of healthy individuals correlated positively with blood levels of p-cresol sulfate (similar to our study) and correlated negatively with fecal levels of the same metabolite, suggesting altered absorption of metabolites across the gut barrier resulting from microbiota changes.13 Notably, although Akkermansia was the taxon with the second largest number of fecal metabolomics associations (>100 significant metabolites) in the previous study,13 it had significant associations with few circulating metabolites other than p-cresol sulfate. This observation, together with our findings in the present study (Akkermansia association with >50 serum metabolites), highlights the proposed importance of gut barrier damage in augmenting metabolite absorption. As another potential mechanism, mucin degradation products can enhance the growth of neighboring bacteria via cross-feeding.45 Because acute leukemia patients frequently develop dysbiosis,9,10 the new communities and interactions that arise in the gut microbiota may produce a different metabolomics repertoire, with different effects on the host. These potential mechanisms require validation in experimental models.
The gut microbiome contributes to some, but not all, cases of NF. However, because the origin of NF in most instances cannot be determined by conventional clinical and laboratory criteria, we considered all cases of NF in our analysis. This almost certainly diluted the true effect of the gut microbiota. The fact that we identified an association between gut Akkermansia and NF in 2 cohorts of patients, despite this dilutional effect, strongly suggests that for a significant proportion of NFs, our model of the importance of Akkermansia is likely to be correct. Because of the limited availability of serum samples, potential metabolomics mediators of the Akkermansia-NF association in this study were derived from only 1 cohort, highlighting the importance of a future validation study using concurrent microbiome/metabolome data. Our subgroup analysis for first vs second NF suggests that their predisposing taxa may be different. Although Akkermansia was differentially abundant in high-risk samples before the first and second episodes of NF, larger studies may identify additional relevant taxa that are specific to the first vs second NF.
Although we cannot ascertain the cause of Akkermansia expansion in our patients, nutritional changes may play a role. Undigested dietary polysaccharides that reach the colon and oligosaccharides generated from mucin degradation are the main nutrient sources for colonic bacteria.46 When dietary intake, especially fiber polysaccharides, is diminished, mucin becomes the main source of energy for bacteria, favoring mucolytic species, such as Akkermansia.47 This results in thinning of the colonic mucous barrier, increasing pathogen susceptibility.48
In conclusion, our results suggest that, in acute leukemia patients receiving chemotherapy, Akkermansia expansion in the gut enhances the absorption of a dysbiotic metabolome into the bloodstream through an eroded mucosal barrier. NF is 1 manifestation of this disrupted microbiota-host interaction. Acute leukemia patients also commonly suffer from other symptoms, such as fatigue and slowness of mental function, without a specific demonstrable etiology. Although these symptoms are sometimes taken for granted and are considered constitutional side effects of chemotherapy, our findings suggest that an altered serum metabolome may be involved. The identification of the specific metabolites that might cause or exacerbate these symptoms could inform novel targeted therapeutics. Although the number of samples in our analysis was relatively large, the number of patients was relatively small. It will be important to validate and extend our findings using a larger cohort. Finally, although the temporal sequence of events selected for analysis in this study (microbiome to metabolome to NF) supports causality, our analyses are associational in essence. Mechanistic studies of NF pathogenesis in acute leukemia patients, especially those involving the mucosal interface, are difficult to conduct because accessing the gut lumen in these patients is generally unsafe. The lack of an adequately representative animal model for NF in acute leukemia makes mechanistic studies even more challenging. Nonetheless, our findings linking microbiome, metabolome, and NF highlight the complex pathogenesis of NF and the importance of developing novel and personalized therapeutics.
Acknowledgments
Sequence data were processed and analyzed using the resources of the Minnesota Supercomputing Institute. The GGT activity assay was performed in the Cytokine Reference Laboratory (University of Minnesota).
This work was supported by the National Institutes of Health's National Center for Advancing Translational Sciences grants KL2TR002492 and UL1TR002494. Additional support was provided by National Institutes of Health, National Cancer Institute grant P30 CA77598 utilizing the Translational Therapy Laboratory Shared Resource of the Masonic Cancer Center, University of Minnesota. A.R. was supported by a University of Minnesota Medical School Innovation award.
The content is solely the responsibility of the authors and does not necessarily represent the official views of the National Institutes of Health’s National Center for Advancing Translational Sciences or National Cancer Institute.
Authorship
Contribution: A.R. and C.S. conceived, designed, and supervised the study; A.R., T.K., and C.S. performed microbiome analysis; S.R. performed mass spectrometry; M.E., H.E., and T.U.R. collected metadata; A.R. was responsible for the conduct of the clinical protocol; T.K., H.N., and C.S. extracted and sequenced DNA; and A.R. wrote the manuscript; all authors provided critical feedback on the manuscript.
Conflict-of-interest disclosure: The authors declare no competing financial interests.
Correspondence: Armin Rashidi, Division of Hematology, Oncology, and Transplantation, 14-100 PWB, MMC 480, 420 Delaware St SE, Minneapolis, MN 55455; e-mail: arashidi@umn.edu.

