

Key Points
NGS validated for simultaneous detection of IG/TCR rearrangements, translocations, CNAs, and single-nucleotide variants/indels.
Accompanying bioinformatic pipelines enable automated objective reporting of immunogenetic and oncogenetic alterations.

Abstract
Current diagnostic standards for lymphoproliferative disorders include multiple tests for detection of clonal immunoglobulin (IG) and/or T-cell receptor (TCR) rearrangements, translocations, copy-number alterations (CNAs), and somatic mutations. The EuroClonality-NGS DNA Capture (EuroClonality-NDC) assay was designed as an integrated tool to characterize these alterations by capturing IGH switch regions along with variable, diversity, and joining genes of all IG and TCR loci in addition to clinically relevant genes for CNA and mutation analysis. Diagnostic performance against standard-of-care clinical testing was assessed in a cohort of 280 B- and T-cell malignancies from 10 European laboratories, including 88 formalin-fixed paraffin-embedded samples and 21 reactive lesions. DNA samples were subjected to the EuroClonality-NDC protocol in 7 EuroClonality-NGS laboratories and analyzed using a bespoke bioinformatic pipeline. The EuroClonality-NDC assay detected B-cell clonality in 191 (97%) of 197 B-cell malignancies and T-cell clonality in 71 (97%) of 73 T-cell malignancies. Limit of detection (LOD) for IG/TCR rearrangements was established at 5% using cell line blends. Chromosomal translocations were detected in 145 (95%) of 152 cases known to be positive. CNAs were validated for immunogenetic and oncogenetic regions, highlighting their novel role in confirming clonality in somatically hypermutated cases. Single-nucleotide variant LOD was determined as 4% allele frequency, and an orthogonal validation using 32 samples resulted in 98% concordance. The EuroClonality-NDC assay is a robust tool providing a single end-to-end workflow for simultaneous detection of B- and T-cell clonality, translocations, CNAs, and sequence variants.
Introduction
Lymphoproliferative disorders (LPDs) arise from the clonal expansion of malignant lymphoid cells, which usually present clonotypic immunoglobulin (IG) or T-cell receptor (TCR) rearrangements. The 2017 revised 4th edition of the World Health Organization Classification of Tumors of Hematopoietic and Lymphoid Tissues details >70 different lymphoid disease entities.1,2 The large number of different LPDs that can arise during different B- and T-cell developmental stages can lead to difficulties in differential diagnosis. The revised World Health Organization classification highlights the increasing role of genetic alterations in diagnosis and patient stratification based on prognosis or response to therapy.2
This is reflected in the current increasingly complex molecular testing landscape for LPDs, often requiring genetic tests for copy-number alteration (CNA; eg, fluorescence in situ hybridization [FISH] or karyotyping), mutation analysis (eg, Sanger sequencing or next-generation sequencing [NGS]), IG/TCR clonality assessment (eg, EuroClonality/BIOMED-2 polymerase chain reaction [PCR] protocols or NGS), and translocation (eg, FISH, PCR, or NGS).3-5 The EuroClonality-NGS Working Group has recently developed amplicon-based NGS strategies to detect IG/TCR rearrangements.6-8 These protocols are suitable for clonality detection in most laboratories, because they provide streamlined and economical solutions, despite requiring different multiplexed PCR tubes to characterize all targets.9 We and others have developed targeted NGS approaches to detect rearrangements and translocations involving the IG/TCR region in tissue samples.10-18
This spectrum of molecular tests often requires testing of clinical specimens at multiple laboratories or outsourcing to specialist diagnostic centers, leading to individual results being interpreted separately, which can lead to diagnostic errors. Furthermore, clinical tests are often performed sequentially based on decisions by the diagnostic/clinical team, leading to increased turnaround times and exhaustion of scanty specimens. Targeted NGS methods have the potential to interrogate multiple genetic markers in a single assay. This can reduce tissue requirements, negate the requirement for sequential testing, increase laboratory throughput, and aid in consolidated interpretation of results.
We describe here the multicenter validation of the EuroClonality-NGS DNA Capture (EuroClonality-NDC) panel in a large cohort of clinical samples, enabling detection of rearrangements and translocations involving the IG/TCR regions along with reporting of CNAs and single-nucleotide variants (SNVs) for regions commonly altered in LPDs (Figure 1).
![Current molecular testing workflow and EuroClonality-NDC workflow for LPDs. Genetic alterations required to be tested (green box) can be performed using multiple molecular testing strategies with recognized limitations (orange boxes). The EuroClonality-NDC panel design includes probes to capture all variable (V), diversity (D), and joining (J) genes for all functional immunoglobulin (IG)/TCR loci (blue box) alongside probes designed to cover either the entire coding sequence or specific hotspots in selected exons for 72 genes, probes designed to capture CNAs in clinically relevant genes, and immunoglobulin heavy chain (IGH) switch regions to detect translocations originating from aberrant class switch recombination. A brief summary of the EuroClonality-NDC multisite validation is detailed (yellow boxes). del(13q) was excluded from the final sensitivity and specificity calculations, because the EuroClonality-NDC design only examined the RB1 gene, which resides outside of the minimally deleted region for del(13q).*In addition to the 280 clinical validation samples, an extra 128 samples were included (50 LPD samples with southern blot [SB] data, 39 chronic lymphocytic leukemia [CLL] samples with extensive FISH analysis for CNA validation, 21 reactive lesions, 14 LPD cell lines, and 4 Horizon cell line blends) to aid in assessing EuroClonality-NDC performance. FFPE, formalin-fixed paraffin-embedded; gDNA, genomic DNA; HMW, high molecular weight.](https://ash.silverchair-cdn.com/ash/content_public/journal/bloodadvances/5/16/10.1182_bloodadvances.2020004056/2/m_advancesadv2020004056f1.png?Expires=1765896482&Signature=KjYD7u~HJNaO3BoFHCMIVJwHKMGlSHA7O553n7MdLFN2eFafuw2v4SPH-yBaP5jYES4eL7gXqe-dC5b4KUruR2Nttyyh~tX0zfr5DTewtlW98Yay03TsimVn3R7MC76m0S7R-8Dwi5rtaRtUkCfLNzMIqisFB3qhIddhOwDIagGXZcFtw5bbUICudT3tVU-YTbWAaacmguPBSsVwmj7ezZLatlaCVpgzW9kDEMSCSyXexz4KgLmopd-vyGZTiR5WYgJFxD2HGMaWWAcQfbLaqXMZ1xvGYfci36t4x-y9t24PzgXV5aBaijGtIXwY1eN~Y5SpZeGJhp6Ju6bYp4dB4g__&Key-Pair-Id=APKAIE5G5CRDK6RD3PGA)
Current molecular testing workflow and EuroClonality-NDC workflow for LPDs. Genetic alterations required to be tested (green box) can be performed using multiple molecular testing strategies with recognized limitations (orange boxes). The EuroClonality-NDC panel design includes probes to capture all variable (V), diversity (D), and joining (J) genes for all functional immunoglobulin (IG)/TCR loci (blue box) alongside probes designed to cover either the entire coding sequence or specific hotspots in selected exons for 72 genes, probes designed to capture CNAs in clinically relevant genes, and immunoglobulin heavy chain (IGH) switch regions to detect translocations originating from aberrant class switch recombination. A brief summary of the EuroClonality-NDC multisite validation is detailed (yellow boxes). del(13q) was excluded from the final sensitivity and specificity calculations, because the EuroClonality-NDC design only examined the RB1 gene, which resides outside of the minimally deleted region for del(13q).*In addition to the 280 clinical validation samples, an extra 128 samples were included (50 LPD samples with southern blot [SB] data, 39 chronic lymphocytic leukemia [CLL] samples with extensive FISH analysis for CNA validation, 21 reactive lesions, 14 LPD cell lines, and 4 Horizon cell line blends) to aid in assessing EuroClonality-NDC performance. FFPE, formalin-fixed paraffin-embedded; gDNA, genomic DNA; HMW, high molecular weight.
Current molecular testing workflow and EuroClonality-NDC workflow for LPDs. Genetic alterations required to be tested (green box) can be performed using multiple molecular testing strategies with recognized limitations (orange boxes). The EuroClonality-NDC panel design includes probes to capture all variable (V), diversity (D), and joining (J) genes for all functional immunoglobulin (IG)/TCR loci (blue box) alongside probes designed to cover either the entire coding sequence or specific hotspots in selected exons for 72 genes, probes designed to capture CNAs in clinically relevant genes, and immunoglobulin heavy chain (IGH) switch regions to detect translocations originating from aberrant class switch recombination. A brief summary of the EuroClonality-NDC multisite validation is detailed (yellow boxes). del(13q) was excluded from the final sensitivity and specificity calculations, because the EuroClonality-NDC design only examined the RB1 gene, which resides outside of the minimally deleted region for del(13q).*In addition to the 280 clinical validation samples, an extra 128 samples were included (50 LPD samples with southern blot [SB] data, 39 chronic lymphocytic leukemia [CLL] samples with extensive FISH analysis for CNA validation, 21 reactive lesions, 14 LPD cell lines, and 4 Horizon cell line blends) to aid in assessing EuroClonality-NDC performance. FFPE, formalin-fixed paraffin-embedded; gDNA, genomic DNA; HMW, high molecular weight.
Methods
Sample collection and quality control
Genomic DNA from 376 LPD samples was collected from 10 EuroClonality-NGS laboratories. All samples were collected according to local institutional review board approval and/or policies and in accordance with the Declaration of Helsinki. Sample requirements included tumor infiltration ≥20%, available BIOMED-2 IG/TCR PCR results based on EuroClonality guidelines, and/or translocation-positive cases defined using clinically validated FISH or PCR (or immunohistochemistry for CCND1 in mantle cell lymphoma [MCL]).5,19 TCR α (TRA) rearrangements were analyzed using previously published methods in a proportion of samples.20,21 Analytical validation samples included 21 reactive lesions (supplemental Table 1), 14 LPD cell lines (supplemental Table 2), and 4 cell line blends (Tru-Q1-4; Horizon Discovery, Cambridge, United Kingdom). Genomic DNA samples (n = 50) analyzed by SB (supplemental Table 3) were also used for IG/TCR rearrangement detection.3 All samples underwent quality control by quantification using Qubit (Qiagen, Crawley, United Kingdom) and fragment sizing by TapeStation (Agilent, Santa Clara, CA). Samples with excessive degradation (n = 36; defined as average fragment size <300 bp for FFPE and <4500 bp for HMW samples), with insufficient DNA (n = 9; defined as <100 ng if HMW DNA or <200 ng if FFPE DNA), or lacking clinical data (n = 50) were excluded from the study. From the remaining 281 samples, 192 HMW and 88 FFPE samples were included in the final cohort of 280 samples (Table 1). Included in the 280 samples were 7 low-level disease samples with tumor infiltration between 5% and 20%. Anonymized samples were shipped to 7 EuroClonality-NGS laboratories, which analyzed 14 proficiency and 40 validation samples each.
Disease entity representation in study cohort
| Disease entity | B/T cell | Total n | % | HMW | FFPE | LLD (<20%)* |
|---|---|---|---|---|---|---|
| MCL | B | 39 | 13.9 | 23 | 15 | 1 |
| CLL | B | 37 | 13.2 | 37 | 0 | 0 |
| FL | B | 36 | 12.9 | 18 | 18 | 3 |
| PCM | B | 24 | 8.6 | 24 | 0 | 0 |
| DLBCL | B | 20 | 7.1 | 4 | 17 | 0 |
| B-ALL† | B | 20 | 7.1 | 20 | 0 | 0 |
| BL | B | 18 | 6.4 | 8 | 10 | 0 |
| MZL | B | 6 | 2.1 | 6 | 0 | 1 |
| MALT | B | 3 | 1.1 | 0 | 3 | 0 |
| SMZL | B | 1 | 0.4 | 1 | 0 | 0 |
| T-ALL | T | 42 | 15.0 | 42 | 0 | 0 |
| ALCL | T | 13 | 4.6 | 2 | 11 | 0 |
| AITL | T | 9 | 3.2 | 3 | 6 | 1 |
| MF | T | 3 | 1.1 | 1 | 2 | 1 |
| SS | T | 3 | 1.1 | 3 | 0 | 0 |
| EATL | T | 2 | 0.7 | 0 | 2 | 0 |
| C-ALCL | T | 1 | 0.4 | 0 | 1 | 0 |
| T-LBL | T | 1 | 0.4 | 0 | 1 | 0 |
| PTCL-NOS | T | 1 | 0.4 | 0 | 1 | 0 |
| Intestinal T-cell lymphoma, not otherwise specified | T | 1 | 0.4 | 0 | 1 | 0 |
| Total | 280 | 100.0 | 192 | 88 | 7 |
AITL, angioimmunoblastic T-cell lymphoma; ALCL, anaplastic large-cell lymphoma; B-ALL, B-cell acute lymphoblastic leukemia; BL, Burkitt lymphoma; C-ALCL, CD30+ anaplastic large cell lymphoma; DLBCL, diffuse large B-cell lymphoma; EATL, enteropathy-associated T-cell lymphoma; FL, follicular lymphoma; LLD, low-level disease; MALT, mucosa-associated lymphoid tissue; MF, mycosis fungoides; MZL, marginal zone lymphoma; PCM, plasma cell myeloma; PTCL-NOS, peripheral T-cell lymphoma, not otherwise specified; SMZL, splenic marginal zone lymphoma; SS, Sézary syndrome; T-ALL, T-cell acute lymphoblastic leukemia; T-LBL, T-lymphoblastic lymphoma.
Classified as <20% tumor infiltration.
Sixteen B-ALL samples were B-cell precursor ALL.
Panel design
For immunogenetic analysis, probes were designed to capture functional variable, diversity, and joining genes for IGH, κ (IGK), λ (IGL), and TRA, β (TRB), γ (TRG), and δ (TRD) gene loci (supplemental Table 4.1-7). For oncogenetic analysis, probes were designed to cover either the entire coding sequence or specific hotspots in selected exons of 72 genes identified by the EuroClonality-NGS Working Group in 2015 on the basis of their potential value as diagnostic, prognostic, or predictive markers and/or translational research interest in particular entities (supplemental Table 4.8). Probes were also designed to capture DNA in clinically relevant genes and IGH switch–related translocations (supplemental Table 4.9-10). Probes were designed against the GRCh38/hg38 genome assembly and manufactured with the SeqCap EZ Choice Library (Roche Sequencing Solutions, Pleasanton, CA).
Library preparation and sequencing
An optimized and standardized protocol was followed by all testing centers (data supplement). Library preparation was performed using 100 ng of HMW or 200 ng of FFPE DNA with the KAPA Hyperplus Kit (Roche Sequencing Solutions, Pleasanton, CA). Including negative and positive controls, 16 and 24 libraries were pooled for the proficiency and validation runs, respectively, followed by hybridization using the EuroClonality-NDC panel. To remove bias resulting from DNA integrity, HMW and FFPE samples were hybridized on separate runs. Pooled libraries were sequenced on the NextSeq 500 (Illumina, Cambridge, United Kingdom) using a 150-bp paired-end strategy and a 300-cycle NextSeq 500/550 Mid Output Kit (Illumina, Cambridge, United Kingdom).
Bioinformatic pipeline and internal review committee
The EuroClonality-NGS–developed ARResT/Interrogate software tool was expanded for use with EuroClonality-NDC, including fragment deduplication, generation of contig sequences, false positive filtering, and establishment of a threshold of ≥6 unique rearranged clonal fragments to assign IG/TCR clonality.7,22 Rearrangement, translocation, CNA, and SNV pipelines are detailed in the data supplement. For each clonal rearrangement, the percentage in locus was calculated by dividing the number of unique clonal fragments for each specific rearrangement by the total number of unique fragments for rearrangements involving that specific locus (eg, IGH). Similarly, the percentage in class was calculated by dividing the number of unique clonal fragments by the total number of unique fragments for the specific class of rearrangement within that locus (eg, variable, diversity, and joining or diversity and joining for IGH). Cases exhibiting discordance between the original diagnostic data and EuroClonality-NDC results for rearrangements and/or translocations were submitted to an internal review committee, comprising members of all participating NGS centers.
CNA analysis
Performance of the EuroClonality-NDC in detecting CNAs was assessed using a subset of the 280-sample validation cohort (CLL, n = 27; plasma cell myeloma, n = 24; B-ALL, n = 14; MCL, n = 1; and follicular lymphoma [FL], n = 1) and 39 additional CLL samples where diagnostic data by FISH for at least 1 probe for 11q, 13q, 17p, and/or chromosome 12 were available.
Proficiency and reproducibility assessment
A proficiency assessment was established to ensure all laboratories achieved minimum performance thresholds using EuroClonality-NDC before running validation samples. Well-characterized cell lines (n = 14) representing a diverse repertoire of IG/TCR rearrangements and translocations were selected from our previous study.7 A set of 56 IG/TCR rearrangements and 7 translocations across the 14 cell lines were compiled based on full characterization by Sanger sequencing and NGS.7 The 14 cell lines were sequenced by all 7 laboratories and analyzed by ARResT/Interrogate. Mean target coverage depth of >500 reads and detection of >95% of expected rearrangements were required for all laboratories before proceeding with the validation runs.
Panel performance assessment
Overall performance was assessed by identifying underperforming regions as previously described.23 Positive control HMW DNA (n = 14), HMW cell line blends (n = 12), and DNA extracted from FFPE reactive lesions (n = 21) were used for assessment. Regions were classed as underperforming if coverage was >2 standard deviations below the mean in ≥50% samples. Sensitivity and specificity of EuroClonality-NDC to detect rearrangements, translocations, and CNAs were determined by comparison with original diagnostic results. Limit of detection (LOD) was calculated based on results obtained in 7 unique cell line blends prepared by mixing DNA of different cell lines (2 cell lines per blend) at mass ratios of 10%, 5.0%, 2.5%, and 1.25%. Each site received 1 of the 7 blends at the 4 stated dilutions. To assess repeatability for rearrangement detection, 2 B-ALL samples were analyzed for intra- and interrun precision by comparing expected vs observed rearrangements. For somatic mutations, 4 cell line blends (Tru-Q1-4) were used. These have known SNVs and indels and cancer-specific variants with known variant allele frequencies (VAFs) ranging from 4% to 30%. Based on the intersection with the EuroClonality-NDC target regions, there were 38 SNVs and 2 indels considered true positives and 78 SNVs and 6 indels considered true negatives between the 4 blends. Orthogonal validation of mutations in a subset of 32 samples from the clinical cohort was performed using a validated single-molecule molecular inversion probe (smMIP)–based NGS approach (supplemental Table 5).24
Results
Panel design and performance
Of the 1243 regions on the panel, 31 (2.5%) underperformed, with 21 (68%) of 31 being reference SNPs for CNA assessment. Twenty four (77.4%) of 31 regions had a guanine-cytosine content outside of the 40% to 60% threshold (supplemental Table 6.1).25 Only 8 (26%) of 31 underperforming regions, or 0.64% of the entire panel (n = 1243), were coding regions that could affect mutation detection in JAK3, MAPK1, TCF3, and TRAF2 genes. The sequencing metrics for the study cohorts are detailed in supplemental Table 6.2.
Precision
For analysis of rearrangements, intrarun precision was assessed using 2 B-ALL samples, which were run in triplicate. A single DNA extraction was performed for each sample before separate library preparations for replicates. All repeatability samples were then pooled and sequenced in a single run. These samples were also sequenced during the validation phase, thus providing an opportunity to assess interrun precision. Across both samples, a total of 16 different IG and TCR rearrangements were assessed, and all 16 were identified across all intra- and interrun replicates (supplemental Figure 1). SNV precision assessment was performed on the Tru-Q cell line blends, with all expected SNVs (n = 38) and indels (n = 2) detected.
Proficiency and reproducibility assessment
All 7 laboratories detected the 56 IG/TCR rearrangements during the proficiency assessment to evaluate technical competency and interlaboratory reproducibility.26 Additionally, 6 of 7 laboratories detected all 7 translocations, with 1 laboratory detecting 6 of 7 translocations. Because of a technical issue at 1 laboratory, mean target coverage depth for the proficiency run was 607, whereas the median coverage across the other 6 sites was 1826.
LOD assessment
We performed LOD analysis using 34 well-characterized IG/TCR rearrangements present in the cell line blends. LOD was assessed to be 100%, 94.1%, 76.5%, and 32.4% at 10%, 5%, 2.5%, and 1.25% dilutions, respectively, resulting in an LOD of 5% using ARResT/Interrogate with a threshold of ≥6 unique fragments (supplemental Table 7). Translocation LOD was assessed to be 100%, 75%, 25%, and 25% for the 10%, 5%, 2.5%, and 1.25% dilutions, respectively, based on 4 evaluable translocations (supplemental Table 7). Using Horizon cell line blends, with VAFs ranging from 4% to 30%, we determined the LOD for SNV and indel calling to be 4%.
Excluded samples from the validation cohort
After assessment of discrepant cases by the internal review committee, 10 of 280 samples were excluded for the following reasons: NGS failure (n = 1), clerical errors (n = 2), and samples with a tumor infiltration later confirmed to be below the 5% threshold established for initial inclusion of low-level disease samples in this study (n = 7). This provided 270 suitable samples for analytical validation.
Detection of IG and TCR rearrangements
The EuroClonality-NDC assay detected IG clonality (ie, detection of ≥1 clonal rearrangement at IGH, IGK, or IGL locus) in 191 (97%) of 197 B-cell malignancies. Of the 6 remaining cases, tumor infiltration was reported as 5% by the submitting laboratory (n = 1), the original diagnostic data identified only TRG and TRD clonal rearrangements in 1 B-ALL (n = 1), and the remaining 4 samples were post–germinal center malignancies (FL, n = 2; BL, n = 2), which were likely to have undergone somatic hypermutation (SHM). The EuroClonality-NDC assay detected TCR clonality (ie, detection of ≥1 clonal rearrangement at TRA, TRB, TRD, or TRG locus) in 71 (97%) of 73 T-cell malignancies. In the 2 remaining cases (T-ALL and ALCL), the original diagnostic PCR result also did not detect clonality.
We next compared the EuroClonality-NDC and EuroClonality/BIOMED-2 PCR assays to detect clonality at each individual IG/TCR locus (Table 2). Across all IG/TCR loci, EuroClonality-NDC detected 471 (96.9%) of 486 clonal rearrangements detected by EuroClonality/BIOMED-2 PCR assays, while the EuroClonality/BIOMED-2 PCR assays detected 471 (89.2%) of 528 clonal rearrangements detected by EuroClonality-NDC. Eight cases with clonal IGH rearrangements were detected by EuroClonality/BIOMED-2 IGH tubes but not by EuroClonality-NDC. With the exception of 1 B-ALL, the remaining 7 cases were all mature B-cell malignancies. Eleven cases with a clonal IGH rearrangement were detected by EuroClonality-NDC but not by the EuroClonality/BIOMED-2 IGH tubes. With the exception of 1 angioimmunoblastic T-cell lymphoma and 2 ALCLs, the remaining 8 cases were B-cell malignancies, and EuroClonality-NDC detected an accompanying IGK (supplemental Table 8). Clonal IGK rearrangements were undetected in 25 cases by EuroClonality/BIOMED-2 PCR but were evident by EuroClonality-NDC. Of these, 20 and 22 cases displayed clonal IGH rearrangements by EuroClonality/BIOMED-2 PCR and EuroClonality-NDC, respectively. With the exception of 1 ALCL and 1 B-ALL sample, the remainder were mature LPDs, indicating the clonal IGK results by EuroClonality-NDC assay were likely true positives (supplemental Table 9). The remaining 3 cases were somatically hypermutated FLs, in which no clonal IGH rearrangement was detected by the EuroClonality/BIOMED-2 PCR either.
IG/TCR loci performance of EuroClonality-NDC
| Locus | Total tested | B cell | T cell | Benchmark | |||
|---|---|---|---|---|---|---|---|
| Clonal | Not clonal | ||||||
| NGS clonal | NGS not clonal | NGS clonal | NGS not clonal | ||||
| IGH | 203 | 180 | 23 | 154 | 8 | 11 | 30 |
| IGK | 181 | 172 | 9 | 138 | 2 | 25 | 16 |
| IGL | 19 | 19 | 0 | 7 | 2 | 1 | 9 |
| TRA | 24 | 7 | 17 | 5 | 2 | 9 | 8 |
| TRB | 77 | 7 | 70 | 61 | 1 | 2 | 13 |
| TRD | 57 | 16 | 41 | 29 | 0 | 4 | 24 |
| TRG | 91 | 20 | 71 | 77 | 0 | 5 | 9 |
EuroClonality-NDC assay performance for IGL across all B-cell malignancies (n = 197) in the validation study demonstrated that 38.6% of cases exhibited IGL clonality (supplemental Table 10). There was 100% concordance between EuroClonality-NDC and EuroClonality/BIOMED-2 PCR for IGL rearrangements in the 14 proficiency cell lines (supplemental Table 11).
EuroClonality-NDC identified 9 and 4 additional cases with TRA and TRD rearrangements, respectively. In 5 of 9 TRA cases and all TRD cases where clonality was detected only by EuroClonality-NDC, the detection was due to the more comprehensive approach of the EuroClonality-NDC assay to detect complex TRD diversity—TRA joining rearrangements not covered by the PCR methods used (supplemental Table 12). In the 2 cases (angioimmunoblastic T-cell lymphoma and ALCL) where only EuroClonality-NDC detected clonal TRB rearrangements, clonality was also detected at TRG and TRA or TRD loci. In the 5 samples where only EuroClonality-NDC detected clonal TRG rearrangements, all had low-level TRG rearrangements (≤28 fragments), and 4 were from ALCL patients with low-level ALK translocations confirmed by both the originating laboratory and EuroClonality-NDC assay.
Only 1 of 21 reactive lesions showed a clonal rearrangement (IGK) with >8 unique reads, and this clonal marker was later confirmed using a published amplicon-based NGS test.6 Low-level rearrangements (ie, 6-8 clonal fragments and percentage in locus ≤1.6%) were detected in 8 (38%) of 21 reactive FFPE samples by EuroClonality-NDC, highlighting its ability in detecting low-level, immune-reactive clonal populations in reactive FFPE specimens.
Finally, 50 additional samples with available SB data were examined.3 EuroClonality-NDC correctly identified 100 (93%) of 107 loci where SB reported a clonal rearrangement (supplemental Table 13). EuroClonality-NDC did not detect clonal TRB rearrangements in 2 MCL samples (both had detectable IGH and IGK rearrangements and CCND1 translocations). In 1 T-ALL sample, the EuroClonality-NDC reported a TRD-TLX3 translocation and a TRA rearrangement, whereas SB results indicated 2 TRD rearrangements. In 4 mature B-cell malignancies (CLL, DLBCL, MM, and FL), a clonal IG rearrangement was not detected, although analysis of translocation and CNA data detected clonality in all cases. The EuroClonality-NDC assay reported 38 additional low-level rearrangements (mean fragment count, 13.7) compared with SB.
Orthogonal analysis of clonality in discrepant cases by CNA and ddPCR analysis
For rearrangements detected by EuroClonality-NDC but not by EuroClonality/BIOMED-2 PCR, we examined CNA data and performed digital droplet PCR (ddPCR) using rearrangement-specific probes and primers on a subset of cases with available DNA. In 31 (63%) of 49 rearrangements tested, a clonal rearrangement was confirmed by ddPCR, with an association observed between the ddPCR result and the number of fragments identified for a specific rearrangement by EuroClonality-NDC (Figure 2; supplemental Figure 2).
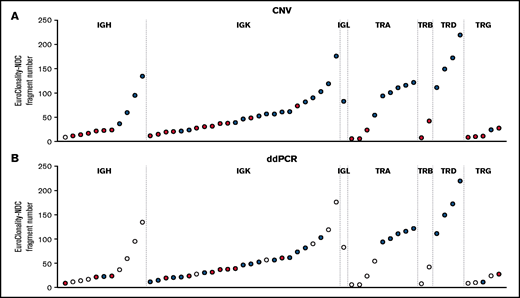
Analysis of rearrangements detected by EuroClonality-NDC but not by EuroClonality/BIOMED-2 PCR. (A) ddPCR was performed using rearrangement-specific probes and primers on a subset of cases with available DNA. (B) Manual analysis of CNA data were performed to identify reduced coverage (<0.8-fold) of the intervening variable, diversity, and joining genes corresponding to the rearrangements identified by the ARResT/Interrogate pipeline. Each circle represents a sample with a rearrangement identified only by the EuroClonality-NDC assay. For both panels, blue shading indicates the rearrangement was detected by the respective technique, red shading signifies the rearrangement was not detected, and white shading indicates the sample was not tested. The y-axes represent the number of fragments identified by the ARResT/Interrogate pipeline corresponding to the specific clonal rearrangement.
Analysis of rearrangements detected by EuroClonality-NDC but not by EuroClonality/BIOMED-2 PCR. (A) ddPCR was performed using rearrangement-specific probes and primers on a subset of cases with available DNA. (B) Manual analysis of CNA data were performed to identify reduced coverage (<0.8-fold) of the intervening variable, diversity, and joining genes corresponding to the rearrangements identified by the ARResT/Interrogate pipeline. Each circle represents a sample with a rearrangement identified only by the EuroClonality-NDC assay. For both panels, blue shading indicates the rearrangement was detected by the respective technique, red shading signifies the rearrangement was not detected, and white shading indicates the sample was not tested. The y-axes represent the number of fragments identified by the ARResT/Interrogate pipeline corresponding to the specific clonal rearrangement.
Using the CNA pipeline, 4 of 11 IGH cases, 14 of 25 IGK cases, and the 1 IGL case showed reduced coverage (<0.8-fold) of the intervening variable, diversity, and joining genes when compared with the rearrangement identified by the pipeline (examples shown in supplemental Figures 3-5). For TCR loci, CNA data confirmed 6 of 9 TRA cases, 0 of 2 TRB cases, 4 of 4 TRD cases, and 1 of 5 TRG cases. The average number of fragments for the clonal rearrangement was 28.1 and 75.7 for IG rearrangements that were undetectable and detectable by CNA analysis and 16.1 and 118.5 for TCR rearrangements, respectively.
Translocation analysis
Of the 270 samples used for IG/TCR rearrangement analysis, 27 were excluded from translocation analysis by the internal review committee: 5 samples had translocations identified by EuroClonality-NDC outside the scope of the original diagnostic analyses, 11 samples were analyzed with non–clinically validated in-house FISH probes or by karyotype analysis with no confirmation by FISH, and 11 cases had insufficient residual material to validate EuroClonality-NDC results. Of the remaining 243 samples analyzed, EuroClonality-NDC detected the correct translocation in 145 of 152 cases (sensitivity, 95%; 95% CI, 91% to 98%; Table 3). In 91 cases where the original diagnostic testing did not detect a translocation, EuroClonality-NDC showed concordance in 89 cases (specificity, 98%; 95% CI, 92% to 100%).
Detection of translocations by EuroClonality-NDC in different disease entities
| Total cases* | Translocations detected | ALK | STIL-TAL1 | Breakpoints in TCR loci | BIRC3-MALT1 | Breakpoints in IG loci† | |||||||||
|---|---|---|---|---|---|---|---|---|---|---|---|---|---|---|---|
| Benchmark | NGS | HOXA | LMO1/2 | TLX1 | CRLF2 | BCL2 | BCL6 | MYC | CCND1 | MAF | |||||
| ALCL | 12 | 9 | 9 | 9 | |||||||||||
| T-ALL | 38 | 29 | 29 | 5 | 4 | 5 | 7 | ||||||||
| B-ALL | 18 | 11 | 12 | 7 | 1 (1) | 4 (1) | |||||||||
| BL | 11 | 11 | 10 | 1 (1) | 10 (1) | ||||||||||
| CLL | 33 | 8 | 8 | 4 | |||||||||||
| DLBCL | 17 | 12 | 11 | 7 (2) | 2 (1) | 4 (2) | |||||||||
| FL | 33 | 29 | 28 | 28 | |||||||||||
| MCL | 29 | 28 | 26 | 1(1) | 26 (1) | ||||||||||
| PCM | 22 | 13 | 12 | 5 | 4 | ||||||||||
| MZL | 6 | 2 | 2 | 1 | 1 | ||||||||||
MZL, marginal zone lymphoma; PCM, plasma cell myeloma.
Of the 270 samples used for IG/TCR rearrangement analysis, 27 samples were excluded from translocation analysis by the internal review committee. Only disease entities with recurrent translocations partners are shown.
Figures within parentheses indicate the number of translocations, with the specified IG translocation partner, which were found as a double-hit event within a particular disease entity. Only common recurrent translocation partners are detailed.
CNA and mutation analyses
EuroClonality-NDC CNA results were compared with the original diagnostic FISH, resulting in sensitivities of 100%, 91.7%, 80%, and 44.2% for del(11q), trisomy 12, del(17p), and del(13q), respectively (Table 4). The threshold baseline fold change for deletions detected by EuroClonality-NDC was 20% (ie, 0.8) and 30% for trisomy (ie, 1.3). del(13q) by NGS was measured using the RB1 locus, instead of DLEU1 used by FISH. Specificity was 100% for all examined regions.
Detection of frequent CNAs by EuroClonality-NDC
| Evaluable cases | True positive | False negative | Sensitivity | True negative | False positive | Specificity | |
|---|---|---|---|---|---|---|---|
| del(11q) | 66 | 8 | 0 | 100.0 | 58 | 0 | 100.0 |
| Trisomy 12 | 66 | 11 | 1 | 91.7 | 54 | 0 | 100.0 |
| del(13q) | 95 | 19 | 24 | 44.2 | 52 | 0 | 100.0 |
| del(17p) | 87 | 8 | 2 | 80.0 | 77 | 0 | 100.0 |
For mutation analysis, 38 SNVs and 2 indels across all Tru-Q DNA reference standards were considered true positives and 78 SNVs and 6 indels true negatives. EuroClonality-NDC achieved 100% sensitivity and specificity for both SNVs and indels. Additional orthogonal validation was performed on a subset (n = 32) of the 270-sample cohort. EuroClonality-NDC identified 41 (98%) of 42 mutations (VAF range, 4.3% to 88.0%) detected by an smMIP-based NGS approach. A high correlation (r = 0.97) was achieved between the VAF calculated by EuroClonality-NDC and the smMIP-based NGS approach. The single discrepant mutation had a reported VAF of 4.7% by smMIP-NGS and 3.7% by EuroClonality-NDC, which is below the LOD (4%) and was therefore not scored. Furthermore, NOTCH1 mutation assessment was performed in a subset of T-ALL samples (n = 23) with sequencing data available from the originating laboratory. EuroClonality-NDC identified all 26 mutations (VAF range, 5.0% to 57.0%), resulting in 100% sensitivity and specificity. Across the entire cohort (n = 270), we calculated the most frequently mutated genes by disease entity (Figure 3; supplemental Figures 6-13).

Heatmap of the most frequently mutated genes in each disease entity. Disease entities with ≥6 samples in the validation cohort (n = 270) are included in the study. Each row represents a gene, ordered by the frequency of mutations across all disease entities, with the most frequently mutated gene at the top. Each column represents a disease entity, with the number of samples assessed in parentheses. The color represents the percentage of samples in a particular disease entity, identified with a mutation in each specific gene. AITL, angioimmunoblastic T-cell lymphoma; MZL, marginal zone lymphoma.
Heatmap of the most frequently mutated genes in each disease entity. Disease entities with ≥6 samples in the validation cohort (n = 270) are included in the study. Each row represents a gene, ordered by the frequency of mutations across all disease entities, with the most frequently mutated gene at the top. Each column represents a disease entity, with the number of samples assessed in parentheses. The color represents the percentage of samples in a particular disease entity, identified with a mutation in each specific gene. AITL, angioimmunoblastic T-cell lymphoma; MZL, marginal zone lymphoma.
Combinatorial clonality assessment
After individual assessment of panel performance to detect clonal IG/TCR rearrangements, translocations, CNAs, and SNVs, we investigated the potential improvement in clonality detection using all 4 parameters together. We examined 8 samples where no IG/TCR clonality could be detected by NGS (supplemental Table 14). In 6 of 8 cases, we could detect either a translocation, CNA, or SNV. Of the 2 cases (MCL and BL) where no clonality was detected using any of the features, further assessment at the originating center showed the MCL case contained <5% tumor infiltration.
Discussion
We report the development and multicenter clinical validation by the EuroClonality-NGS Working Group of a novel hybridization-capture NGS assay that can detect IG and TCR rearrangements, translocations, CNAs, SNVs, and indels in HMW and FFPE DNA samples with a single test.
Sensitivity for IG/TCR clonality detection was high in both HMW (97.3%) and FFPE (96.5%) samples. In post–germinal center B-cell malignancies, the performance of classical PCR-based assays for IGH, IGK, and IGL rearrangements is affected by SHM, leading to impaired primer binding and false-negative results in clonality assessment.4 In contrast, supplemental Tables 8 and 9 highlight a large number of post–germinal center B-cell malignancies where EuroClonality-NDC detected IGH/IGK clonality that PCR-based assays did not.
We report a high sensitivity for detection of TRA rearrangements, exceeding previous tests by identifying additional complex TRD diversity–TRA joining rearrangements.15,27 Because TRA rearrangements lead to deletion of the TRD locus, the inclusion of TRA on the EuroClonality-NDC panel enables a combined interpretation of the TRD and TRA rearrangement data, thereby reducing the potential for reporting artifacts. The inclusion of TRA probes also helped define the breakpoints for a number of undefined translocations identified in T-ALL samples.
The intervening variable, diversity, and joining genes that were deleted during somatic recombination showed reduced coverage, thus enabling CNA analysis in those regions to be used as a surrogate marker for clonal rearrangements. Orthogonal validation using combined CNA and ddPCR analyses supported the validity of additional IG and TCR rearrangements detected by the EuroClonality-NDC rearrangement pipeline but not by the EuroClonality/BIOMED-2 PCR. Careful examination of read sequences indicated somatic mutation on generic primer/probe binding sites, incorrect joining gene classification, or errors in the complementary determining region 3 sequence as potentially contributing to ddPCR-negative results. Our results show CNA analysis is effective when there is significant tumor content in the sample but is not suitable for minor clones present in <20% to 40% of total cells. To our knowledge, our study is the first to demonstrate this strategy successfully, detecting clonal rearrangements even in disease entities characterized by high levels of SHM.
EuroClonality-NDC achieved a high sensitivity of 95% for translocation detection in the validation study samples (n = 243). Similar to previous DNA-based capture strategies to detect chromosomal translocations, multiple translocation partners were identified using probes to capture only 1 side of the translocation breakpoint.10,11,23,28 For example, we detected all NPM1-ALK (n = 5), ATIC-ALK (n = 2), and RANBP2-ALK (n = 1) translocations in the ALCL samples through capture of only the ALK breakpoint.29-32 Reassuringly, we noted high sensitivity (86% to 100%) in detecting IG translocation partners such as CCND1, BCL2, and MYC, which are part of the diagnostic workflow for MCL, FL, and BL, respectively. Furthermore, our novel assay can characterize double-/triple-hit lymphomas with MYC and BCL2 and/or BCL6 translocations, as long as they involve IG genes. This currently requires multiple FISH tests to ascertain if an MYC-IG or MYC-non-IG translocation is present, which is key to assessing prognostic relevance in DLBCL.33,34
CNA results were locus dependent, with high sensitivities reported for trisomy 12 and del(11q) and lower sensitivities for del(17p) and del(13q). In 1 discrepant del(17p) sample, FISH identified 13.5% positive cells, although the CNA pipeline threshold is >20%. The other discrepant sample had 42% positivity by del(17p) FISH, although EuroClonality-NDC detected only a TP53 mutation. For del(13q), the panel design had probes for the RB1 gene, whereas the del(13q) minimally deleted region is restricted to DLEU1 and DLEU2 and does not include RB1.35-37 Conversely, the specificity of the assay to detect CNA was 100% for all 4 loci. CNA detection was biased in highly aneuploid samples (defined by ≥40 regions showing amplification or deletion across all regions on the bed file) and were excluded from analysis.38
The EuroClonality-NDC assay performance for somatic mutations was reproducible, with 100% for both sensitivity and specificity at >4% VAF. Orthogonal validation, using an smMIP-based NGS approach, achieved 98% concordance across 42 mutations identified in 32 samples. Analysis of the frequently mutated genes in the various LPDs was in line with previously reported analyses, such as MYC, ID3, and TP53 mutations in BL; SF3B1, NOTCH1, and TP53 in CLL; and KMT2D, MYD88, and CARD11 in DLBCL.39-42
In summary, we have described and validated the EuroClonality-NDC assay, demonstrating accurate identification of clonal IG/TCR rearrangement, translocation, CNA, and mutation data using a single test. In particular, our data show superior performance of EuroClonality-NDC for some targets prone to false negatives using PCR-based technologies (eg, IGH, IGK, and TRA). In addition, EuroClonality-NDC can detect clonality through identification of translocations or clonal CNAs or detection of somatic SNVs/indels. Notably, using a combination of all 4 parameters (rearrangements, translocations, CNAs, and SNVs), we achieved 99.6% sensitivity in detecting a clonal malignancy. We believe the EuroClonality-NDC assay has the ability to address the current gap in the clinical diagnostic pathway by providing a single-test approach for clonality and prognostication to minimize discrepancies in the interpretation of test results, reduce economic costs, and ultimately improve diagnostic outcomes and patient care.
Acknowledgments
The authors thank Bart Lubbers and Marieke Bitter for their project management support of ESLHO and EuroClonality. The authors acknowledge several groups from the European Research Initiative on CLL: Richard Rosenquist, Karolinska Institutet, Stockholm, Sweden; Jon Strefford, University of Southampton, Southampton, United Kingdom; Sarka Pospisilova, Masary University, Brno, Czech Republic; Elias Campo, Hospital Clinic, University of Barcelona, Barcelona, Spain; and Stefan Stilgenbauer, University of Saarland, Saarbrücken, Germany, for providing CLL samples and data for copy-number validation.
The Northern Ireland High Performance Computing Service provided computing resources, funded by the Engineering and Physical Sciences Research Council (EP/T022175).
The revenues of the previously obtained patent (PCT/NL2003/000690), which is collectively owned by the EuroClonality Foundation and licensed to InVivoScribe, are exclusively used for EuroClonality activities, such as for covering costs of working group meetings, collective work packages, and EuroClonality educational workshops. The EuroClonality consortium operates under an umbrella of the European Scientific Foundation for Laboratory Hemato-Oncology (ESLHO), which is an official European Hematology Association Scientific Working Group.
Authorship
Contribution: J.P.S. and D.G. designed the experiments, wrote the manuscript, contributed to molecular studies, and performed data analysis; N.D, C.S.K., and S. Srivastava developed computational tools, performed bioinformatic analysis, and contributed to manuscript revision; J.G., P.P., G.F., S. Songia, M.A., M.E.S., L.I.K., P.J.T.A.G., P.V., M.Y.v.d.K., K.C.H., N.M. K.P., E.G., and L.-A.S. contributed to molecular studies, data analysis, and manuscript revision; D.W., M.C., E.H., K.S., W.K., S.F., M.B., C.P., E.A.M., M.v.d.B., G.C., F.D., R.G.-S., and P.J.T.A.G. provided key scientific insights and/or provided samples and data and contributed to manuscript revision; A.W.L. is the EuroClonality-NGS Working Group coordinator, provided key scientific insights, provided samples and data, and contributed to manuscript revision; and D.G. conceived and supervised the study.
Conflict-of-interest disclosure: M.A. has received honoraria from Janssen and nonfinancial support (event attendance) from Janssen, AbbVie, and Roche. W.K. has received research grants from Roche, Regeneron, Amgen, and Takeda. L.-A.S. has received honoraria from Janssen. R.G.-S. has received honoraria, consultancy, and/or research funding from Amgen, Bristol-Myers Squibb, Gilead, Incyte, Janssen, Novartis, Pharmacyclics, and Takeda. E.M. provides consultancy services to Servier for minimal residual disease measurement in ALL. A.W.L. has received contract research support from Roche-Genentech, Gilead, and Janssen. D.G. has received honoraria, consultancy, and/or research funding from Roche, AstraZeneca, Novartis, Incyte, Eli Lilly, and Illumina and is cofounder of Univ8 Genomics. The remaining authors declare no competing financial interests.
Correspondence: David Gonzalez, Patrick G Johnston Centre for Cancer Research, Queens University Belfast, Belfast, United Kingdom; e-mail: d.gonzalezdecastro@qub.ac.uk; and Anton W. Langerak, Department of Immunology, Laboratory Medical Immunology, Erasmus University Medical Center, Dr. Molewaterplein 40, 3015 GD Rotterdam, The Netherlands; e-mail: a.langerak@erasmusmc.nl.

