

Key Points
Like T lymphoblastic leukemia, a subset of T lymphoblastic lymphomas shows an early T-cell phenotype.
Early T-cell phenotype T lymphoblastic lymphomas show recurrent genomic changes distinct from other cases of T lymphoblastic lymphoma.

Abstract
Early T-cell precursor phenotype acute lymphoblastic leukemia (ETP-ALL) is a subtype of T-ALL with a unique immunophenotype and genetic abnormalities distinct from conventional T-ALL. A subset of T lymphoblastic lymphoma (T-LLy) also demonstrates the early T-cell precursor immunophenotype and may be a counterpart of ETP-ALL. Unlike ETP-ALL, the incidence, clinical features, and genomic features of ETP-LLy are unknown. We reviewed the immunophenotyping data of 218 T-LLy patients who enrolled in the Children’s Oncology Group AALL0434 clinical trial and identified 9 cases (4%) exhibiting a definitive ETP immunophenotype. We performed single-nucleotide polymorphism array profiling on 9 ETP-LLy and 15 non-ETP T-LLy cases. Compared with non-ETP T-LLy, ETP-LLy showed less frequent deletion of 9p (CKDN2A/B), more frequent deletion of 12p (ETV6) and 1p (RPL22), and more frequent absence of biallelic T-cell receptor γ deletions. Recurrent abnormalities previously described in ETP-ALL such as deletions of 5q and 13q and gain of 6q were not observed in ETP-LLy cases. There were no failures of therapy among the ETP-LLy subtype with a 4-year event-free survival of 100%. Overall, ETP-LLy does not exhibit unifying genetic alterations but shows some distinct genomic features from non-ETP T-LLy suggesting that ETP-LLy may be a distinct entity from non-ETP T-LLy.
Introduction
T- cell lymphoblastic lymphoma (T-LLy) is an aggressive neoplasm of immature T-cell precursors and represents 25% to 30% of childhood non-Hodgkin lymphoma.1 It is classified as an overlapping entity with T-cell acute lymphoblastic leukemia (T-ALL) in the 2017 World Health Organization classification because they share morphologic and immunophenotypic features and are treated with similar strategies.2 Despite these similarities, clinical and molecular differences have been established suggesting potential pathogenetic differences. T-LLy and T-ALL share many clinical features, often presenting with an extramedullary mass in the mediastinum and/or lymph nodes. T-ALL by definition displays primary bone marrow involvement (defined as >25% bone marrow blasts).2 Genomic and gene expression studies have shown that T-LLy and T-ALL have different transcriptional and genetic characteristics.3-5 For example, genes involved in chemotactic responses and angiogenesis are differentially expressed5 and a copy number gain on chromosome 22q including the PIM3 oncogene is specifically found in T-ALL. However, the genomic abnormalities of T-LLy are not well-characterized because of the lack of fresh or frozen samples required for most genomic studies.
Early T-cell precursor acute lymphoblastic leukemia (ETP-ALL) is a subtype of T-ALL that shows an early T-cell precursor immunophenotype (CD1a−, CD8−, CD5− or weakly positive, CD34/myeloid antigen positive).2,6 Initial reports suggested that ETP-ALL was a high risk T-ALL subset with poor survival, but outcomes are comparable to non-ETP T-ALL in more recent studies.7-9 ETP-ALL demonstrates genetic abnormalities distinct from conventional T-ALL including less frequent deletions of CDKN2A/B and more frequent absence of biallelic T-cell receptor (TCR) γ deletion (ABD).10-13 ETP-ALL also exhibits some genetic abnormalities also observed in acute myeloid leukemia with less frequent NOTCH1 mutations; frequent mutations in FLT3, DNMT3A, RAS, and IDH genes; and 5q and 13q deletions.14,15 The World Health Organization 2017 classification of ALL included ETP-ALL as a provisional entity.2 A subset of T-LLy with an ETP immunophenotype has been described, suggesting that there may be an early T-cell precursor lymphoblastic lymphoma (ETP-LLy) counterpart of ETP-ALL.16 Unlike ETP-ALL, the incidence, clinical features, and genomic features of ETP-LLy are unknown.
In the present study, we sought to assess the incidence of ETP-LLy among a large cohort of T-LLy patients treated on the Children’s Oncology Group (COG) AALL0434 trial,17,18 and to compare the copy number profiles of ETP-LLy and non-ETP T-LLy using DNA isolated from archival formalin-fixed, paraffin-embedded (FFPE) samples. Our study provides an initial understanding of the genetic landscape of ETP-LLy and indicates that the underlying pathogenic mechanisms of ETP-LLy may differ from non-ETP T-LLy.
Methods
COG AALL0434 was a phase 3 trial developed for children, adolescents, and young adults 1 to 30.99 years old with T-ALL and T-LLy. AALL0434 was approved by the National Cancer Institute, Cancer Therapy Evaluation Program, Food and Drug Administration, and the Pediatric Central institutional review board, and by institutional review boards at each participating center. In accordance with the Declaration of Helsinki, informed consent/assent was obtained before study entry. The details and results of AALL0434 have been reported previously.18-21
Central pathology review of immunophenotyping data, including flow cytometry and immunohistochemistry, was performed for all T-LLy patients enrolled in AALL0434 to identify ETP cases according to the definition published by Costain-Smith et al.6 Cases were considered ETP if they were CD1a−, CD8−, CD5− or weak, and expressed at least 1 of the following stem/myeloid markers: CD34, CD13, CD33, CD117. Non-ETP T-LLy cases selected for comparison were required to express CD1a, CD5, and CD8. Clinical parameters including patient age, sex, and Murphy stage were extracted, and cytogenetic data were reviewed when available. The institutional review board of the University of Utah approved this study, and use of COG specimens was approved under study number ANHL17B1-Q.
Unstained slides leftover from central pathology review were used for DNA isolation. An hematoxylin and eosin stain was reviewed on each case to verify at least 80% tumor cells in sections. FFPE tissue from 10 slides per case was scraped into tubes, and DNA was isolated using the RecoverAll Total Nucleic Acid Isolation kit (Ambion/Applied Biosystems, Austin, TX) and quantitated with the PicoGreen assay (Invitrogen).
Genomic microarray hybridization was performed using OncoScan FFPE molecular inversion probe single-nucleotide polymorphism assay (MIP SNP, Affymetrix/ThermoFisher, Santa Clara, CA). The MIP SNP array was performed as previously described.22,23 Analysis was performed using Nexus copy number software version (version 8.0; BioDiscovery, El Segundo, CA) and Chromosome Analysis Suite (version 3.3; Applied Biosystems, Santa Clara, CA). Data that passed quality control criteria of the array (MAPD value < 0.6) were analyzed using Nexus Copy Number software and Chromosome Analysis Suite with NCBI build 37.0 of the human genome. The SNP-TuScan segmentation algorithm and default settings for significance and number of probes per segment were used. Minimal threshold setting of log2ratio for absence of biallelic ABD was −1.5 and a minimum of 5 probes per segment were required to determine the presence of ABD. Both number and size of copy number aberrations (CNAs) were used to measure the level of genomic instability in non-ETP T-LLy and ETP-LLy.6 The SNP array data have been deposited in NCBI's Gene Expression Omnibus24 and are accessible through GEO Series accession number GSE168884 (https://www.ncbi.nlm.nih.gov/geo/query/acc.cgi?acc=GSE168884).
Pairwise comparisons were made using the Fisher’s exact test, and continuous variable were comparted using the t test. Two-tailed P values are reported and were considered significant when P < .05. Survival analysis was performed using Kaplan-Meier curves.
Results
A total of 24 patient samples were analyzed. Nine ETP-LLy cases were identified using the criteria previously presented, and 15 non-ETP-LLy cases were randomly selected for comparison from among the remaining cases with non-ETP phenotypes and adequate tissue.
The clinical characteristics of the T-LLy patients are shown in supplemental Table 1. The mean age was 10.7 years (range, 1-23) with a male:female ratio of 2.0 for all 24 patients in the study. Patients were classified as Murphy stage 2 (n = 1), 3 (n = 9), or 4 (n = 9); staging data were not available on 5 patients.
A subset of T-LLy shows an ETP phenotype
A total of 9/218 T-LLy cases (4%) showed a definitive ETP phenotype as defined in the methods section (complete immunophenotyping data in supplemental Table 2). An additional 15 non-ETP cases were selected for comparison. There were no differences between ETP and non-ETP cases in age (10.3 vs 10.9, P = .8), male:female ratio (1.25 vs 2.75, P = .4), or stage (P = .35). In addition to the defined differences in immunophenotype, fewer ETP cases expressed CD2 (3/9 vs 13/15, P = .021) or CD4 (0/9 vs 14/15, P < .0001) than non-ETP cases.
Similarities and differences in the genetics lesions between ETP-LLy and non-ETP T-LLy
MIP SNP array was performed on the 24 cases (9 ETP-LLy and 15 non-ETP T-LLy) and identified CNAs and copy-neutral loss-of-heterozygosity (CN-LOH) (Figure 1). CNAs and/or CN-LOH were identified in 8 of 9 ETP-LLy cases and in 15/15 non-ETP T-LLy cases. The genetic lesions found by MIP SNP array for all 24 cases, along with cytogenetic results available in a subset of cases, are listed in Table 1. Genetic lesions observed in 2 or more ETP and/or non-ETP T-LLy cases were considered recurrent abnormalities and are summarized in Table 2. ETP-LLy cases showed significantly less frequent 9p deletion/CN-LOH than non-ETP T-LLy (4/9, 44% vs 14/15, 93%, P = .015; Figure 2A). All of the 9p deletion/CN-LOH lesions except case 21 include both CDKN2A and CDKN2B genes (Figure 2B; Table 1). The 9p deletion in case 21 (chr9: 21901262-21971430, hg19) includes exons 2-3 of the CDKN2A gene (NM_058195) but not the CDKN2B gene. Deletions of 12p including the ETV6 gene were only observed in ETP-LLy (3/9, 33% in ETP-LLy vs 0/15, 0% in non-ETP T-LLy, P = .042; Figure 2C-D). The minimal common deleted region on 12p (chr12: 9c512c809-25c551,025, hg19; Figure 2D; Table 1) contains the ETV6 gene. Deletions of 1p including the RPL22 gene were only observed in ETP-LLy (4/9, 44% in ETP-LLy vs 0/15, 0% in non-ETP T-LLy, P = .012; Figure 2E-F). The minimal common deleted region on 1p (chr1: 3c921c449-7c050c061, hg19) seen in case 23 includes the RPL22 gene (Figure 2F; Table 1).
Deletions of the TCR gene regions are a normal part of TCR rearrangement and can be detected by SNP array in a clonal population. ABD at 7p14.1 is more frequent in ETP-LLy compared with non-ETP T-LLy (8/9, 88.9% in ETP-LLy vs 5/15, 33.3% in non-ETP T-LLy, P = .013).
Focal PHF6 deletions on Xq and gain of NUP214-ABL1 fusion on 9q were observed together in 2 cases, 1 non-ETP T-LLy case (case 11) and 1 ETP-LLy case (case 23) (Tables 1 and 2). Two non-ETP T-LLy cases (cases 14 and 15) were noted to have CHIC2 deletions. CHIC2 deletions result in FIP1L1-PDGFRA fusion and upregulated tyrosine kinase activity. They have been described in chronic eosinophilia as well as T/myeloid proliferations that can present as acute myeloid leukemia, T-LLy, or both, which are often associated with eosinophilia.2 Neither of the cases showed increased eosinophils in the blood (0.7 and 0.2 k/µL, respectively) or lymphoma tissue; however, the bone marrow pathology report for case 14 did note 17% eosinophils in the aspirate smear, whereas case 15 had 6%. A myeloid leukemia component was not reported in either case.
Previous SNP array analysis showed significantly more CNAs in ETP-ALL compared with non-ETP T-ALL, suggesting a higher genomic instability in ETP-ALL.6 In our study, ETP-LLy cases showed a trend but not significantly more or larger CNAs than the non-ETP T-LLy cases (Table 3).
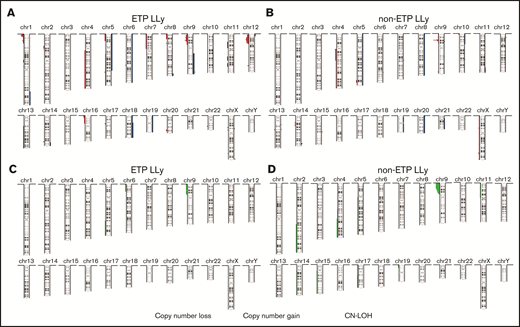
Summary of copy number aberrations (CNAs). (A-B) and copy-neutral loss-of-heterozygosity (CN-LOH) (C-D) in ETP-LLy (A,C) and non-ETP T-LLy (B,D). In panels A and B, losses are to the left and gains are to the right, and the amplitude reflects the incidence.
Summary of copy number aberrations (CNAs). (A-B) and copy-neutral loss-of-heterozygosity (CN-LOH) (C-D) in ETP-LLy (A,C) and non-ETP T-LLy (B,D). In panels A and B, losses are to the left and gains are to the right, and the amplitude reflects the incidence.
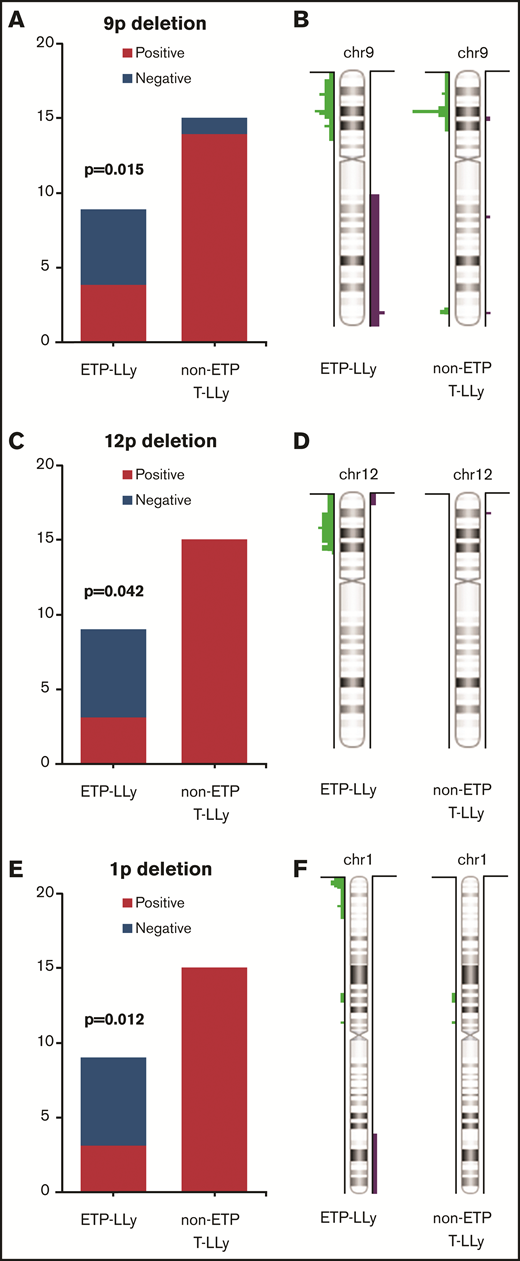
Comparison of frequency and distributionof 9p, 12p, and 1p deletions in ETP-LLy and non-ETP T-LLy. (A,C,E) Frequency, (B,D,F) distribution.
Comparison of frequency and distributionof 9p, 12p, and 1p deletions in ETP-LLy and non-ETP T-LLy. (A,C,E) Frequency, (B,D,F) distribution.
Complete list of copy number abnormalities and loss of heterozygosity by SNP array for each case
| Case no. | Chromosome region | Cytoband | Event | Length (Mb) | Cytogenetic study |
|---|---|---|---|---|---|
| 1 | chr9:204c738-36c232,413 | p24.3-p13.3 | CN-LOH | 36.03 | NA |
| chr9:21c778,976-22c081,850 | p21.3 | Homozygous deletion | 0.30 | ||
| chr9:133c510,616-133c730,353 | q34.12 | Deletion | 0.22 | ||
| chr11:192c764-51c575,951 | p15.5-p11.12 | CN-LOH | 51.38 | ||
| chr14:22c922,369-36c982,350 | q11.2-q13.3 | Deletion | 14.06 | ||
| chr17:37c291,349-80c263,427 | q12-q25.3 | CN-LOH | 42.97 | ||
| 2 | chr9:204c738-23c386,738 | p24.3-p21.3 | CN-LOH | 23.18 | NA |
| chr9:21c856,470-22c176,560 | p21.3 | Homozygous deletion | 0.32 | ||
| chr10:0-36c046,475 | p15.3-p11.21 | Gain | 36.05 | ||
| chr10:89c617,344-90c167,065 | q23.31 | High copy gain, CN = 4 | 0.55 | ||
| chr14:98c086,294-99c793,689 | q32.2 | Gain | 1.71 | ||
| chrX:0-155c270,560 | p22.33-q28 | Deletion | 155.27 | ||
| 3 | chr9:204c738-27c123,260 | p24.3-p21.2 | CN-LOH | 26.92 | 46,XY,t1,14(32P;q11.2)[6]/46XY[9] (TAL1-TCR fusion) |
| chr9:21c331,119-22c549,702 | p21.3 | Homozygous deletion | 1.22 | ||
| 4 | chr5:38c139-180c698,312 | p15.33-q35.3 | Gain | 180.66 | NA |
| chr9:19c277,320-21c853,221 | p22.1-p21.3 | Deletion | 2.58 | ||
| chr9:21c856,470-22c004,153 | p21.3 | Homozygous deletion | 0.15 | ||
| chr9:22c004,669-23c897,432 | p21.3 | Deletion | 1.89 | ||
| chr20:69c094-15c687,866 | p13-p12.1 | Gain | 15.62 | ||
| chr20:15c691,240-15c792,451 | p12.1 | Gain | 0.10 | ||
| chr20:15c795,175-62c912,463 | p12.1-q13.33 | Gain | 47.12 | ||
| 5 | chr6:135c483,742-135c754,471 | q23.3 | High copy gain, CN = 4 | 0.27 | 47,XY,t11,19(q23;p13.3), +der(19)t11,19[5]/46,XY[21]; FISH positive for MLL rearrangement in 7.5% cells |
| chr9:204c738-39c184,065 | p24.3-p13.1 | CN-LOH | 38.98 | ||
| chr10:607c980-718c912 | p15.3 | Deletion | 0.11 | ||
| chr11:118c411,424-134c938,847 | q23.3-q25 | Gain | 16.53 | ||
| chr13:32c929,387-32c952,164 | q13.1 | Gain | 0.02 | ||
| chr19:6c585c298-23c460,785 | p13.3-p12 | Gain | 16.88 | ||
| chr19:28c462,580-59c093,239 | q11-q13.43 | Gain | 30.63 | ||
| chrX:154c979,673-155c219,364 | q28 | Gain | 0.24 | ||
| 6 | chr5:48c877,508-180c915,260 | q11.1-q35.3 | CN-LOH | 132.04 | NA |
| chr9:204c738-21c951,040 | p24.3-p21.3 | Deletion | 21.75 | ||
| chr9:21c953,099-25c029,497 | p21.3 | Homozygous deletion | 3.08 | ||
| chr9:25c049,865-27c722,059 | p21.3-p21.2 | Gain | 2.67 | ||
| chr13:48c984,722-49c065,037 | q14.2 | Homozygous deletion | 0.08 | ||
| chr14:36c649,246-36c949,593 | q13.3 | Deletion | 0.30 | ||
| chrX:154c979,673-155c219,364 | q28 | Deletion | 0.24 | ||
| 7 | chr4:52c657,621-191c154,276 | q11-q35.2 | Deletion | 138.50 | FISH positive for nullisomy of CDKN2A (9p21) gene in 88% cells; karyotype NA |
| chr8:0-146c364,022 | p23.3-q24.3 | Gain | 146.36 | ||
| chr9:11c311,712-13c036,747 | p23 | Deletion | 1.73 | ||
| chr9:21c242,161-21c813,718 | p21.3 | Deletion | 0.57 | ||
| chr9:21c816,528-22c655,723 | p21.3 | Homozygous deletion | 0.84 | ||
| chr9:22c669,166-23c694,188 | p21.3 | Deletion | 1.03 | ||
| chr13:19c084,823-115c103,150 | q11-q34 | Gain | 96.02 | ||
| chr15:22c752,399-102c397,317 | q11.2-q26.3 | CN-LOH | 79.64 | ||
| chr17:0-81c195,210 | p13.3-q25.3 | CN-LOH | 81.20 | ||
| chr19:247c232-10c976,405 | p13.3-p13.2 | CN-LOH | 10.73 | ||
| chr21:9c648c315-48c097,610 | p11.2-q22.3 | Gain | 38.45 | ||
| 8 | chr4:126c144,980-191c154,276 | q28.1-q35.2 | CN-LOH | 65.01 | FISH negative for BCR-ABL, karyotype NA |
| chr9:204c738-33c282,392 | p24.3-p13.3 | CN-LOH | 33.08 | ||
| chr9:21c901,263-21c993,964 | p21.3 | Homozygous deletion | 0.09 | ||
| chr16:3c892c461-4c518c754 | p13.3 | Deletion | 0.63 | ||
| 9 | chr9:62c209-19c471,279 | p24.3-p22.1 | CN-LOH | 19.41 | NA |
| chr9:19c628,633-32c741,593 | p22.1-p21.1 | Deletion | 13.11 | ||
| chr11:127c117,212-129c553,078 | q24.2-q24.3 | Deletion | 2.44 | ||
| 10 | chr9:204c738-36c489,161 | p24.3-p13.2 | CN-LOH | 36.28 | NA |
| chr9:21c827,992-22c008,313 | p21.3 | Homozygous deletion | 0.18 | ||
| 11 | chr2:144c545,138-243c052,331 | q22.3-q37.3 | CN-LOH | 98.51 | NA |
| chr2:213c584,595-214c009,831 | q34 | Deletion | 0.43 | ||
| chr9:21c901,263-21c993,468 | p21.3 | Homozygous deletion | 0.09 | ||
| chr9:21c993,964-22c098,619 | p21.3 | Deletion | 0.10 | ||
| chr9:133c719,421-134c094,802 | q34.12-q34.13 | Gain | 0.38 | ||
| chr13:48c984,722-49c065,037 | q14.2 | Homozygous deletion | 0.08 | ||
| chr13:50c652,628-51c516,305 | q14.2-q14.3 | Deletion | 0.86 | ||
| chrX:130c973,820-134c581,228 | q26.2-q26.3 | Deletion | 3.61 | ||
| 12 | chr9:131c468,740-133c828,128 | q34.11-q34.12 | Deletion | 2.36 | NA |
| 13 | chr5:162c623,390-170c762,448 | q34-q35.1 | Deletion | 8.14 | NA |
| chr9:20c678,439-21c987,472 | p21.3 | Deletion | 1.31 | ||
| chr9:21c988,896-22c207,037 | p21.3 | Homozygous deletion | 0.22 | ||
| chr11:114c990,423-118c489,708 | q23.3 | CN-LOH | 3.50 | ||
| chr14:22c187,584-107c282,024 | q11.2-q32.33 | CN-LOH | 85.09 | ||
| 14 | chr4:54c296,381-55c130,682 | q12 | Deletion | 0.83 | Normal karyotype |
| chr9:204c738-39c184,065 | p24.3-p13.1 | CN-LOH | 38.98 | ||
| chr9:21c928,654-22c114,495 | p21.3 | Deletion | 0.19 | ||
| chrX:44c810,604-44c896,206 | p11.3 | Homozygous deletion | 0.09 | ||
| 15 | chr4:54c324,930-55c102,425 | q12 | Deletion | 0.78 | NA |
| chr4:55c105,182-64c560,949 | q12-q13.1 | Deletion | 9.46 | ||
| chr4:64c573,303-83c148,663 | q13.1-q21.22 | Deletion | 18.58 | ||
| chr4:83c164,184-93c288,641 | q21.22-q22.1 | Deletion | 10.12 | ||
| chr4:92c607,449-191c154,276 | q22.1-q35.2 | CN-LOH | 98.55 | ||
| chr6:135c293,365-135c754,471 | q23.3 | High copy gain, CN = 4 | 0.46 | ||
| chr7:92c245,458-92c471,899 | q21.2 | High copy gain, CN = 4 − 5 | 0.23 | ||
| chr9:204c738-39c184,065 | p24.3-p13.1 | CN-LOH | 38.98 | ||
| chr9:21c965,073-22c014,524 | p21.3 | Homozygous deletion | 0.05 | ||
| chr9:80c446,364-80c704,731 | q21.2 | High copy gain, CN = 4 − 5 | 0.26 | ||
| chr11:128c157,643-128c615,486 | q24.3 | Gain | 0.46 | ||
| chr12:11c795,269-12c059,452 | p13.2 | Gain | 0.26 | ||
| chr13:48c885,423-49c262,256 | q14.2 | Gain | 0.38 | ||
| chr14:98c100,176-100c100,128 | q32.2 | Gain | 2.00 | ||
| chr15:56c642,839-58c955,123 | q21.3 | Gain | 2.31 | ||
| 16 | chr11:79c517,863-93c209,472 | q14.1-q21 | Deletion | 13.69 | 46,XX,t7,12(p13;p13), ?add17(p11.2)[16]/46,XX[11] |
| 17 | chr1:202c643,208-249c212,878 | q32.1-q44 | Gain | 46.57 | 51,XY,+5,del5(q31),+6, +del9(p13),?inv9(p24q21)x2, der(11)t1,11(q32;q?230,+18, +19[9]; FISH positive for 9p21 homozygous deletion in 89% cells; negative for MLL rearrangement and BCR-ABL fusion. |
| chr5:38c139-128c975,230 | p15.33-q23.3 | Gain | 128.94 | ||
| chr5:128c846,774-180c698,312 | q23.3-q35.3 | CN-LOH | 51.85 | ||
| chr6:204c909-31c553,468 | p25.3-p21.33 | Gain | 31.35 | ||
| chr6:31c555,130-32c162,418 | p21.33-p21.32 | Gain | 0.61 | ||
| chr6:32c167,778-170c913,051 | p21.32-q27 | Gain | 138.75 | ||
| chr8:138c891,978-146c292,734 | q24.23-q24.3 | Gain | 7.40 | ||
| chr9:0-12c042,349 | p24.3-p23 | CN-LOH | 12.04 | ||
| chr9:12c054,659-13c345,642 | p23 | Homozygous deletion | 1.29 | ||
| chr9:13c354,725-21c585,658 | p23-p21.3 | CN-LOH | 8.23 | ||
| chr9:21c604,067-24c075,082 | p21.3 | Homozygous deletion | 2.47 | ||
| chr9:24c044,951-38c802,685 | p21.3-p13.1 | CN-LOH | 14.76 | ||
| chr9:68c170,421-141c054,761 | q13-q34.3 | Gain | 72.88 | ||
| chr14:95c161,449-107c282,024 | q32.13-q32.33 | Gain | 12.12 | ||
| chr18:0-78c077,248 | p11.32-q23 | Gain | 78.08 | ||
| chr19:0-59c128,983 | p13.3-q13.43 | Gain | 59.13 | ||
| 18 | Normal female | NA | |||
| 19 | chr1:754c192-8c788c907 | p36.33-p36.23 | Deletion | 8.03 | NA |
| chr1:91c967,341-99c114,927 | p22.2-p21.3 | Deletion | 7.15 | ||
| chr8:172c417-17c835,685 | p23.3-p22 | Deletion | 17.66 | ||
| chr10:89c432,286-90c306,376 | q23.2-q23.31 | Deletion | 0.87 | ||
| chr11:28c057,957-49c688,837 | p14.1-p11.12 | Deletion | 21.63 | ||
| chr12:189c400-25c551,025 | p13.33-p12.1 | Deletion | 25.36 | ||
| chr12:27c498,107-32c164,030 | p11.23-p11.21 | Deletion | 4.67 | ||
| chr17:400c959-1c461c125 | p13.3 | Gain | 1.06 | ||
| chrX:41c201,762-41c531,564 | p11.4 | Homozygous deletion | 0.33 | ||
| chrX:42c869,649-44c344,324 | p11.3 | Homozygous deletion | 1.47 | ||
| chrX:45c481,094-48c206,911 | p11.3-p11.23 | Gain | 2.73 | ||
| chrX:50c817,478-52c695,241 | p11.22 | Homozygous deletion | 1.88 | ||
| chrX:154c979,673-155c219,364 | q28 | Gain | 0.24 | ||
| 20 | chr6:108c974,746-110c936,144 | q21 | Deletion | 1.96 | NA |
| chr12:189c400-29c877,262 | p13.33-p11.22 | Deletion | 29.69 | ||
| 21 | chr9:148c341-21c900,510 | p24.3-p21.3 | CN-LOH | 21.75 | NA |
| chr9:21c900,511-21c971,583 | p21.3 | Homozygous deletion | 0.07 | ||
| chr9:21c971,584-34c406,287 | p21.3-p13.3 | CN-LOH | 12.43 | ||
| 22 | chr1:754c192-33c899,167 | p36.33-p35.1 | Deletion | 33.14 | NA |
| chr4:58c592,202-190c915,650 | q12-q35.2 | Deletion | 132.32 | ||
| chr5:38c139-24c037,074 | p15.33-p14.2 | Deletion | 24.00 | ||
| chr5:70c306,678-180c698,312 | q13.2-q35.3 | Deletion | 110.39 | ||
| chr7:41c421-52c432,938 | p22.3-p12.1 | Deletion | 52.39 | ||
| chr9:4c304c915-21c255,150 | p24.2-p21.3 | Deletion | 16.95 | ||
| chr9:21c265,500-25c891,012 | p21.3-p21.2 | Homozygous deletion | 4.63 | ||
| chr12:9c512c809-30c667,228 | p13.31-p11.22 | Deletion | 21.15 | ||
| chr13:36c912,708-115c103,150 | q13.3-q34 | Deletion | 78.19 | ||
| chr16:83c887-27c690,168 | p13.3-p12.1 | Deletion | 27.61 | ||
| chr18:26c057,437-78c007,784 | q12.1-q23 | Gain | 51.95 | ||
| 23 | tetraploidy | NA | |||
| chr1:3c921c449-7c050c061 | p36.32-p36.31 | Deletion, CN = 2 | 3.13 | ||
| chr1:23c103,620-24c108,104 | p36.12-p36.11 | Deletion, CN = 2 | 1.00 | ||
| chr1:114c594,372-115c470,556 | p13.2 | Deletion, CN = 2 | 0.88 | ||
| chr2:54c374,691-55c005,224 | p16.2-p16.1 | Deletion, CN = 2 | 0.63 | ||
| chr5:133c415,731-134c917,467 | q31.1 | Deletion, CN = 2 | 1.50 | ||
| chr6:0-26c382,744 | p25.3-p22.2 | CN-LOH, CN = 4 | 26.38 | ||
| chr8:33c078,287-33c503,454 | p12 | Deletion, CN = 2 | 0.43 | ||
| chr9:30c001,529-30c721,717 | p21.1 | Deletion, CN = 2 | 0.72 | ||
| chr9:133c618,461-134c097,558 | q34.12-q34.13 | High copy gain, CN = 6 | 0.48 | ||
| chr10:104c369,298-104c562,842 | q24.32 | Deletion, CN = 2 | 0.19 | ||
| chr11:103c091,553-114c475,360 | q22.3-q23.2 | Deletion, CN = 2 | 11.38 | ||
| chr12:17c200,436-18c268,880 | p12.3 | Deletion, CN = 2 | 1.07 | ||
| chr12:110c067,819-111c370,885 | q24.11 | Deletion, CN = 2 | 1.30 | ||
| chr12:111c370,885-111c911,916 | q24.11-q24.12 | Homozygous deletion, CN = 0 | 0.54 | ||
| chr12:111c911,916-112c035,561 | q24.12 | Deletion, CN = 2 | 0.12 | ||
| chr14:91c600,426-94c111,212 | q32.11-q32.12 | Deletion, CN = 2 | 2.51 | ||
| chr16:0-2c210c796 | p13.3 | Deletion, CN = 2 | 2.21 | ||
| chr16:7c299c668-8c301c002 | p13.3-p13.2 | Deletion, CN = 2 | 1.00 | ||
| chr17:27c957,832-29c631,473 | q11.2 | Deletion, CN = 2 | 1.67 | ||
| chr17:29c631,473-29c897,502 | q11.2 | Homozygous deletion, CN = 0 | 0.27 | ||
| chr17:29c897,502-30c692,775 | q11.2 | Deletion, CN = 2 | 0.80 | ||
| chr18:76c375,122-77c458,776 | q23 | Deletion, CN = 2 | 1.08 | ||
| chr20:49c176,050-53c504,956 | q13.13-q13.2 | Deletion, CN = 2 | 4.33 | ||
| chr22:37c543,717-39c369,251 | q12.3-q13.1 | Deletion, CN = 2 | 1.83 | ||
| chrX:133c432,498-134c242,874 | q26.2-q26.3 | Deletion, CN = 2 | 0.81 | ||
| 24 | chr1:754c192-9c617c682 | p36.33-p36.22 | Deletion | 8.86 | NA |
| chr2:42c280,854-50c636,065 | p21-p16.3 | Deletion | 8.36 | ||
| chr9:204c738-38c495,131 | p24.3-p13.1 | Deletion | 38.29 | ||
| chr9:68c170,421-141c054,761 | q13-q34.3 | Gain | 72.88 | ||
| chr12:189c400-6c771c877 | p13.33-p13.31 | Gain | 6.58 | ||
| chrX:154c979,673-155c219,364 | q28 | Gain | 0.24 |
The last column includes karyotype and/or FISH data when available. Cases 1-15 are non-ETP T-LLy; cases 16-24 are ETP-LLy.
NA, not available.
Recurrent CNAs and CN-LOHs in T-LLy with the incidence in ETP and non-ETP cases along with the genomic coordinates
| Chromosome | Cases | Incidence in ETP-LLy | Incidence in Non-ETP T-LLy | P value (ETP vs non ETP) | Minimal common region | Start genomic coordinates | Stop genomic coordinates | Affected genes |
|---|---|---|---|---|---|---|---|---|
| Recurrent gains | ||||||||
| 6 | 5, 15 | 0/9 | 2/15 | .511 | 6q23.3 | 135c483,742 | 135c754,471 | MYB |
| 9 | 11, 23 | 1/9 | 1/15 | 1.000 | 9q34.12q34.13 | 133c719,421 | 134c094,802 | NUP14-ABL1 |
| Recurrent losses | ||||||||
| 1 | 19, 22, 23, 24 | 4/9 | 0/15 | .012* | 1p36.32p36.31 | 3c921c449 | 7c050c061 | RPL11 |
| 12 | 19, 20, 22 | 3/9 | 0/15 | .042* | 12p12.3 | 17c200,436 | 18c268,880 | RERGL |
| 13 | 6, 11 | 0/9 | 2/15 | .511 | 13q14.2 | 48c984,722 | 49c065,037 | RB1 |
| 4 | 14, 15 | 0/9 | 2/15 | .511 | 4q12 | 54c324,930 | 55c102,425 | FIP1L1, CHIC, PDGFRa |
| X | 11, 23 | 1/9 | 1/15 | 1.000 | Xq26.2q26.3 | 130c973,820 | 134c242,874 | PHF6 |
| Recurrent LOHs | ||||||||
| 4 | 8, 15 | 0/9 | 2/15 | .511 | 4q28.1q35.2 | 126c144,980 | 191c154,276 | FBXW7 |
| Recurrent losses and/or LOHs | ||||||||
| 9 | 1-11, 13-15, 17, 21, 22, 24 | 4/9 | 14/15 | .015* | 9p21.3 | 21c901,263 | 21c993,468 | CDKN2A, CDKN2B |
Cases 1-15 are non-ETP T-LLy, and cases 16-24 are ETP-LLy.
P < .05.
Comparison of average number and size of CNAs between non-ETP T-LLy and ETP-LLy
| Average no. of CNAs per case | ||||||
|---|---|---|---|---|---|---|
| One copy gain | Two or more copy gain | Heterozygous loss | Biallelic loss | Total CNAs | Average size of CNAs per case (Mb) | |
| Non-ETP T-LLy | 1.40 | 0.33 | 1.93 | 0.93 | 4.6 | 70.30 |
| ETP-LLy | 1.89 | 0.11 | 4.78 | 1 | 7.78 | 160.66 |
| P value | 0.65 | 0.45 | 0.13 | 0.85 | 0.19 | 0.23 |
Mb, megabases of genome involved.
Correlation between cytogenetic and MIP SNP array studies
Chromosome and/or fluorescence in situ hybridization (FISH) results are available for 7 cases including 5 non-ETP T-LLy and 2 ETP-LLy cases (Table 1). MIP SNP array detected unbalanced rearrangements observed by chromosome or FISH studies including the unbalanced KMT2A (MLL) rearrangement in case 5, CDKN2A deletion in case 7, and complex numerical and structural rearrangements in case 17. In case 5, the breakpoints of CNAs on chromosomes 11 and 19 are located at the KMT2A and MLLT1 genes supporting the translocation involving the KMT2A and MLLT1. This translocation is associated with acute leukemia including T-ALL.25
Balanced rearrangements including translocation between chromosomes 1 and 14 resulting in TAL1-TCRαδ fusion in case 3 and balanced translocation between chromosomes 7 and 12 in case 16 were not detected by MIP SNP array as expected. MIP SNP array detected additional CNAs and CN-LOH in all cases with chromosome and/or FISH results (cases 3, 5, 7, 8, 14, 16, and 17). In addition, MIP array was able to detect CNAs and CN-LOH in 15 of 17 cases without chromosomal analysis or FISH results.
Comparison of patient outcome
Patient outcomes were assessed after a median follow-up of 6.3 years (range, 0.7-8.4 years). Patients with ETP-LLy had an excellent outcome with no failures or treatment related deaths leading to a 4-year event-free survival (EFS) of 100%. This is in comparison with 1 relapse and 2 remission deaths in the 15 non-ETP LLy patients in this small cohort leading to a 4-year EFS of 79%. EFS and overall survival were not different between ETP and non-ETP T-LLy in our cohort (supplemental Figure 1). However, these findings must be interpreted with appropriate caution because of the small number of patients, the missing stage data in 5 patients, and the selection of patients based on availability of immunophenotyping data and unstained slides.
Discussion
Patel et al first reported ETP-LLy having an incidence of 4% with an additional 7% that showed ETP features but were incompletely immunophenotyped.16 In the present study, we have confirmed 4% incidence of pediatric ETP-LLy in a separate cohort and further assessed the immunophenotypic and genomic characteristics of this subtype. ETP-LLy patients were not different in terms of age or sex, but the lymphomas were less likely to express CD2 and CD4 than non-ETP T-LLy. Lack of CD4 in ETP-ALL has been described and proposed as part of an alternative immunophenotypic definition.9
In our study, ETP-LLy showed less frequent 9p deletions including the CDKN2A/CDKN2B genes and more frequent 12p deletions including the ETV6 gene compared with non-ETP T-LLy. Similar findings have been reported in ETP-ALL.10-12,14,15,26 Deletions of 9p were identified in 93% (14/15 cases) in non-ETP T-LLy cases in our cohort, which is higher than 33% frequency (3/9 cases) reported previously in a smaller cohort of T-LLy4 but closer to the 75% (12/16) recently reported in T-LLy27 and the 75% to 83% frequency reported previously in T-ALL.10,11,14 The higher incidence of 9p deletion in our selected non-ETP patients thus may not be representative, and the true incidence should be assessed in future studies of larger cohorts.
In our study, 1p deletions including the RPL22 gene were frequent in ETP-LLy (44%) but not seen in non-ETP T-LLy. The RPL22 gene encodes a component of the RNA-binding 60S ribosomal subunit. Autosomal dominant germline mutations in multiple ribosomal protein family members result in impaired ribosome biogenesis and function, termed ribosomopathies, and bone marrow failure syndrome such as Diamond-Blackfan syndrome with subsequent risk of development MDS and AML.28 Somatic mutations in the ribosomal proteins RPM5 and RPL10 are reported in ?10% of pediatric T-ALL patients.29RPL22 is a component of the TCR signaling pathway and is essential during T-cell development.30RPL22 haploinsufficiency has been reported in 10% T-ALL, but this study did not specify the immunophenotype of the patients so it is not known if some of the patients had ETP-ALL.31 Our study is the first to specifically associate RPL22 gene deletion with ETP-LLy, and may provide novel insights in the pathogenesis of ETP-LLy. Additional studies are needed to determine if RPL22 gene deletion is also characteristic of ETP-ALL.
ABD characterizes early thymocyte precursors before V(D)J recombination and is associated with early treatment failure in both pediatric T-ALL and T-LLy,3,32 although a more recent study showed no difference in outcomes.9 We noted more frequent ABD in ETP-LLy, similar to previous studies in ETP-ALL.9,10,13
Other recurrent CNAs observed in both ETP-ALL and non-ETP T-ALL include 6q gains involving the MYB gene, 13q deletions including the RB1 genes.11,14,33,34 The 6q gain, 13q deletion, and CHIC2 deletions are each present in 2 non-ETP T-LLy cases but not in ETP-LLy patients in our study. The 4q deletion involving CHIC2 resulting in fusion between FIP1L1 and PDGFRα is previously reported in T-ALL, but this abnormality was not present in the in ETP-ALL patients.14 Additional independent studies are needed to confirm if these abnormalities are limited in non-ETP T-ALL or can be present in both subtypes. Multiple complex rearrangements suggesting chromothripsis previously reported in ETP-ALL were not seen in ETP-LLy samples in this study. ETP-LLy cases may exhibit less genomic instability than ETP-ALL,6 but this was not directly assessed in our study. Such differences may correspond to the difference in outcome that we observed in this study compared with reports suggesting ETP-ALL was associated with an inferior outcome compared with non-ETP-ALL.6
Some recurrent CNAs are seen in both ETP and non-ETP T-LLy cases. Focal PHF6 deletions on the long arm of chromosome X and NUP214-ABL1 fusion amplification were observed in non-ETP T-LLy case 11 and ETP-LLy case 23. PHF6 plays a role in epigenetic regulation of gene expression and was identified as a key tumor suppressor gene in T-ALL. PHF6 mutation and/or deletion was reported almost exclusively in male T-ALL patients by Van Vlierberghe et al.35 However, the PHF6 deletion in case 23 (female) is heterozygous, affecting 1 copy of chromosome X. It is possible that the PHF6 copy on the other chromosome X homolog may be silenced by X-inactivation or carry mutation resulting in loss of function in both copies. Co-occurrence of PHF6 deletion and NUP214-ABL1 fusion amplification has not been reported previously, to the best of our knowledge.36 The presence of both abnormalities in 1 ETP-LLy case and 1 non-ETP T-LLy case suggests that these 2 abnormalities may be associated with each other and are not specific for the ETP-LLy subtype.
The 6q CN-LOH, deletion of the CASP8AP2 gene on chromosome 6 (also known as FLASH deletion), and PTEN deletion have been previously reported in T-LLy and T-ALL and shown to have prognostic association.3,27 These abnormalities were not observed in our study in either ETP or non-ETP T-LLy.
In comparing MIP SNP array data to cytogenetic and FISH data when available, the MIP SNP array detected all cytogenetic and FISH abnormalities except the balanced translocations. In each case, additional CNAs and CN-LOH were detected by MIP SNP array highlighting that it is a superior test for CNA and LOH detection than conventional chromosome and FISH analysis. In addition, MIP array can be used in LLy patients without access to fresh tissue for chromosomal analysis or when the chromosome analysis fails.
The outcomes for the ETP patients in our cohort were excellent and not significantly different than the outcomes for patients with non-ETP phenotype T-LLy. These findings are in line with recent studies that demonstrated noninferior outcomes of ETP-ALL7-9 but should also be interpreted with appropriate caution because of the small number of patients.
One important limitation of our study may be the classification of ETP-LLy based on immunophenotyping rather than gene expression profiling. The ETP-ALL entity was originally defined by gene expression profiling, and Zuurbier et al demonstrated that ETP classification by immunophenotyping likely underestimates the actual incidence relative to gene expression profiling.9 In addition, we used a strict definition of ETP/non-ETP and thus excluded near-ETP cases from our assessment.15
In conclusion, we have established an incidence of ETP-LLy of 4% and demonstrated that ETP-LLy exhibit distinct features from non-ETP T-LLy at the genomic level including less frequent 9p deletion including CDK2A/B and more frequent 12p deletion including ETV6. We identified RPL22 deletion on 1p as a recurrent finding in ETP-LLy suggesting ribosomal biogenesis dysfunction may play a role in the pathogenesis of some ETP-LLy. Finally, the MIP SNP array may have clinical utility for assessment of T-LLy specimens, especially when only fixed tissue is available.
Acknowledgments
This work was supported by the National Institutes of Health, National Cancer Institute’s National Clinical Trials Network (NCTN) Operations Center Grant U10CA180886, the NCTN Statistics & Data Center Grant U10CA180899, and the Children’s Oncology Group Biospecimen Bank Grant U24CA196173.
The content is solely the responsibility of the authors and does not necessarily represent the official views of the National Institutes of Health.
Authorship
Contribution: X.X., C.N.P., S.L.P., and R.R.M. designed the study, performed the research, and analyzed the data; M.D. performed the statistical analysis; and R.J.H., K.P.D., S.S.W., S.P.H., N.J.W., W.L.C., M.L.L., T.G.G., and C.M.B. designed and supported the AALL0434 clinical trial through the Children’s Oncology Group acute lymphoblastic leukemia and non-Hodgkin lymphoma disease committees.
Conflict-of-interest disclosure: M.L.L. served on the advisory board of MediSix Therapeutics. The remaining authors declare no competing financial interests.
The current affiliation for X.X. is Department of Laboratory Medicine and Pathology, Mayo Clinic, Rochester, MN.
Correspondence: Rodney R. Miles, University of Utah Department of Pathology, 15 N Medical Dr E, JMRB Room 2100, Salt Lake City, UT 84112; e-mail: rodney.miles@path.utah.edu.

