

Key Points
The functional role of TAMs in MCL is not well known.
We investigated cross-talk between TAMs and MCL, which determines macrophage polarity and tumorigenesis.

Abstract
Tumor-associated macrophages (TAMs) are recognized as a hallmark of certain solid cancers and predictors of poor prognosis; however, the functional role of TAMs in lymphoid malignancies, including B-cell lymphoma, has not been well defined. We identified infiltration of F4/80+ TAMs in a syngeneic mouse model using the recently generated murine mantle cell lymphoma (MCL) cell line FC-muMCL1. Multicolor flow cytometric analysis of syngeneic lymphoma tumors showed distinct polarization of F4/80+ TAMs into CD206+ M2 and CD80+ M1 phenotypes. Using human MCL cell lines (Mino, Granta, and JVM2), we further showed that MCL cells polarized monocyte-derived macrophages toward an M2-like phenotype, as assessed by CD163+ expression and increased interleukin-10 (IL-10) level; however, levels of the M1 markers CD80 and IL-12 remained unaffected. To show that macrophages contribute to MCL tumorigenesis, we xenografted the human MCL cell line Mino along with CD14+ monocytes and compared tumor growth between these 2 groups. Results showed that xenografted Mino along with CD14+ monocytes significantly increased the tumor growth in vivo compared with MCL cells alone (P < .001), whereas treatment with liposomal clodronate (to deplete the macrophages) reversed the effect of CD14+ monocytes on growth of MCL xenografts (P < .001). Mechanistically, IL-10 secreted by MCL-polarized M2-like macrophages was found to be responsible for increasing MCL growth by activating STAT1 signaling, whereas IL-10 neutralizing antibody or STAT1 inhibition by fludarabine or STAT1 short hairpin RNA significantly abolished MCL growth (P < .01). Collectively, our data show the existence of a tumor microenvironmental network of macrophages and MCL tumor and suggest the importance of macrophages in interventional therapeutic strategies against MCL and other lymphoid malignancies.
Introduction
Mantle cell lymphoma (MCL) is a subtype of B-cell non-Hodgkin lymphoma with a median survival of 4 to 5 years after diagnosis and a relapse-free survival of 7 to 12 months after second-line therapy.1,2 Novel agents targeting the B-cell receptor signaling pathway or the lymphoma microenvironment were approved by the US Food and Drug Administration in 2013 for the treatment of patients with relapsed and refractory MCL.3-5 Despite these important advances, MCL is still considered incurable, and the majority of patients with MCL eventually succumb to their disease. A fundamental obstacle to improving this unfavorable outcome is the inability to overcome intrinsic resistance mechanisms of MCL tumors that lead to relapse despite the initial response to induction and/or maintenance treatment. The development and progression of B-cell lymphomas in general involve complex interactions between the malignant B cells and their surrounding cells. Several tumor-intrinsic or tumor-extrinsic factors from infiltrating nonmalignant cells can contribute to the disease progression and drug resistance in lymphoma.
In this regard, tumor-associated macrophages (TAMs) as immune cells within the tumor microenvironment have gained much interest as advances regarding their roles in tumor progression have unfolded. Pro-tumor and immune evasion roles of TAMs, and their clinical significance as a biomarker of predictive and prognostic value across different solid cancer types, have recently been highlighted.6-10 Macrophages are innate immune cells that originate from progenitor cells in the bone marrow, circulate in the blood as monocytes, and are differentiated by the microenvironment after extravasation into tissues. The polarization states of macrophages are largely categorized as classically activated M1 macrophages (M1-Mφ) or alternatively activated M2 macrophages (M2-Mφ). M1-Mφ possess pro-inflammatory and microbicidal functions; however, M2-Mφ are known to inhibit inflammation and promote tissue remodeling and angiogenesis.6,11 Recent studies suggest that increased numbers of TAMs in classical Hodgkin lymphoma correlate with resistance to chemotherapy and poor survival.12,13 However, similar explorations in the tumorigenesis of MCL were stalled due to the lack of tractable experimental models. This roadblock was recently alleviated after the development of a murine MCL cell line, FC-muMCL1,14 and its applications for studying MCL in mice.15 In the current study, we exploited these advances to investigate the molecular and cellular mechanisms that determine the polarity of TAMs in MCL tumors fully established in syngeneic immunocompetent mice.
Methods
Mice
All mouse experiments were conducted following the protocols approved by the Institutional Animal Care and Use Committees of The George Washington University. Each experiment was performed by using a minimum of 6 mice per group, and tumor volume was calculated from caliper measurements by the equation 1/2(L × W2). Mice were killed, and tumors were immediately processed after recording the tumor weight. Using a razor blade, tumors were cut into small pieces followed by mincing. Tumor lysates were transferred into a 15 mL tube; the volume was adjusted to 5 mL of sterile phosphate-buffered saline (PBS) and mixed using vortex. Once the cell suspension looked smooth, cells were filtered by using a 100 µM cell strainer followed by centrifugation.
In vivo human MCL xenograft.
Six- to eight-week-old nonobese diabetic/severe combined immunodeficient mice (NOD/SCID) (The Jackson Laboratory, Bar Harbor, ME) were inoculated subcutaneously by injecting the human mantle cell line Mino (5 × 10⁶) into the dorsal flank of each mouse. Tumors were monitored up to 21 days or ended when tumors reached 2000 mm3 to 2500 mm3.
In vivo tumor studies in syngeneic MCL model.
Six- to eight-week-old immunocompetent male C57BL/6J mice (The Jackson Laboratory) were inoculated subcutaneously by injecting FC-muMCL1 (murine mantle cell lymphoma cell line) suspended in 100 µL ice-cold PBS (5.0 × 10⁶/mouse) into the dorsal flank of each mouse, and tumors were monitored up to 21 days or ended when tumor reached 2000 mm3 to 2500 mm3.
In vivo macrophage depletion.
The NOD/SCID mice injected with Mino + CD14 monocytes as described earlier were divided into 2 groups. For macrophage depletion, Clodrosome or Encapsome was used from the standard macrophage depletion kit (Encapsula NanoSciences, Brentwood, TN) as suggested. When tumors became palpable, subcutaneous injection of 200 µL (5 mg/mL) of Clodrosome (clodronate-encapsulated liposomes), or vehicle Encapsome (PBS liposomes), was administered twice per week for the first week, then once per week for 2 weeks as described.16
Antibodies and reagents
Antibodies against phosphorylated (p)-STAT1, p-STAT3, STAT1, STAT3, p-ERK, and p-p65 were purchased from Cell Signaling Technologies (Danvers, MA). STAT1 and STAT3 inhibitors, fludarabine and stattic, respectively, were purchased from Selleckchem (Houston, TX). All these compounds were dissolved in dimethyl sulfoxide and stored at −20°C. Human recombinant cytokine macrophage colony-stimulating factor (M-CSF), interleukin-4 (IL-4), IL-10, and interferon-γ (IFN-γ) were purchased from PeproTech (Rocky Hill, NJ). Neutralizing antibodies to IL-10 and IL-4 were purchased from R&D Systems (Minneapolis, MN).
Primary monocytes/monocytic cell line and in vitro monocytic differentiation
Monocytes were sorted from buffy coat from healthy donors (New York Blood Center). Briefly, the buffy coat was diluted with PBS (1:5) and separated on Ficoll/SM to obtain peripheral blood mononuclear cells (PBMCs). Monocytes were purified from PBMCs by magnetic cell sorting using the EasySep human buffy coat CD14+ selection kit (Stemcell Technologies, Seattle, WA) according to the manufacturer’s protocol. Purity of the isolated monocyte cell population and B cells was verified as >90% by flow cytometric analysis of CD14 or CD19 expression.
Human THP-1 monocytic cell line was obtained from ATCC (Manassas, VA). Murine macrophage cell line RAW264.7 was a kind gift from E. Sotomayor, George Washington University. To trigger differentiation from monocytes (Mo) to macrophages (Mφ), CD14+ monocytes derived from PBMCs or THP-1 monocytic cell line were seeded in 6-well plates in 2 mL complete media at 1 million cells/well. For THP-1/Mo differentiation, 50 ng/mL phorbol 12-myristate 13-acetate (MilliporeSigma, Burlington, MA) was added to media and incubated for 24 hours and phorbol myristate acetate removed for another 24 hours to derive adherent Mφ. For CD14+-Mo differentiation, recombinant-MCSF (50 ng/mL) was added to media for 5 to 7 days, and medium was supplemented every 2 to 3 days.
MCL cell line and coculture conditions
Human MCL cell lines (Mino, Granta, JVM2, and Jeko-1) were obtained from ATCC. The murine MCL cell line FC-muMCL1 has been previously described.14 All the cell lines were cultured in RPMI 1640 with 10% fetal bovine serum, 1 mM l-glutamine, and 100 U/mL penicillin/streptomycin at 37°C in a humidified incubator containing 5% carbon dioxide. All the cell lines were authenticated by STR profiling performed at ATCC and Genetica (Burlington, NC). Normal B cells were purified from human PBMCs by using the EasySep Human CD19 Positive Selection kit II (Stemcell Technologies) according to the manufacturer’s protocol. Murine B cells were acquired by manually chopping the mouse spleen.
Some experiments were conducted by establishing cocultures of macrophages (Mφ) and MCL cell lines. To do this, 1 × 10⁶ MCL cells were added to the plates that contained CD14 or THP-1 Mφ and incubated for 48 hours directly or in the presence of 5 μm transwell. Subsequently, the MCL cells were removed by pipetting, and plates were washed with PBS at least 3 times. For some experiments, CD14 or THP-1-Mφ were treated with the media alone or conditioned media (CM) collected from MCL cell lines grown in serum-free medium (AIM V Medium; Invitrogen, Carlsbad, CA).
Cell proliferation
Cell proliferation was performed by MTT (3-(4,5-dimethylthiazolyl-2)-2,5-diphenyltetrazolium bromide) assay. Briefly, 2 × 10⁴ cells were seeded in triplicate 96-well plates in 100 μL complete media. After the indicated treatment, 10 μL MTT (MilliporeSigma) solution was added into each well, and the plates were incubated for 4 hours at 37°C. Isopropanol containing 0.04 hydrochloric acid was then added in each well (200 μL/well), and the absorbance was measured at 570 nm by using a spectrophotometer.
Flow cytometry
All flow cytometry sets were analyzed with LIVE/DEAD Fixable Aqua Dead Cell Stain Kit or Sytox Red stain (Thermo Fisher Scientific, Waltham, MA), and matched isotype antibodies were used as controls. Antibodies for flow cytometry are listed in supplemental Table 1A.
Surface expression.
The first set of flow cytometry was performed to assess surface markers using antibody against CD14, CD80, CD163, or isotype control. Cells were harvested and washed with fluorescence-activated cell sorting (FACS) buffer (PBS containing 2% fetal bovine serum and 0.05% sodium azide) and stained with antibodies for 30 minutes at room temperature. The cells were washed twice and stained with Sytox Red and then resuspended in FACS buffer for flow cytometric analysis using BD FACS Celesta by BD Biosciences.
Multicolor staining.
The second panel of flow cytometry was performed as cell surface multicolor staining to analyze infiltrating myeloid/macrophage cells by using the tumor cells from the MCL xenograft or syngeneic mouse model. Cells were stained with multicolor flow antibodies (CD45, CD11b, and F4/80 or CD45, CD11b, F4/80, CD80, and CD163) for at least 30 minutes at room temperature in the dark. Negative gating was based on a fluorescence minus one (FMO) strategy. For FMO control, cells were stained with PE-FMO, FITC-FMO, APC750-FMO, BV421-FMO, and BV786-FMO. The cells were washed twice and stained with Sytox Red and then resuspended in FACS buffer for flow cytometric analysis using BD Celesta.
Intracellular staining for CD68.
The third panel of flow cytometry was performed as intracellular staining for CD68. Cells were fixed and permeabilized in 100 µL fixation/permeabilization (BD Fixation/Permeabilization Kit) for 20 minutes at 4°C. Cells were washed twice with 1XBD Perm/Wash buffer (BD Biosciences, Franklin Lakes, NJ) and then stained with CD68 antibody in 50 µL BD Perm/Wash buffer and incubated at room temperature in the dark for 30 to 60 minutes. Cells were then washed with Perm/Wash buffer and resuspended in FACS buffer for flow cytometric analysis using the BD Celesta.
Immunofluorescence and immunohistochemistry
Mouse tumor tissues were fixed in 4% formalin for 12 hours, then embedded in paraffin wax; 5 μm sections were stained with hematoxylin and eosin. Immunofluorescence and immunohistochemistry staining of paraffin-embedded sections was conducted by using standard protocols. Briefly, slides were deparaffinized in citrus clearing solvent and rehydrated through a graded ethanol series. Sections were incubated in 1X PBS containing 0.1% Triton X-100 for 10 minutes. Antigen retrieval was performed by boiling slides in pH 6.0 citrate buffer or pH 9.0 Tris-based antigen unmasking solution (Vector Laboratories, Burlingame, CA) in the microwave for 10 minutes. After blocking in 10% goat serum for 1 hour at room temperature, slides were incubated with primary antibodies in 5% to 10% goat serum overnight at 4°C.
For immunofluorescence staining, slides were incubated with Alexa Fluoro secondary antibodies (1:500; Invitrogen) in 5% goat serum for 1 hour at room temperature. Nuclei were stained with 4′,6-diamidino-2-phenylindole. For immunohistochemistry staining, slides were incubated in 3% hydrogen peroxide for 20 minutes to block endogenous peroxidase activity before antigen retrieval. Vectastain ABC Elite and NovaRED Substrate kits (Vector Laboratories) were used for signal detection. Nuclei were counterstained with hematoxylin. Immunostaining was imaged on a DMi8 microscope (Leica Microsystems, Buffalo Grove, IL). Primary antibodies are listed in supplemental Table 1B and supplemental Table 1C. Anti-F480 was used at 1:250 dilution; anti-CD68, anti-CD206, and anti-CD80 antibodies were used at 1:200 dilution.
Quantitative reverse transcription polymerase chain reaction
Quantitative reverse transcription polymerase chain reaction (qRT-PCR) was performed as previously described.17 Briefly, 2 × 10⁶ cells were collected. Total RNA was isolated by using with E.Z.N.A. Total RNA Kit (Omega Bio-Tek, Norcross, GA), and complementary DNA was synthesized by using an iScript cDNA Synthesis Kit (Bio-Rad, Hercules, CA). Quantitative PCR was performed on a CFX96 real-time PCR detection system (Bio-Rad) using various primers as shown in Table 1.
Primers for qRT-PCR
| qRT-PCR primer | Forward | Reverse |
|---|---|---|
| IL-10 | GACTTTAAGGGTTACCTGGGTTG | TCACATGCGCCTTGATGTCTG |
| IL-12 | TGCCCATTGAGGTCATGGTG | CTTGGGTGGGTCAGGTTTGA |
| TNF-α | CATGATCCGGGACGTGGAGC | CTGATTAGAGAGAGGTCCCTG |
| IL-6 | CCTCTCTGCAAGAGACTTCCATCCA | CTTGTGAAGTAGGGAAGGCCGTGG |
| GAPDH | ATCACCATCTTCCAGGAGCG | CAAATGAGCCCCAGCCTTC |
GAPDH, glyceraldehyde-3-phosphate dehydrogenase.
Enzyme-linked immunosorbent assays
THP-1-Mφ or CD14-Mφ were cocultured with MCL cell lines for 48 hours. The coculture supernatant was then collected, and IL-10 secretion was detected by using a human IL-10 instant enzyme-linked immunosorbent assay kit (Invitrogen) as per instructions. Absorbance was measured at 450 nm by using a spectrophotometer (Bio-Rad).
Western blotting
Cells were harvested and then lysed with RIPA buffer protease inhibitor and phosphatase inhibitor cocktail. Protein concentration was determined by using the BCA protein assay (Pierce Chemical Co., Dallas, TX). Equal amounts of whole cell lysates were separated on sodium dodecyl sulfate polyacrylamide gel electrophoresis and transferred onto nitrocellulose membranes. Membranes were then incubated in blocking solution (5% non-fat milk in PBS, 0.1% Tween 20), followed by incubation with the indicated antibodies at 4°C overnight. The membranes were washed in PBS with Tween 20 and incubated with horseradish peroxidase–conjugated secondary antibodies for 2 hours at room temperature. Antibody detection was performed with an enhanced chemiluminescence reaction.
Lentiviral transfection
To abrogate the expression of STAT1 or STAT3 in Mino and Granta cells, human short hairpin RNA (shRNA) for STAT1 or STAT3 (MilliporeSigma) was packed into lentiviral particles and transfected into Mino and Granta cells along with a scramble control. Briefly, recombinant lentiviruses were packaged by cotransfecting shRNA plasmids with packaging constructs according to the manufacturer’s instruction. Mino and Granta cells were incubated with lentivirus mixed with 8 μg/mL polybrene. Stable expressions of shSTAT1 and shSTAT3 were established by puromycin (1 mg/mL) selection.
Statistical analysis
Statistical analysis was performed by using one-way analysis of variance or Student’s t test with GraphPad Prism 7.0 software (GraphPad Software, La Jolla, CA). Data are presented as mean ± standard deviation, and P < .05 was considered statistically significant.
Results
Detection of macrophage infiltration in the MCL xenograft-mice model
Infiltration of myeloid cells such as TAMs is considered a biomarker in several solid cancers, including those resulting from hematologic malignancies.18-22 However, there are no experimental data that show the relationship between macrophages and tumor development in an aggressive B-cell lymphoma such as MCL. Immunocompromised mice lack B, T, and natural killer cells but possess innate immune populations23 ; we have therefore chosen to first characterize TAMs in an immunocompromised mouse model containing MCL tumors. To do this, the human MCL cell line Mino was subcutaneously xenografted into NOD/SCID mice. In most cases, the tumors appeared within 10 days after inoculation and reached up to 2500 mm3 in size, at which time the mice were killed (Figure 1A).
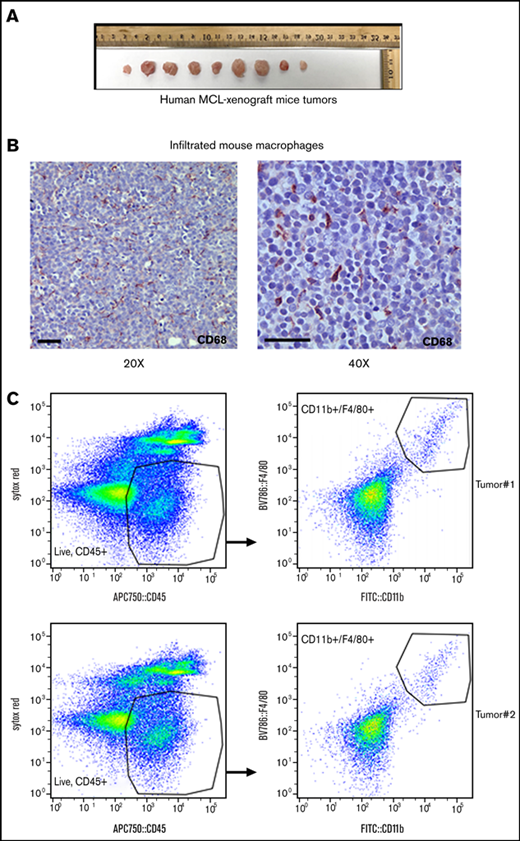
Macrophage infiltration into the MCL xenograft mouse model. (A) NOD/SCID mice were subcutaneously injected with 5 × 10⁶ human MCL cell line Mino, and tumor size is shown after monitoring for 21 days. n = 9 tumors. (B) Macrophage infiltration in the MCL xenograft tumor was assessed by staining tumor sections with anti-CD68, and immunohistochemistry was performed. (C) Infiltrating mouse macrophages (F4/80+/CD11b+) into MCL xenograft tumors were shown by flow analysis as indicated.
Macrophage infiltration into the MCL xenograft mouse model. (A) NOD/SCID mice were subcutaneously injected with 5 × 10⁶ human MCL cell line Mino, and tumor size is shown after monitoring for 21 days. n = 9 tumors. (B) Macrophage infiltration in the MCL xenograft tumor was assessed by staining tumor sections with anti-CD68, and immunohistochemistry was performed. (C) Infiltrating mouse macrophages (F4/80+/CD11b+) into MCL xenograft tumors were shown by flow analysis as indicated.
We then identified significant infiltration of mouse macrophages in the endpoint tumor nodules by immunohistochemistry using mouse CD68 antibody (Figure 1B). For phenotypic analysis of macrophage lineage cells, mouse tumors were stained with a multicolor flow antibodies mixture (CD45, CD11b, and F4/80) using appropriate controls as described in the Methods section. Flow cytometric analysis identified CD11b+/F4/80+-Mφ (2.5%) in the MCL xenografts (Figure 1C), suggesting their mobilization into the tumors established in immunocompromised mice.
Identification of TAMs in the syngeneic MCL mouse model
Next, we characterized the presence of TAMs in an experimental syngeneic mouse model of MCL initiated by grafting the murine MCL cell line FC-muMCL1 into immunocompetent C57/BL6 mice. The FC-muMCL1 MCL cell line used in these experiments was previously established from older cyclin D1 transgenic C57/BL6 mice harboring pristane-induced lymphoma.14 The tumor growth was then observed over time, and tumors were extracted for further analyses when they reached 2500 mm3 (Figure 2A-B). We identified significant numbers of infiltrated F4/80+-Mφ in the endpoint MCL tumor nodules by immunofluorescence (Figure 2C). Sections without antibodies were used to distinguish staining from autofluorescence. In the absence of F4/80 antibody, we did not detect staining in FC-muCL1 tumors (supplemental Figure 1A). Macrophages in general can be polarized to M1-Mφ or M2-Mφ. M1-Mφ produce pro-inflammatory response; in contrast, M2-Mφ play a role in tumor growth. TAMs found in the tumor microenvironment have previously been shown to express both M1 and M2 polarization hallmarks.24 We therefore sought the phenotypic characteristics of macrophages found in syngeneic MCL tumors. Immunohistochemical analysis identified both CD80+ M1-Mφ and CD206+ M2-Mφ within the murine MCL tumors, suggesting that TAMs are polarized within the MCL tumors and occur as a mixture of both M1 and M2 populations (Figure 2D).
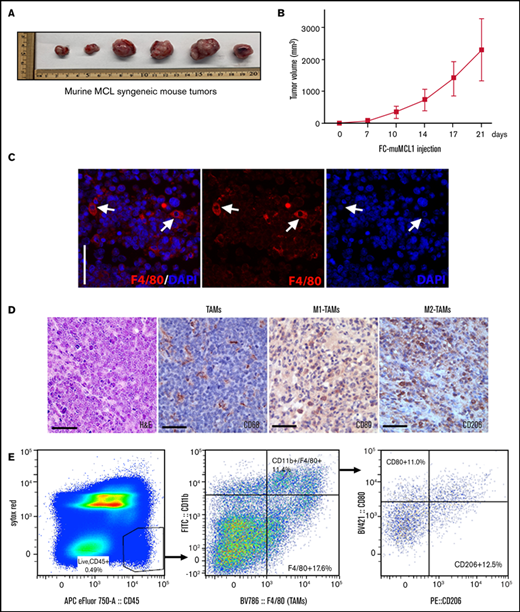
Characterization of TAMs into murine MCL syngeneic mouse model. Immunocompetent C57BL/6 mice were subcutaneously injected with 5 × 10⁶ FC-muMCL1 murine MCL cell line, and images of syngeneic MCL tumors after 21 days (A) and tumor growth curves (B) of the FC-muMCL1 syngeneic tumors are shown (data are presented as mean ± standard deviation; n = 6 mice/group). (C) Immunofluorescent staining was performed on the MCL mouse syngeneic tumors using F4/80 (red) antibody. Nuclei were stained with 4′,6-diamidino-2-phenylindole (DAPI) (blue). (D) Immunohistochemistry was performed on the MCL mouse syngeneic tumors by using specific antibodies against CD68, CD80, and CD206. (E) Dot plots of macrophage populations (CD11b+/F4/80+ and CD80/CD206) with in the MCL mouse syngeneic tumors shown by flow analysis. All staining was performed on at least 2 to 3 mouse tumors, and a representative image is shown. H&E, hematoxylin and eosin.
Characterization of TAMs into murine MCL syngeneic mouse model. Immunocompetent C57BL/6 mice were subcutaneously injected with 5 × 10⁶ FC-muMCL1 murine MCL cell line, and images of syngeneic MCL tumors after 21 days (A) and tumor growth curves (B) of the FC-muMCL1 syngeneic tumors are shown (data are presented as mean ± standard deviation; n = 6 mice/group). (C) Immunofluorescent staining was performed on the MCL mouse syngeneic tumors using F4/80 (red) antibody. Nuclei were stained with 4′,6-diamidino-2-phenylindole (DAPI) (blue). (D) Immunohistochemistry was performed on the MCL mouse syngeneic tumors by using specific antibodies against CD68, CD80, and CD206. (E) Dot plots of macrophage populations (CD11b+/F4/80+ and CD80/CD206) with in the MCL mouse syngeneic tumors shown by flow analysis. All staining was performed on at least 2 to 3 mouse tumors, and a representative image is shown. H&E, hematoxylin and eosin.
To monitor the dynamics of TAMs infiltrating into the syngeneic MCL tumors, the M1-Mφ subsets were enumerated by flow cytometry. For phenotypic analysis of infiltrated macrophages, mouse tumor cells were stained with a mixture of multicolor flow antibodies (CD45, CD11b, F4/80, CD80, and CD206) using appropriate controls as described in the Methods section. Nearly 11.0% of Mφ were observed as double-positive for CD80 and F4/80 markers (M1-Mφ) within the CD45 gate, whereas 12.5% of cells were found to exhibit CD206+ and F4/80 characteristics (M2-Mφ) (Figure 2E). Overall, these results confirm the presence of polarized M1 and M2 TAMs in the MCL tumors in vivo.
Interaction between macrophages and MCL cells on macrophage polarization
Given the notion that the M2-Mφ are often associated with tumor growth and progression, we next studied whether the lymphoma cells could directly trigger M2-Mφ polarization in a coculture setting. We used 2 distinct Mφ cultures, human CD14+ monocyte-derived Mφ (CD14+-Mφ) and those that were differentiated from the THP-1 cell line (THP-1-Mφ). Clear morphologic changes were seen in the THP-1 monocytes vs THP-1-Mφ, where the round shape monocytes were differentiated to the adherent spindle-shaped Mφ (supplemental Figure 1B). Both CD14 and CD68 surface markers were much higher in the THP-1–differentiated Mφ as assessed by flow cytometry (supplemental Figure 1C-D).
Before coculturing, we confirmed that the differentiated Mφ or MCL cells were 99% pure as determined by flow cytometry using CD68 and CD19 surface markers (supplemental Figure 1E-F). Thus, fully differentiated CD14+-Mφ were cocultured with the human MCL cell lines Jeko-1 or Mino, and flow cytometry was performed to assess the M1 and M2 surface markers. IL-4 (M2)-differentiated and IFN-γ (M1)-differentiated Mφ were included as positive controls for comparison. We observed upregulation of the M2 surface marker CD163, but not M1 marker CD80, in the CD14-Mφ following their coculturing with MCL cells (either Jeko or Mino) compared with macrophage alone (Figure 3A-B). Interestingly, the extent of MCL-induced upregulation of M2 surface marker was much higher than that induced by IL-4, which served as a positive control. Similar results were noted in the THP-1-Mφ cocultured with Mino cells (Figure 3C-D). We next tested whether soluble factors secreted by MCL cells indirectly drive polarization of macrophages toward the M2 phenotype. CD14+-Mφ were incubated with CM collected from cultures of Jeko-1 and Mino MCL cell lines, and M2 polarization status was assessed by using flow cytometry. Levels of M2 marker CD163, but not M1 marker CD80, were found to be increased in the MCL CM-differentiated Mφ compared with Mφ alone. To explore the relative contribution of soluble factors such as IL-10 or IL-4 in increased CD163 expression on Mφ by MCL cells, we used IL-10 or IL-4 antibody in coculture of THP-1-Mφ with Mino using transwell inserts. Interestingly, 72 hours of treatment with IL-10 (but not IL-4) neutralizing antibody significantly reduced the coculture-induced expression of CD163 (Figure 3E). Overall, these data indicate that MCL cells are able to differentiate Mφ macrophages toward a M2-like macrophage phenotype, probably by IL-10 generation.
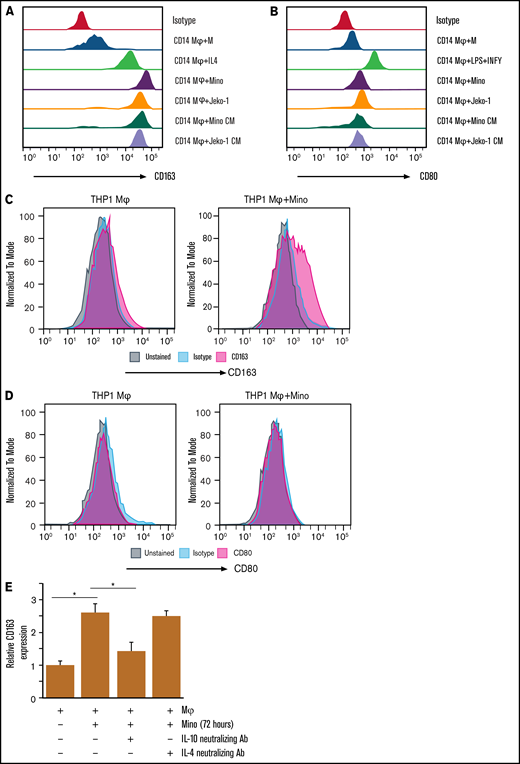
MCL cell interaction with macrophages induces M2 phenotype in coculture system. The surface expression of CD163 (A) and CD80 (B) in CD14-Mφ was measured by flow cytometry after treatment with cytokines (IL-4 or lipopolysaccharide (LPS) plus IFN-γ) or CM collected from Mino or Jeko cells or coculturing with Mino or Jeko. The surface expression of CD163 (C) or CD80 (D) in THP-1-Mφ was measured by flow cytometry after coculturing with Mino cells. (E) CD163 expression was measured in the Mino cell lines after coculturing with THP-1-Mφ with or without IL-10 or IL-4 neutralizing antibodies. Experiments were repeated 3 times, and a representative experiment is shown. *P < .05. Ab, antibody.
MCL cell interaction with macrophages induces M2 phenotype in coculture system. The surface expression of CD163 (A) and CD80 (B) in CD14-Mφ was measured by flow cytometry after treatment with cytokines (IL-4 or lipopolysaccharide (LPS) plus IFN-γ) or CM collected from Mino or Jeko cells or coculturing with Mino or Jeko. The surface expression of CD163 (C) or CD80 (D) in THP-1-Mφ was measured by flow cytometry after coculturing with Mino cells. (E) CD163 expression was measured in the Mino cell lines after coculturing with THP-1-Mφ with or without IL-10 or IL-4 neutralizing antibodies. Experiments were repeated 3 times, and a representative experiment is shown. *P < .05. Ab, antibody.
Assessment of cytokine expression during interaction between MCL and macrophages
To further verify the extent of MCL-mediated macrophage polarization, we assessed the expression of M2-derived cytokines (IL-10) and M1-derived cytokines (IL-12 and tumor necrosis factor-α [TNF-α]) in cocultures containing CD14+-Mφ or THP-1-Mφ and MCL cells (Jeko-1 or Mino). IL-4 (M2) and IFN-γ (M1) differentiated CD14+-Mφ or THP-1-Mφ were included for comparison. qRT-PCR was then performed to assess the expression of IL-10 in the cocultured macrophages with MCL cells. As expected, IL-4–treated human or murine Mφ contained increased levels of IL-10 messenger RNA (mRNA) (approximately twofold) compared with the untreated Mφ. Interestingly, a significant increase in IL-10 mRNA was observed in the CD14-Mφ or THP-1-Mφ directly cocultured with the human MCL cell lines (Jeko, Mino, and Granta) or the murine MCL cell line (Fc-muMCL1) compared with Mφ alone or IL-4–treated Mφ (Figure 4A-B; supplemental Figure 2A). When CD14+-Mφ or THP-1-Mφ were treated with MCL CM collected from Mino, Jeko, or Granta cells, we observed elevated levels of IL-10 mRNA but not IL-6 mRNA compared with their untreated Mφ counterparts (Figure 4A-B; supplemental Figure 2B-D). Similar assays were performed to assess the expression of M1 cytokines (IL-12 and TNF-α) in the Mφ-MCL cocultures. Compared with the significant stimulatory effect of lipopolysaccharide plus IFN-γ on Mφ, the exposure of Mφ to MCL CM or MCL cell lines (Mino, Jeko, and Granta) produced least minimal changes in the transcript levels of IL-12 and TNF-α (Figure 4C-F). In contrast, when macrophages derived from CD14+ (human) or Raw 264.7 (murine) differentiated in the presence of normal CD19+ B cells derived from human PBMCs or mice spleen, there was no increase in the M2 cytokine IL-10; IL-12 expression was increased, however. These findings suggest that when normal B cells come into contact with Mφ, they favor M1 phenotype differentiation (supplemental Figure 2E-F).
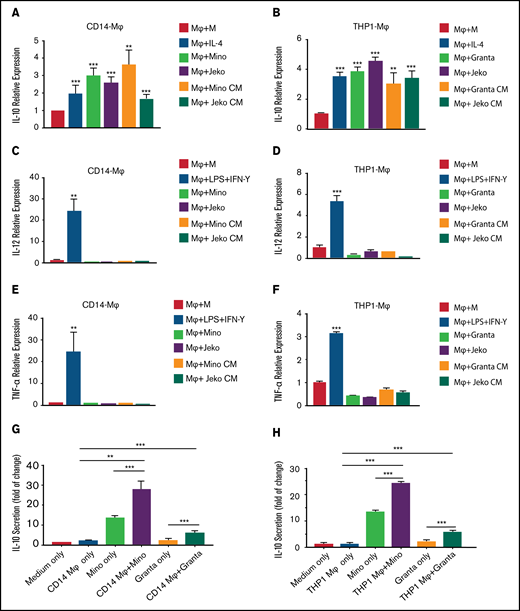
MCL cells modulate cytokine expression in the macrophages. The mRNA expression of IL-10 in CD14-Mφ (A) or THP-1-Mφ (B) was measured by qRT-PCR after direct coculturing with Mino, Granta, or Jeko or treatment with MCL CM or cytokine stimulation. IL-12 (C-D) and TNF-α (E-F) expression was measured in CD14+-Mφ or THP-1-Mφ after direct coculturing with Mino, Granta, or Jeko cells or treatment with MCL CM or cytokine stimulation. IL-10 secretion was measured by enzyme-linked immunosorbent assay in the supernatant of cocultured media from CD14-Mφ (G) or THP-1-Mφ (H) with Mino and Granta cells. Data are presented as mean ± standard deviation from 3 separate experiments. **P < .01, ***P < .001.
MCL cells modulate cytokine expression in the macrophages. The mRNA expression of IL-10 in CD14-Mφ (A) or THP-1-Mφ (B) was measured by qRT-PCR after direct coculturing with Mino, Granta, or Jeko or treatment with MCL CM or cytokine stimulation. IL-12 (C-D) and TNF-α (E-F) expression was measured in CD14+-Mφ or THP-1-Mφ after direct coculturing with Mino, Granta, or Jeko cells or treatment with MCL CM or cytokine stimulation. IL-10 secretion was measured by enzyme-linked immunosorbent assay in the supernatant of cocultured media from CD14-Mφ (G) or THP-1-Mφ (H) with Mino and Granta cells. Data are presented as mean ± standard deviation from 3 separate experiments. **P < .01, ***P < .001.
Furthermore, IL-10 protein levels were measured by using enzyme-linked immunosorbent assay in the supernatant of Mφ-MCL cocultures. As shown in Figure 4G-H, IL-10 levels were significantly higher in the supernatant of cocultures compared with singular cultures of Mφ or MCL cells. Taken together, these results indicate that MCL cells trigger skewing of Mφ toward the M2 phenotype. Overall, these data suggest that macrophages differentiated in the presence of MCL tumor cells, but not normal B cells, yielded an M2 macrophage cytokine profile and differentiation.
Role of monocyte/macrophages in vitro and in vivo growth of MCL tumors
We next sought to determine the role of M1-Mφ vs M2-Mφ in MCL growth. As a proof of concept, we showed by flow cytometry that CD14+ or THP-1–differentiated Mφ could be polarized to M1-Mφ (CD80) or M2-Mφ (CD163) using lipopolysaccharide plus IFN-γ and IL-4 treatment, respectively (supplemental Figure 3A-B). Moreover, ex vivo polarized M2-Mφ of CD14+ or THP-1 origin produced increased expression of IL-10 mRNA, whereas reduced expression of IL-12 and TNF-α mRNA was evident (supplemental Figure 3C-D). We then cocultured the MCL cell lines (Granta, Jeko, and Mino) directly with CD14+ or THP-1–differentiated Mφ and assessed the MCL proliferation by MTT assay as described in the Methods section. CD14 or THP-1-derived M2-Mφ, but not M1-Mφ, significantly (P < .001) promoted growth of Granta, Jeko, and Mino cells (Figure 5A; supplemental Figure 4A). When MCL cells (Granta or Mino) were cocultured with CD14+ or THP-1 M1 or M2-Mφ in a setting in which cells were separated by transwell insert, M2-Mφ were still able to increase the MCL growth (Figure 5B; supplemental Figure 4B), suggesting that the cell-to-cell contact is dispensable. Overall, these results show that M2-Mφ are able to promote MCL growth in vitro, at least in part via release of soluble factors. To determine the effect of infiltrated monocytes/macrophages in vivo on the MCL tumor progression, NOD/SCID mice were injected with either the MCL cell line Mino alone or together with equal number of human CD14+ monocytes. Mice injected with Mino + monocytes exhibited an early sign of palpable tumors and showed a significant (P < .001) increase in tumor growth compared with cells injected alone (Figure 5C-D). The body weight of both groups of mice was comparable (Figure 5E).
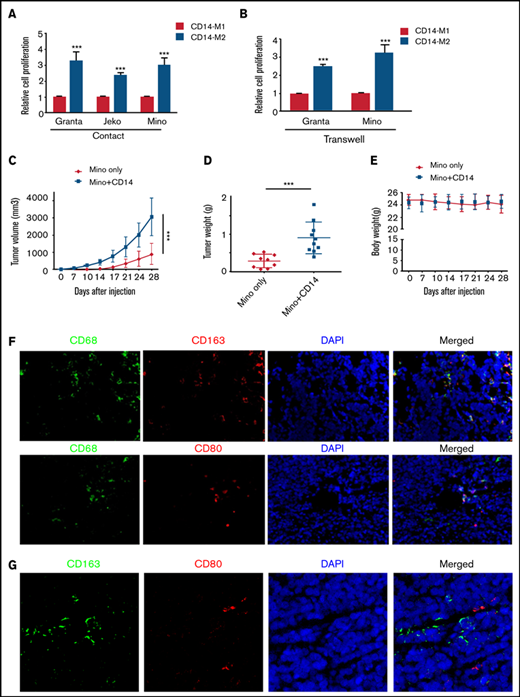
Macrophages/monocytes increased the MCL growth in vitro and in vivo. MCL cell proliferation was measured by MTT assay after direct (A) or indirect (B) coculture using transwell inserts with CD14+ polarized M1-Mφ or M2-Mφ. Mino alone (5 × 10⁶) or Mino + CD14+monocytes (5 × 10⁶, 1:1) were implanted subcutaneously into the flank of male NOD/SCID mice, and tumor size (C), tumor weight (D), and body weight (E) were measured (n = 9 mice). (F) Immunofluorescent staining was performed on the MCL + CD14+ xenograft tumors using CD68 (green) and CD163/CD80 (red) antibodies. Nuclei were stained with 4′,6-diamidino-2-phenylindole (DAPI) (blue). (G) Immunofluorescent staining was performed on the MCL + CD14+xenograft tumors using CD163 (green) and CD80 (red) antibodies. Nuclei were stained with DAPI (blue). Experiments were performed on 3 tumors, and a representative experiment is shown. ***P < .001.
Macrophages/monocytes increased the MCL growth in vitro and in vivo. MCL cell proliferation was measured by MTT assay after direct (A) or indirect (B) coculture using transwell inserts with CD14+ polarized M1-Mφ or M2-Mφ. Mino alone (5 × 10⁶) or Mino + CD14+monocytes (5 × 10⁶, 1:1) were implanted subcutaneously into the flank of male NOD/SCID mice, and tumor size (C), tumor weight (D), and body weight (E) were measured (n = 9 mice). (F) Immunofluorescent staining was performed on the MCL + CD14+ xenograft tumors using CD68 (green) and CD163/CD80 (red) antibodies. Nuclei were stained with 4′,6-diamidino-2-phenylindole (DAPI) (blue). (G) Immunofluorescent staining was performed on the MCL + CD14+xenograft tumors using CD163 (green) and CD80 (red) antibodies. Nuclei were stained with DAPI (blue). Experiments were performed on 3 tumors, and a representative experiment is shown. ***P < .001.
Histologic staining showed much denser cellular infiltrate in the Mino + CD14+ monocyte group compared with Mino alone (supplemental Figure 4C). Using immunofluorescence, we identified an increased presence of CD68+ macrophages in mouse tumors bearing Mino + CD14+ cells. Further characterization of CD68+ macrophages reveal the presence of both M2 (CD163+) and M1 (CD80+) TAMs into the mouse tumor bearing Mino + CD14+cells, although the CD163+ TAMs were higher than CD80+ (Figure 5F-G; supplemental Figure 4D).Overall, these data suggest that dynamic interaction between MCL cells and the infiltrated monocyte/macrophages dictate macrophage polarization to both M1 and M2 phenotype; however, M2 but not M1 macrophages favor the MCL cell growth in vitro and tumorigenesis in vivo.
Regulation of STAT1 activity in the MCL cells after cross-talk with macrophages
To determine what downstream signals in the tumor cells respond to IL-10 secreted by M2-TAMs, we exposed tumor cells to CM derived from THP-1 or CD14+ derived Mφ, and western blotting of STAT1/3 was performed in Granta and Jeko cells. In either condition, a marked increase in the phosphorylation of STAT1 and STAT3 was observed in both Granta and Jeko cells (supplemental Figure 5A-D). To explore the direct role of IL-10 in increased STAT1 and STAT3 activation in tumor cells, we used IL-10 neutralizing antibody in coculture of THP-1-Mφ with lymphoma cells (Granta and Mino) using direct and indirect coculture with transwell inserts, and assessed STAT, ERK, and NF-kB (p65) signaling. Interestingly, treatment with IL-10 neutralizing antibody abolished the coculture-induced activation of STAT1 but not STAT3, p65, and ERK. This effect of IL-10 neutralization on STATs was observed only when cocultured with transwell inserts, apparently due to an as-yet unknown soluble factor (Figure 6A-B), Our data reveal a role for IL-10 in mediating STAT1 activation in MCL cells and indicate a distinction between signaling mechanisms triggered by direct or indirect interaction of these cells.
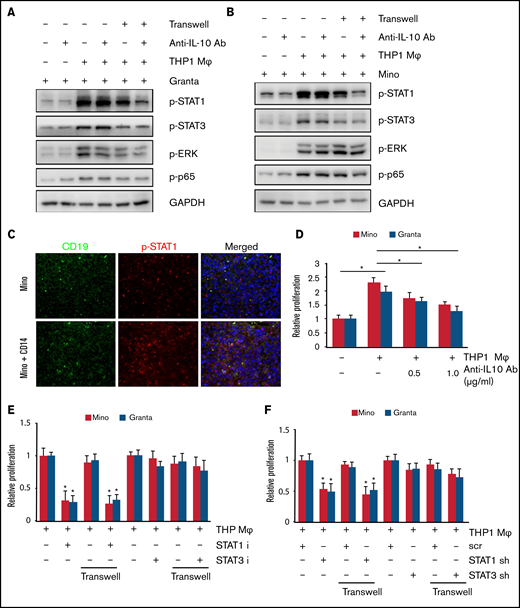
M2 macrophage increased MCL growth via STAT1 signaling. STAT1, STAT3, ERK, and p65 phosphorylation in Granta (A) and Mino (B) cells was measured after direct or indirect coculturing with THP-1-Mφ with or without IL-10 neutralizing antibody. (C) Immunofluorescence staining showing CD19 and p-STAT1 staining in the Mino or Mino + CD14 inoculated MCL xenograft tumors (n = 3). (D) Cell proliferation in Mino and Granta was measured by MTT assay after coculturing with THP-1-Mφ with or without IL-10 neutralizing antibody. Cell proliferation in Mino and Granta was measured by MTT assay after direct or indirect coculturing with THP-1-Mφ with or without STAT1 and STAT3 inhibitor (E) or STAT1 and STAT3 shRNA (F). Data are presented as mean ± standard deviation from 3 separate experiments. *P < .05. GAPDH, glyceraldehyde-3-phosphate dehydrogenase.
M2 macrophage increased MCL growth via STAT1 signaling. STAT1, STAT3, ERK, and p65 phosphorylation in Granta (A) and Mino (B) cells was measured after direct or indirect coculturing with THP-1-Mφ with or without IL-10 neutralizing antibody. (C) Immunofluorescence staining showing CD19 and p-STAT1 staining in the Mino or Mino + CD14 inoculated MCL xenograft tumors (n = 3). (D) Cell proliferation in Mino and Granta was measured by MTT assay after coculturing with THP-1-Mφ with or without IL-10 neutralizing antibody. Cell proliferation in Mino and Granta was measured by MTT assay after direct or indirect coculturing with THP-1-Mφ with or without STAT1 and STAT3 inhibitor (E) or STAT1 and STAT3 shRNA (F). Data are presented as mean ± standard deviation from 3 separate experiments. *P < .05. GAPDH, glyceraldehyde-3-phosphate dehydrogenase.
We next sought confirmation of the in vitro finding of STAT1 activation by tumor cells when cocultured with macrophages. Phosphorylation of STAT1 in vivo in the MCL xenograft tumors was thus investigated. Immunofluorescence staining was performed for the presence of phosphorylated STAT1 and CD19 on the MCL alone vs MCL alone + CD14 xenograft tumors. Interestingly, STAT1 phosphorylation was increased in the Mino + CD14 xenograft tumor compared with MCL alone tumors, suggesting that STAT1 activation is the result of an interaction between MCL cells and monocyte/macrophage (Figure 6C). Next, we sought to determine the role of IL-10 neutralizing antibody on the M2-induced MCL proliferation. Coculture of THP-1-Mφ increased the proliferation of Mino and Granta cells, which was partially inhibited in the presence of anti–IL-10 antibody (Figure 6D). To determine the effect of STAT1 inhibition on MCL growth, the STAT1 inhibitor fludarabine, the STAT3 inhibitor stattic, or the STAT1 shRNA and STAT3 shRNA were used in the THP-1-Mφ and Mino and Granta cocultures (with transwell) and growth assessed by MTT assay. Specificity of STAT inhibitors and STAT shRNA was assessed by examining STAT1 or STAT3 phosphorylation (supplemental Figure 6A-D). Mino and Granta cell proliferation after coculture was dramatically inhibited by STAT1 inhibitor or STAT1 shRNA but not with STAT3 inhibitor or STAT3 shRNA (Figure 6E-F). Overall, these results suggest that IL-10 secreted by M2-Mφ plays an important role in MCL growth via STAT1 signaling.
Effect of in vivo macrophage depletion on the growth of established MCL tumors
Clodrosome is an effective and versatile way to deplete macrophages in vivo, as they can be recognized as foreign particles and become engulfed by macrophages.25 First, we determined the differential effect of Clodrosome on malignant B cells vs M1 and M2 macrophages in vitro; THP-1-Mφ were exposed to Clodrosome or Encapsome (control). After 3 days of culture, M2-Mφ exhibited an up to 50% decrease in viability, whereas survival of MCL cell lines JVM2 and Mino or M1-Mφ were marginally affected by clodrosome (supplemental Figure 7A-B).
To evaluate whether the macrophage phenotype could exert influence on the growth of pre-established xenografted MCL tumors, clodronate-encapsulated liposome (Clodrosome) was used. We challenged NOD/SCID mice that possessed tumors after the introduction of Mino cells together with human CD14+ monocytes by administration of Clodrosome or negative control Encapsome intraperitoneally (n = 6 per group). Tumor growth was subsequently assessed in both groups of mice. A significant (P < .001) reduction in tumor growth and weight of the mice treated with Clodrosome was observed compared with the mice treated with Encapsome alone (Figure 7A-C). Histologically, the Encapsome-treated group showed dense tumor cellularity, whereas Clodrosome-treated mice did not exhibit as much tumor formation (Figure 7D). After harvesting MCL mouse tumors, we performed immunofluorescence to identify the CD68+/CD163+ Mφ-positive cells between 2 groups. Significantly fewer CD68+ or CD163+ or CD68+/CD163+ cells were seen in the Clodrosome-treated group, suggesting that macrophages were indeed depleted (Figure 7E; supplemental Figure 7C-D). Although it is evident from these results that Clodrosome treatment has an inhibitory effect on the established tumor, questions remained as to whether its mechanisms of action were restricted to macrophage depletion. We also observed that the phosphorylation of STAT1 molecules in tumor cells was negatively influenced after Clodrosome treatment (Figure 7F). These data suggest that the TAMs in the MCL microenvironment may favor tumorigenesis.

Macrophage depletion abolished the MCL tumor growth in vivo. Tumor size (A), tumor weight (B), and growth kinetics (C) of Mino + CD14+ monocytes (5 × 10⁶, 1:1) implanted subcutaneously into the flank of male NOD/SCID mice with and without 200 µL (5 mg/mL) of Clodrosome or Encapsome (vehicle control) injection. Data are presented as mean ± standard deviation; n = 7 tumors. (D) Hematoxylin and eosin staining of the Clodrosome-treated and untreated mouse xenograft samples. (E) Immunofluorescence showing CD68 and CD163 staining in the Clodrosome- and control-treated mice group. (F) Immunofluorescence staining showing CD19 (green) and p-STAT1 (red) staining in the Clodrosome- and control-treated groups. Data were repeated in 2 mouse tumors, and a representative image is shown. ***P < .001.
Macrophage depletion abolished the MCL tumor growth in vivo. Tumor size (A), tumor weight (B), and growth kinetics (C) of Mino + CD14+ monocytes (5 × 10⁶, 1:1) implanted subcutaneously into the flank of male NOD/SCID mice with and without 200 µL (5 mg/mL) of Clodrosome or Encapsome (vehicle control) injection. Data are presented as mean ± standard deviation; n = 7 tumors. (D) Hematoxylin and eosin staining of the Clodrosome-treated and untreated mouse xenograft samples. (E) Immunofluorescence showing CD68 and CD163 staining in the Clodrosome- and control-treated mice group. (F) Immunofluorescence staining showing CD19 (green) and p-STAT1 (red) staining in the Clodrosome- and control-treated groups. Data were repeated in 2 mouse tumors, and a representative image is shown. ***P < .001.
Discussion
TAMs have been identified as an adverse prognostic factor in many solid tumors and correlate with poor prognosis depending on the tumor type.10,26,27 Patients with higher numbers of CD163+ or CD206+ M2 TAMs correlated with poor prognosis in acute lymphoblastic leukemia and acute myeloid leukemia.28-30 TAMs have received particular attention in Hodgkin lymphoma,31 but their role in non-Hodgkin lymphoma has not been well studied. The tumor microenvironment involved in lymphoid malignancies is diverse, based in part at least on lymphoma subtypes with varying biology.
Pham et al32 have shown that freshly obtained MCL effusions and apheresis contain various cell types, including macrophages that are required for in vitro MCL growth. To investigate the full complexity of the microenvironmental network in MCL cells in vivo, we used immunocompetent syngeneic and immunodeficient xenograft mouse models and showed the increased infiltration of F4/80+ macrophages into MCL tumors. This study is consistent with CD68+ TAMs in patients with follicular lymphoma, an indolent lymphoma subtype.33 Activated macrophages exhibit 2 functional states within the tumor microenvironment, M1 and M2 macrophages, with either antitumor vs protumor roles depending on the tumor type.34 Several reports observed that the majority of the infiltrated macrophages are M2 TAMs35,36 ; however, we observed TAMs of M1 or M2 phenotype within the MCL tumors, suggesting that TAMs were not purely polarized to M2 macrophages. We have also seen the difference between the M1 and M2 ratio in 2 different lymphoma mouse models. In the syngeneic murine lymphoma model, we observed almost equal distribution of M1 and M2, although xenograft models established from Mino (mixed with CD14+) cells had significantly more M2 than M1 macrophages. Based on insights from our results, the cytokine repertoire within the tumor microenvironment triggers M2 polarization of resident macrophages, whereas infiltrating macrophages tend to maintain the M1 phenotype for a period before they undergo M2 differentiation. These results warrant further investigation to understand the prognostic role of M1/M2 macrophages in B-cell lymphoma.
The interplay between cancer cells and bystander nonmalignant cells in lymphoid tissues is known as a major driver for chemoresistance and tumor expansion in chronic lymphoid leukemia.37 Similarly, the potential role of circulating MCL cells in shaping the supportive microenvironment via macrophage polarization has been recently reported.38 In this study, ex vivo differentiated macrophages polarized in the presence of MCL tumor cells yielded a M2-like macrophage phenotype. Our study is also consistent with prior reports describing cross-talk between hematologic cancerous cells, and TAMs could induce the M2 phenotype in TAMs.39 Moreover, our study found that normal B cells when cocultured with macrophages favor M1-like macrophages by increasing IL-12 expression. This study is consistent with an earlier report describing macrophage differentiation by pre/pro–B cells.40 Taken together, MCL cells can polarize the macrophages to M2-like macrophages to create a supportive microenvironment.
Immunosuppressive cytokines released from tumor cells play an important role in modulating the microenvironment. Furthermore, results indicate that MCL cells polarize macrophages by producing immunosuppressive soluble factor IL-10. It is possible that M2 TAMs might be regulated by other cytokines such as CSF1 in MCL, as previously reported by Papin et al.38 Because M2 polarization is a complex process and there are other players involved, the mechanisms that underlie IL-10–mediated M2 polarization need to be further investigated. Our unpublished data suggest that lymphoma-derived chemokine CCL3 can upregulate IL-10 secretion and provide a positive feedback loop to maintain M2 polarization to evade immune surveillance. This is illustrated in our in vitro coculture experiments and in vivo xenograft models, in which the presence of TAMs promoted the growth and tumorigenesis of MCL cells. Given the key role of cytokines in cell–cell interactions, we identified IL-10 as the key cytokine in the macrophage cocultures with MCL cells. IL-10 has been implicated in tumorigenesis and disease progression by distinct mechanisms such as increasing activation of STAT signaling.41 Herein, we revealed that IL-10 phosphorylated STAT1, which led to growth of MCL cells. This is consistent with a study in which CD68+ MCLs support chronic lymphoid leukemia cell migration and growth through activation of MAPK signaling.42 Future studies focused on molecular analyses will define the exact mechanism of selective STAT1 activation and subsequent M2 polarization.
Many clinical approaches to therapeutically target TAMs in various cancers are currently under investigation.43,44 We described the therapeutic potential of targeting MCL-associated TAMs by depleting them with liposomal clodronate in vivo. Clodronate-treated MCL tumors exhibited less tumor burden compared with the control. Liposomal clodronate is capable of selectively depleting phagocytic cells such as macrophages and monocytes in mice, which has been successfully applied in several tumor models.45 The dependency of MCL on the immunosuppressive TAMs makes this malignancy an excellent candidate for cancer immunotherapy combination approaches. Our data emphasize that in vivo manipulation of TAMs can have a pronounced impact on MCL progression. Overall, we have shown, at both the molecular and functional level, that malignant MCL cells can polarize macrophages to M2-like macrophages, which favor the MCL growth and proliferation via IL-10/STAT1 signaling. Here we provide proof-of-principle that the manipulation of lymphoma cell/TAM interactions may be of benefit in designing potential therapeutic strategies for MCL or other lymphoid malignancies.
Acknowledgments
The authors thank Kimberlyn Acklin (GW Cancer Center Flow Cytometry Core) for assistance with the flow analysis.
This work was supported by start-up funding from George Washington University, Cancer Center to M.G.
Authorship
Contribution: K.L. and J.S. conducted the experiments and acquired and analyzed the data; K.L. also performed the experiments related to revision and made the final figures; H.K. and M.S. performed the experiments; M.R.S. provided the cell line and edited the paper; S.B.M. provided thoughtful suggestions and help in writing the manuscript; M.G. conceived and designed the study, analyzed the data, wrote the manuscript, and finalized the figures; and all the authors reviewed and approved the manuscript.
Conflict-of-interest disclosure: The authors declare no competing financial interests.
Correspondence: Mamta Gupta, Department of Biochemistry and Molecular Medicine, School of Medicine and Health Sciences, George Washington University, GW Cancer Center, Washington, DC 20052; e-mail: magupta@gwu.edu.

