

Key Points
CD4+ T cells promote, whereas CD8+ T cells restrain, CLL in Eμ-TCL1 mice.
CD40L on CD4+ T cells and CD40 on leukemic B cells are dispensable for CLL development in Eμ-TCL1 mice.

Abstract
Chronic lymphocytic leukemia (CLL) is caused by the progressive accumulation of mature CD5+ B cells in secondary lymphoid organs. In vitro data suggest that CD4+ T lymphocytes also sustain survival and proliferation of CLL clones through CD40L/CD40 interactions. In vivo data in animal models are conflicting. To clarify this clinically relevant biological issue, we generated genetically modified Eμ-TCL1 mice lacking CD4+ T cells (TCL1+/+AB0), CD40 (TCL1+/+CD40−/−), or CD8+ T cells (TCL1+/+TAP−/−), and we monitored the appearance and progression of a disease that mimics aggressive human CLL by flow cytometry and immunohistochemical analyses. Findings were confirmed by adoptive transfer of leukemic cells into mice lacking CD4+ T cells or CD40L or mice treated with antibodies depleting CD4 T cells or blocking CD40L/CD40 interactions. CLL clones did not proliferate in mice lacking or depleted of CD4+ T cells, thus confirming that CD4+ T cells are essential for CLL development. By contrast, CD8+ T cells exerted an antitumor activity, as indicated by the accelerated disease progression in TCL1+/+TAP−/− mice. Antigen specificity of CD4+ T cells was marginal for CLL development, because CLL clones efficiently proliferated in transgenic mice whose CD4 T cells had a T-cell receptor with CLL-unrelated specificities. Leukemic clones also proliferated when transferred into wild-type mice treated with monoclonal antibodies blocking CD40 or into CD40L−/− mice, and TCL1+/+CD40−/− mice developed frank CLL. Our data demonstrate that CD8+ T cells restrain CLL progression, whereas CD4+ T cells support the growth of leukemic clones in TCL1 mice through CD40-independent and apparently noncognate mechanisms.
Introduction
Chronic lymphocytic leukemia (CLL) is the most common type of adult leukemia; it remains incurable despite the most modern therapies, including kinase or BCL2 inhibitors.1 The disease is characterized by the progressive accumulation of mature CD5+ B lymphocytes within localized proliferation centers in lymph nodes, spleen, and bone marrow, as well as in peripheral blood.2
CLL is not a homogeneous disease, and CLL patients can be stratified into 2 subgroups based on the presence or the absence of mutations in the immunoglobulin heavy chain variable region (IGHV) genes with a dramatically different clinical outcome, suggesting that microenvironmental stimuli, including antigen selection, have a strong impact on the development of the disease.3,4 Indeed, regardless of the mutational status of the IGHV, it is recognized that all CLLs have features of antigen-experienced mature lymphocytes, thus alluding to different sets of antigenic elements that are shaping the biological and clinical behavior of the 2 subsets of patients.5
In addition to antigenic stimulation, compelling in vitro evidence suggests that survival and proliferation of CLL cells within proliferation centers are also largely dependent on microenvironmental interactions originating from the surrounding cellular elements (eg, monocyte-derived nurse-like cells, mesenchymal stromal cells, and CD4+ T lymphocytes), which deliver membrane-bound and soluble signals to CLL cells.6 Indeed, CLL cells rapidly undergo apoptosis when they are collected from the patient and cultured ex vivo, unless they are placed in contact with stromal cells.7
The role of T cells in the microenvironment of CLL is far from being elucidated, and a collection of experimental evidence supports the roles of guardians and drivers of disease.8 On one hand, CD8+ T cells appear to exert a protective role in CLL, as suggested by the observation that higher relative numbers of peripheral blood CD8+ T cells correlate with better overall survival in CLL patients8 and that CD8+ T cells are clonally expanded.9 However, in most CLL patients, CD8+ T cells show gene expression alteration10 and are profoundly dysfunctional when in contact with leukemic B cells, alluding to a mechanism of tumor evasion.11,12 These data have been confirmed in the Eμ-TCL1 (TCL1) mice expressing T-cell leukemia virus-1 under control of the IGHV promoter and IGH enhancer in B cells,13-15 making it a primary model to investigate the pathogenesis of human CLL. Experiments directly addressing the role of CD8+ T cells in CLL in vivo are limited to the adoptive transfer of TCL1 cells into immunodeficient mice or congenic C57BL/6 (C57) mice treated with monoclonal antibodies that deplete CD8+ cells.15
On the other hand, CD4+ T cells in patients with CLL are also genetically deranged10 and dysfunctional,11 partially accounting for the weakened CD8+ T-cell response observed in patients. Indeed, like CD8+ T lymphocytes, CD4+ T cells from patients with CLL have an impaired cytoskeleton rearrangement capacity that prevents immunological synapse formation.11 CD4+ T cells appear to have a proleukemic effect through CD40-dependent signals delivered by CD40L expressed on activated CD4+ T cells, which are attracted by CLL B cells through the release of CCL216 and induce survival and proliferation of CLL cells, at least in vitro.17 Nevertheless, the expression of CD40L on T cells from patients with CLL is downregulated,18 and the response to CD40 stimulation on CLL cells is very heterogeneous. Approximately 40% of patients with CLL harbor CD40L-independent leukemic clones showing features of biological aggressiveness and poor clinical outcome.19
The role of CD4+ T cells and CD40L in the development and progression of CLL in vivo has also been investigated in xenograft models,20,21 although they only provide limited information on CD4+ T cell/CLL cell interactions. Thus, the role of CD4 and CD40L in the natural history of CLL remains unclear.
To further address this clinically relevant biological question, we generated genetically modified TCL1 mice lacking CD40 (TCL1+/+CD40−/−) or CD8+ T cells (TCL1+/+TAP−/−), and we monitored the appearance and progression of CLL that mimics aggressive human CLL by flow cytometry and immunohistochemical analyses. Findings were confirmed by adoptive transfer of leukemic clones into mice lacking CD4+ T cells or CD40L or treated with monoclonal antibodies that deplete CD4 T cells or block CD40L/CD40 interactions.
Our data demonstrate that CD8+ T cells restrain CLL progression, whereas CD4+ T cells support the proliferation of leukemic clones in TCL1 mice through CD40-independent mechanisms.
Methods
Mice
C57 (Charles River Italy), Eμ-TCL1,13 NOD.Cg-PrkdcscidH2-Ab1tm1Doi/SzJ (AB0),22 B6.129P2-Cd40tm1Kik/J (CD40−/−),23 B6.129S2-Cd40lgtm1Imx/J (CD40L−/−),24 B6.129S2-Tap1tm1Arp/J (TAP−/−),25 B6.Cg-Tg(TcraTcrb)425Cbn/J (OT-II),26 and Tγ7CD45.1 mice27 (all on the C57 background) were treated in accordance with guidelines of the Institutional Animal Care and Use Committee of San Raffaele Scientific Institute. Eμ-TCL1 mice were backcrossed to TAP−/−, AB0, or CD40−/− mice for ≥6 generations to obtain TCL-1+/+TAP−/−, TCL-1+/+AB0, or TCL-1+/+CD40−/− mice. For transplantation studies, 7- to 8-week-old C57BL/6N mice were challenged intraperitoneally (day 0) with 5 × 10⁶ cells enriched from the spleen of leukemic Eμ-TCL1 mice with a mouse B-cell enrichment kit (EasySep; STEMCELL Technologies). Blood was collected every 10 to 14 days from the retro-orbital vein and analyzed for the presence of CD5+/CD19+ CLL cells. TCL-1+/+ and TCL-1+/+CD40−/− mice were euthanized at 40 weeks for disease scoring. Spleen, liver, lymph nodes, and bone marrow specimens were fixed in formalin, embedded in paraffin, decalcified (in the case of bone marrow), and stained with hematoxylin and eosin. A semiquantitative analysis was performed by an expert hematopathologist in a blinded fashion based on the degree of leukemic involvement of the parenchyma: 0, absent; 1, mild; 2, moderate; and 3, strong.
Treatment with depleting antibodies
The InVivoMAb anti-mouse CD40Lα (clone MR-1) or CD4α (clone GK1.5; both from Bio X Cell) monoclonal antibody was used to block CD40L or deplete CD4+ T cells in C57 mice. The corresponding isotype controls (hamster immunoglobulin G [IgG] or rat IgG2b; Bio X Cell) were used in control mice. Mice were treated with 300 μg of antibody or the isotype control twice a week for 2 weeks, followed by a maintenance dose of 300 μg per mouse once a week for 6 weeks. Mice received 3 doses of the antibodies before the challenge with leukemia (ie, 10 days after the vaccination), and the absence of CD4+ lymphocytes in the blood was checked by flow cytometry.
Flow cytometry studies
After the lysis of erythrocytes by incubation for 10 minutes at room temperature in ammonium chloride solution (ACK) lysis buffer (0.15 M NH4Cl, 10 mM KHCO3, and 0.1 mM Na2EDTA [pH 7.2-7.4]), blood samples were incubated with purified anti-mouse CD16/32 antibody (BioLegend, San Diego, CA) for 10 minutes at room temperature to block Fc receptors. The following antibodies were added for 15 minutes at 4°C: PE/Cy7 anti-mouse CD19 (clone 1D3; cat. no. 557655; BD Pharmingen, San Diego, CA), PE/Cy5 anti-mouse CD5 (clone 53-7.3; cat. no. 100610; BD Pharmingen), FITC anti-Igκ (clone 187.1; cat. no. 732423; Beckman Coulter, Brea, CA), and PE anti-Igλ (clone JC5-1; cat. no. 7324433; Beckman Coulter). FITC anti-mouse CD4 and Pacific Blue Hamster anti-mouse CD3 (BD Pharmingen) were used to check for CD4+ T-cell depletion. For the analysis of the immune infiltrate, the spleen was harvested and gently smashed with the plunge of a syringe on a 70-μm cell strainer; 1 × 10⁶ cells were used for the staining. The following antibodies were added for 15 minutes at 4°C: FITC anti-mouse CD8 (clone 53-6.7; cat. no. 100705), PerCP/Cyanine5.5 anti-mouse NK1.1 (clone PK136; cat. no. 108727), PE/DAZZLE 594 anti-mouse CD39 (clone Duha59; cat. no. 143812), PE/Cyanine5 anti-mouse CD62L (clone MEL-14; cat. no. 104410), Alexa Fluor 700 anti-mouse CD4 (clone RM4-5; cat. no. 100536; all from BioLegend), V500 anti-mouse CD44 (clone IM7; cat. no. 560780, BD Biosciences, San Diego, CA), BV605 anti-mouse PD-1 (clone 29F.1A12; cat. no. 135220; BioLegend), BUV395 anti-mouse CD25 (clone PC61; cat. no. 564022, BD Biosciences), BUV737 anti-mouse CD3 (clone 145-2C11; cat. no. 612771, BD Biosciences), FITC anti-mouse IAb (clone 25-9-17; cat. no. 114406), APC anti-mouse Gr1 (clone RB6-8C5; cat. no. 108412), APC/Cyanine7 anti-mouse F4/80 (clone BM8; cat. no. 123118; all from BioLegend), Alexa Fluor 700 anti-mouse Ly6G (clone 1A8; cat. no. 561236, BD Biosciences), PB anti-mouse CD11b (clone M1/70; cat. no. 101224), BV510 anti-mouse/human CD45R/B220 (clone RA3-6B2; cat. no. 103248), PE anti-mouse CD23 (clone B3B4; cat. no. 101607), BV421 anti-mouse CD21/CD35 (CR2/CR1) (clone CR2/CR1; cat. no. 123422), PE anti-mouse CD43 (clone s11; cat. no. 143205), APC anti-mouse CD5 (clone 53-7.3; cat. no. 100626), FITC APC anti-mouse IgD (clone 11-26C2A; cat. no. 405704), PE anti-mouse IgM (clone RMM-1; cat. no. 406504), Biotin anti-mouse IgM (clone RMM-1; cat. no. 406504), and APC Streptavidin (cat. no. 405207; BioLegend). Staining for BV421 anti-mouse CCR6 (clone 29-2L17; cat. no. 129818), PE/Cy7 anti-mouse CCR4 (clone 2G12; cat. no. 131213), and APC anti-mouse CXCR3 (clone CXCR3-173; cat. no. 126512; all from BioLegend) was performed at 37°C for 20 minutes. PE anti-mouse FOXP3 (clone FJK-16s; cat. no. 12-5773-82; eBioscience, San Diego, CA) staining was performed at 4°C for 30 minutes after the cells had been fixed and permeabilized with a Transcription Factor Staining Buffer Set (cat. no. 00-5523-00; eBioscience), according to the manufacturer’s instruction. Dead cells were excluded by staining with ViaKrome (cat. no. C36628; Beckman Coulter). Data were acquired on a BD FACSCanto (BD Pharmingen) or a CytoFLEX LX (Beckman Coulter) flow cytometer and analyzed using FlowJo software (TreeStar Inc.).
Statistical analysis
Statistical analyses were performed with Prism 6 software (GraphPad Prism). For normally distributed data and comparisons between 2 groups, P values were calculated using an unpaired 2-tailed Student t test or a nonparametric Mann-Whitney test, with 95% confidence intervals. Statistical analysis of animal survival was performed using the log-rank test.
Results
In vivo proliferation of transplanted TCL1 leukemic B cells is CD4+ T cell dependent but CD40L independent
To investigate the role of CD4+ T cells and CD40L in CLL pathogenesis, we adoptively transferred CD19+ cells enriched from the spleen of transgenic TCL1 mice13 into C57 mice, AB0 congenic mice lacking MHC class II molecules, which show near-complete elimination of CD4+ T lymphocytes from their spleen and lymph nodes,22 or CD40L−/− congenic mice24 (Figure 1A). Early (ie, <6 month-old) and late (>8 month-old) CLL clones from TCL1 mice proliferated well in the peritoneal cavity, blood, and spleen of C57 and CD40L−/− mice but had a marginal representation in mice lacking CD4+ T cells; this suggests that CD4+ T cells are needed, whereas CD40L is dispensable, for CLL development in TCL1 mice (Figure 1B-C).
![CD4+ T cells support in vivo proliferation of CLL cells in a CD40L-independent manner. (A) Schematic representation of the experiment. Briefly, CD19+ cells were enriched from the spleens of young (<6 months) or old (>8 months) TCL-1+/+ mice and injected (5 × 10⁶ cells per mouse) intraperitoneally into 8-week old C57, CD40L−/−, or AB0 mice. After 5 months, mice were euthanized and analyzed by flow cytometry for accumulation of CD19+CD5+ B cells within the peritoneal cavity, blood, and spleen. (B) Gating strategy. (C) Mean ± standard error of the mean (SE) of the relative contribution of CD19+CD5+ cells to the entire B-cell pool in the indicated organs. Each point represents a single mouse. Data are expressed as a percentage and are representative of ≥3 independent experiments. CD19+ cells were enriched from the spleen of a TCL-1+/+ mouse, labeled with CFSE, and injected (5 × 10⁶ cells per mouse) intraperitoneally into 8-week-old C57, AB0, and CD40L−/− mice. Mice were euthanized 2 weeks later, and cells in the peritoneal cavity were analyzed by flow cytometry for dilution of CFSE within the gate of CD19+CD5+ B cells. Statistical analysis of all panels: Student t test, *P < .05, **P < .01, ***P < .001, ****P < .0001. (D) Representative dot plots of CD19+CFSE+ cells. The gate identifies proliferating cells that have diluted CFSE. (E) Mean ± SE of CFSE+ cells in the peritoneal cavity. Data are expressed as a percentage; each point represents a single mouse. Data are representative of ≥3 independent experiments. Mice were treated with anti-CD4 antibody or isotype control antibodies. (F) CD4+ cell depletion was verified in peripheral blood from treated mice using flow cytometry. Data are reported as a percentage of CD4+ cells; each point represents a single mouse. (G) After 3 doses of antibodies, the mice in (F) were challenged with CD19+ cells enriched from the spleen of a TCL-1+/+ mouse, and leukemia in peripheral blood was checked by flow cytometry. Solid line, CTRL-treated mice; dashed red line, mice treated with anti-CD4 antibodies (depleted [DEP]). (H) C57BL/6 mice were challenged with CD19+ cells enriched from the spleen of a TCL-1+/+ mouse and were left untreated (C57) or were treated with anti-CD40L or isotype control antibodies (CTRL). Leukemia development was analyzed and reported as described in panel B. Each point represents a single mouse. FSC, forward scatter; SSC, side scatter.](https://ash.silverchair-cdn.com/ash/content_public/journal/bloodadvances/5/14/10.1182_bloodadvances.2020003795/5/m_advancesadv2020003795f1.png?Expires=1763467054&Signature=jYZamzg72S-K041uEOTIGwVYQeEDAYqFyFB59Oovzmq4l4Mw0sUZqqutPl0eDVRhUyR3C0-EnCdQfhZxO0p~qOw-oC21xPne2C72asaX7G1sBnUui8zgY6w6P6tZqMlMcX-52DDgspMhDxezftxEnUHgRY~JRfmyi0jsRC2TqGJyec4OumfC9yWUG85JgTEYc34j~Gwitdgd6LTcIk27UyV63EhGwFhv3N5cH6J3-lV9-UOYqQUhYP4UKuu3zoEByPgllUwfafseXVgkzkDe-T7eKEZRlI2afW9733Be9Dr-kujy26nt9PlgqBEsYqMq1uT3v6VzRJNA6bCoxevM-g__&Key-Pair-Id=APKAIE5G5CRDK6RD3PGA)
CD4+ T cells support in vivo proliferation of CLL cells in a CD40L-independent manner. (A) Schematic representation of the experiment. Briefly, CD19+ cells were enriched from the spleens of young (<6 months) or old (>8 months) TCL-1+/+ mice and injected (5 × 10⁶ cells per mouse) intraperitoneally into 8-week old C57, CD40L−/−, or AB0 mice. After 5 months, mice were euthanized and analyzed by flow cytometry for accumulation of CD19+CD5+ B cells within the peritoneal cavity, blood, and spleen. (B) Gating strategy. (C) Mean ± standard error of the mean (SE) of the relative contribution of CD19+CD5+ cells to the entire B-cell pool in the indicated organs. Each point represents a single mouse. Data are expressed as a percentage and are representative of ≥3 independent experiments. CD19+ cells were enriched from the spleen of a TCL-1+/+ mouse, labeled with CFSE, and injected (5 × 10⁶ cells per mouse) intraperitoneally into 8-week-old C57, AB0, and CD40L−/− mice. Mice were euthanized 2 weeks later, and cells in the peritoneal cavity were analyzed by flow cytometry for dilution of CFSE within the gate of CD19+CD5+ B cells. Statistical analysis of all panels: Student t test, *P < .05, **P < .01, ***P < .001, ****P < .0001. (D) Representative dot plots of CD19+CFSE+ cells. The gate identifies proliferating cells that have diluted CFSE. (E) Mean ± SE of CFSE+ cells in the peritoneal cavity. Data are expressed as a percentage; each point represents a single mouse. Data are representative of ≥3 independent experiments. Mice were treated with anti-CD4 antibody or isotype control antibodies. (F) CD4+ cell depletion was verified in peripheral blood from treated mice using flow cytometry. Data are reported as a percentage of CD4+ cells; each point represents a single mouse. (G) After 3 doses of antibodies, the mice in (F) were challenged with CD19+ cells enriched from the spleen of a TCL-1+/+ mouse, and leukemia in peripheral blood was checked by flow cytometry. Solid line, CTRL-treated mice; dashed red line, mice treated with anti-CD4 antibodies (depleted [DEP]). (H) C57BL/6 mice were challenged with CD19+ cells enriched from the spleen of a TCL-1+/+ mouse and were left untreated (C57) or were treated with anti-CD40L or isotype control antibodies (CTRL). Leukemia development was analyzed and reported as described in panel B. Each point represents a single mouse. FSC, forward scatter; SSC, side scatter.
CD4+ T cells support in vivo proliferation of CLL cells in a CD40L-independent manner. (A) Schematic representation of the experiment. Briefly, CD19+ cells were enriched from the spleens of young (<6 months) or old (>8 months) TCL-1+/+ mice and injected (5 × 10⁶ cells per mouse) intraperitoneally into 8-week old C57, CD40L−/−, or AB0 mice. After 5 months, mice were euthanized and analyzed by flow cytometry for accumulation of CD19+CD5+ B cells within the peritoneal cavity, blood, and spleen. (B) Gating strategy. (C) Mean ± standard error of the mean (SE) of the relative contribution of CD19+CD5+ cells to the entire B-cell pool in the indicated organs. Each point represents a single mouse. Data are expressed as a percentage and are representative of ≥3 independent experiments. CD19+ cells were enriched from the spleen of a TCL-1+/+ mouse, labeled with CFSE, and injected (5 × 10⁶ cells per mouse) intraperitoneally into 8-week-old C57, AB0, and CD40L−/− mice. Mice were euthanized 2 weeks later, and cells in the peritoneal cavity were analyzed by flow cytometry for dilution of CFSE within the gate of CD19+CD5+ B cells. Statistical analysis of all panels: Student t test, *P < .05, **P < .01, ***P < .001, ****P < .0001. (D) Representative dot plots of CD19+CFSE+ cells. The gate identifies proliferating cells that have diluted CFSE. (E) Mean ± SE of CFSE+ cells in the peritoneal cavity. Data are expressed as a percentage; each point represents a single mouse. Data are representative of ≥3 independent experiments. Mice were treated with anti-CD4 antibody or isotype control antibodies. (F) CD4+ cell depletion was verified in peripheral blood from treated mice using flow cytometry. Data are reported as a percentage of CD4+ cells; each point represents a single mouse. (G) After 3 doses of antibodies, the mice in (F) were challenged with CD19+ cells enriched from the spleen of a TCL-1+/+ mouse, and leukemia in peripheral blood was checked by flow cytometry. Solid line, CTRL-treated mice; dashed red line, mice treated with anti-CD4 antibodies (depleted [DEP]). (H) C57BL/6 mice were challenged with CD19+ cells enriched from the spleen of a TCL-1+/+ mouse and were left untreated (C57) or were treated with anti-CD40L or isotype control antibodies (CTRL). Leukemia development was analyzed and reported as described in panel B. Each point represents a single mouse. FSC, forward scatter; SSC, side scatter.
Lack of CLL development in AB0 mice could result from the lack of engraftment of leukemic B-cell clones or from the collapse of CLL cells after initial engraftment. To discriminate between the 2 possibilities, C57, CD40L−/−, and AB0 mice were challenged with carboxyfluorescein diacetate succinimidyl ester (CFSE)-labeled CD19+ cells from TCL1 mice, and mice were euthanized 2 weeks later to assess leukemic cells in their peritoneal cavity. As shown in Figure 1D and 1E, CLL cells proliferated well in C57 and CD40L−/− mice, but not in AB0 mice, confirming that they can efficiently engraft in mice lacking CD40L but not CD4+ T cells.
To formally demonstrate that CD4+ T cells are relevant in leukemogenesis, CLL growth was assessed in mice treated with antibodies depleting CD4+ T cells (Figure 1F); it was found to be blocked during treatment (Figure 1G).
Finally, to provide additional evidence that the CD40L/CD40 interaction is dispensable in CLL development, C57 mice transplanted with CD19+ cells from TCL1 mice were treated with monoclonal antibodies specific for CD40L or control antibodies. As shown in Figure 1H, CLL developed in all challenged mice, irrespective of the treatment.
Altogether, these data strongly support an essential role for CD4+ T cells in CLL development in the transplantable TCL1 model. They also demonstrate that CD40L is not needed to support CLL development in these mice.
CLL fully develops in transgenic TCL1+/+CD40−/− mice
The transplantable TCL1 model allowed us to address the role of CD40L in CLL development, but it did not clarify the role of CD40. To address this issue, we generated TCL1+/+CD40−/− mice and compared CLL development in these mice with age- and sex-matched TCL1+/+ mice (Figure 2A). CD19+CD5+ cells were clearly measurable in the peritoneal cavity of both strains by 15 weeks of age (Figure 2B). By 20 weeks of age, leukemic cells were also found in the blood of transgenic mice, with a greater expansion in TCL1+/+CD40−/− mice than in TCL1+/+ mice (Figure 2C). At this time point, the former mice also experienced accumulation of leukemic cells in the spleen (Figure 2D-E) and bone marrow (Figure 2F). Leukemic clones also continued to expand at 30 weeks (Figure 2B-F).
![CD40L is dispensable for CLL induction in the TCL-1 model. (A) Schematic representation of the experiment. TCL-1+/+ and TCL-1+/+CD40−/− mice were analyzed for accumulation of CD19+CD5+ B cells by flow cytometry. Relative contribution (mean ± standard deviation [SD]) of CD19+CD5+ cells to the entire B-cell pool in the peritoneal cavity (B), peripheral blood (C), spleen (E), and bone marrow (F). Each point represents a single mouse. Statistical analysis fo all panels: Student t test, *P < .05, **P < .01, ***P < .001, ****P < .0001. (D) Representative photographs of the spleens (left and middle panels) and cell counts of the whole spleens (right panel) from TCL-1+/+ and TCL-1+/+CD40−/− mice at 20 weeks of age. No statistically significant differences were found. (G) Representative photographs of hematoxylin and eosin–stained tissue sections of the spleen and the liver from TCL-1+/+ and TCL-1+/+CD40−/− mice (magnification ×400; left panel) and CLL disease score (right panel) of hematoxylin and eosin–stained tissue sections from different organs from TCL-1+/+ and TCL-1+/+CD40−/− mice at 20 weeks of age, as defined by a hemopathologist in a blinded fashion based on the degree of leukemia infiltration and disruption of the normal organ architecture in spleen, liver, lymph node, and bone marrow. Boxplots depict the first quartile, median, and third quartile. Vertical bars represent whiskers that indicate the distance from the smallest (lower bar) and the highest (upper bar) nonoutlier values from the first and third quartiles, respectively. Each point represents a single mouse. No statistically significant differences were found using the Student t test. (H) Pie charts show the frequency of the immune infiltrate gated on live cells from the spleen of TCL-1+/+ (left panel) and TCL-1+/+CD40−/− (right panel) mice at 20 weeks of age. Reported cells were identified as follow: CD3+ T lymphocytes (CD3+), macrophages (CD11b+F4/80+), neutrophils (CD11b+Ly6G+), myeloid-derived suppressor cells (MDSCs; CD11b+Gr1+), natural killer (NK) cells (NK1.1+CD3−), and B cells (B220+). All other populations are classified as “Other cells.” (I) Number of CD4 (left panel) and CD8 (right panel) T cells with the described phenotype infiltrating the spleen of TCL-1+/+ and TCL-1+/+CD40−/− mice from panel H. Reported cells were identified as follows: Treg (CD3+CD4+CD25+FOXP3+), Th1 cells (CD3+CD4+CXCR3+CCR4−CCR6−), Th1/17 (CD3+CD4+CXCR3+CCR4−CCR6+), Th2 (CD3+CD4+CXCR3−CCR4+CCR6−), Th17 (CD3+CD4+CXCR3−CCR4+CCR6+), effector CD4+ T cells (CD3+CD4+CD44+CD62L−), memory CD4+ T cells (CD3+CD4+CD44+CD62L+), naive CD4+ T cells (CD3+CD4+CD44−CD62L+), effector CD8+ T cells (CD3+CD8+CD44+CD62L−), memory CD8+ T cells (CD3+CD8+CD44+CD62L+), naive CD8+ T cells (CD3+CD8+CD44−CD62L+), and exhausted CD8+ T cells (CD3+CD8+CD39+PD-1+). Dead cells were excluded by viability dye staining. Bar graphs show mean ± SD (n = 5 mice per group). (J) Frequency of B-cell populations infiltrating the spleen of TCL-1+/+ and TCL-1+/+CD40−/− mice from panel H. Reported cells were identified as follows: mature B cells (B220+IgD+IgMint), T1 B cells (B220+IgD−IgM+), T2 B cells (B220+IgD+IgM+), follicular B cells (CD19+CD23+CD21int), and marginal zone B cells (CD19+CD23−CD21+). Dead cells were excluded by viability dye staining. Bar graphs show mean ± SD (n = 5 mice per group). wks, weeks.](https://ash.silverchair-cdn.com/ash/content_public/journal/bloodadvances/5/14/10.1182_bloodadvances.2020003795/5/m_advancesadv2020003795f2.png?Expires=1763467054&Signature=uvOaTWkqS2u94ZhBQpWjMvpe1dHH2Zo92yfjIT4fInQkEgeV8izN0qTEsGS--ds53GYXdou~mpWT-mVdfhU0~eL5wsDnQMDakLlpNACC8HiPwhls0XUH-JH6KuOef6DCXZH6kJ0GdDQC0G5McQdtgvXdofFPJMvQSNddMEz4sI1--5lSsnTCoNwzVPwClFhWt7wAkaNtgRjp4ARDFy1hvsdykbnCPgB70tFoYfkvweXCibYG76do-XFGletkd4p-MIp63F4Qkf5uqwm-fFHRfYzzseVZbZ3jfRUFnj8ePCkjQ7lzRu0qOE0rWx3b02ppGyNs4bbkoW7TFxB35~K5PQ__&Key-Pair-Id=APKAIE5G5CRDK6RD3PGA)
CD40L is dispensable for CLL induction in the TCL-1 model. (A) Schematic representation of the experiment. TCL-1+/+ and TCL-1+/+CD40−/− mice were analyzed for accumulation of CD19+CD5+ B cells by flow cytometry. Relative contribution (mean ± standard deviation [SD]) of CD19+CD5+ cells to the entire B-cell pool in the peritoneal cavity (B), peripheral blood (C), spleen (E), and bone marrow (F). Each point represents a single mouse. Statistical analysis fo all panels: Student t test, *P < .05, **P < .01, ***P < .001, ****P < .0001. (D) Representative photographs of the spleens (left and middle panels) and cell counts of the whole spleens (right panel) from TCL-1+/+ and TCL-1+/+CD40−/− mice at 20 weeks of age. No statistically significant differences were found. (G) Representative photographs of hematoxylin and eosin–stained tissue sections of the spleen and the liver from TCL-1+/+ and TCL-1+/+CD40−/− mice (magnification ×400; left panel) and CLL disease score (right panel) of hematoxylin and eosin–stained tissue sections from different organs from TCL-1+/+ and TCL-1+/+CD40−/− mice at 20 weeks of age, as defined by a hemopathologist in a blinded fashion based on the degree of leukemia infiltration and disruption of the normal organ architecture in spleen, liver, lymph node, and bone marrow. Boxplots depict the first quartile, median, and third quartile. Vertical bars represent whiskers that indicate the distance from the smallest (lower bar) and the highest (upper bar) nonoutlier values from the first and third quartiles, respectively. Each point represents a single mouse. No statistically significant differences were found using the Student t test. (H) Pie charts show the frequency of the immune infiltrate gated on live cells from the spleen of TCL-1+/+ (left panel) and TCL-1+/+CD40−/− (right panel) mice at 20 weeks of age. Reported cells were identified as follow: CD3+ T lymphocytes (CD3+), macrophages (CD11b+F4/80+), neutrophils (CD11b+Ly6G+), myeloid-derived suppressor cells (MDSCs; CD11b+Gr1+), natural killer (NK) cells (NK1.1+CD3−), and B cells (B220+). All other populations are classified as “Other cells.” (I) Number of CD4 (left panel) and CD8 (right panel) T cells with the described phenotype infiltrating the spleen of TCL-1+/+ and TCL-1+/+CD40−/− mice from panel H. Reported cells were identified as follows: Treg (CD3+CD4+CD25+FOXP3+), Th1 cells (CD3+CD4+CXCR3+CCR4−CCR6−), Th1/17 (CD3+CD4+CXCR3+CCR4−CCR6+), Th2 (CD3+CD4+CXCR3−CCR4+CCR6−), Th17 (CD3+CD4+CXCR3−CCR4+CCR6+), effector CD4+ T cells (CD3+CD4+CD44+CD62L−), memory CD4+ T cells (CD3+CD4+CD44+CD62L+), naive CD4+ T cells (CD3+CD4+CD44−CD62L+), effector CD8+ T cells (CD3+CD8+CD44+CD62L−), memory CD8+ T cells (CD3+CD8+CD44+CD62L+), naive CD8+ T cells (CD3+CD8+CD44−CD62L+), and exhausted CD8+ T cells (CD3+CD8+CD39+PD-1+). Dead cells were excluded by viability dye staining. Bar graphs show mean ± SD (n = 5 mice per group). (J) Frequency of B-cell populations infiltrating the spleen of TCL-1+/+ and TCL-1+/+CD40−/− mice from panel H. Reported cells were identified as follows: mature B cells (B220+IgD+IgMint), T1 B cells (B220+IgD−IgM+), T2 B cells (B220+IgD+IgM+), follicular B cells (CD19+CD23+CD21int), and marginal zone B cells (CD19+CD23−CD21+). Dead cells were excluded by viability dye staining. Bar graphs show mean ± SD (n = 5 mice per group). wks, weeks.
CD40L is dispensable for CLL induction in the TCL-1 model. (A) Schematic representation of the experiment. TCL-1+/+ and TCL-1+/+CD40−/− mice were analyzed for accumulation of CD19+CD5+ B cells by flow cytometry. Relative contribution (mean ± standard deviation [SD]) of CD19+CD5+ cells to the entire B-cell pool in the peritoneal cavity (B), peripheral blood (C), spleen (E), and bone marrow (F). Each point represents a single mouse. Statistical analysis fo all panels: Student t test, *P < .05, **P < .01, ***P < .001, ****P < .0001. (D) Representative photographs of the spleens (left and middle panels) and cell counts of the whole spleens (right panel) from TCL-1+/+ and TCL-1+/+CD40−/− mice at 20 weeks of age. No statistically significant differences were found. (G) Representative photographs of hematoxylin and eosin–stained tissue sections of the spleen and the liver from TCL-1+/+ and TCL-1+/+CD40−/− mice (magnification ×400; left panel) and CLL disease score (right panel) of hematoxylin and eosin–stained tissue sections from different organs from TCL-1+/+ and TCL-1+/+CD40−/− mice at 20 weeks of age, as defined by a hemopathologist in a blinded fashion based on the degree of leukemia infiltration and disruption of the normal organ architecture in spleen, liver, lymph node, and bone marrow. Boxplots depict the first quartile, median, and third quartile. Vertical bars represent whiskers that indicate the distance from the smallest (lower bar) and the highest (upper bar) nonoutlier values from the first and third quartiles, respectively. Each point represents a single mouse. No statistically significant differences were found using the Student t test. (H) Pie charts show the frequency of the immune infiltrate gated on live cells from the spleen of TCL-1+/+ (left panel) and TCL-1+/+CD40−/− (right panel) mice at 20 weeks of age. Reported cells were identified as follow: CD3+ T lymphocytes (CD3+), macrophages (CD11b+F4/80+), neutrophils (CD11b+Ly6G+), myeloid-derived suppressor cells (MDSCs; CD11b+Gr1+), natural killer (NK) cells (NK1.1+CD3−), and B cells (B220+). All other populations are classified as “Other cells.” (I) Number of CD4 (left panel) and CD8 (right panel) T cells with the described phenotype infiltrating the spleen of TCL-1+/+ and TCL-1+/+CD40−/− mice from panel H. Reported cells were identified as follows: Treg (CD3+CD4+CD25+FOXP3+), Th1 cells (CD3+CD4+CXCR3+CCR4−CCR6−), Th1/17 (CD3+CD4+CXCR3+CCR4−CCR6+), Th2 (CD3+CD4+CXCR3−CCR4+CCR6−), Th17 (CD3+CD4+CXCR3−CCR4+CCR6+), effector CD4+ T cells (CD3+CD4+CD44+CD62L−), memory CD4+ T cells (CD3+CD4+CD44+CD62L+), naive CD4+ T cells (CD3+CD4+CD44−CD62L+), effector CD8+ T cells (CD3+CD8+CD44+CD62L−), memory CD8+ T cells (CD3+CD8+CD44+CD62L+), naive CD8+ T cells (CD3+CD8+CD44−CD62L+), and exhausted CD8+ T cells (CD3+CD8+CD39+PD-1+). Dead cells were excluded by viability dye staining. Bar graphs show mean ± SD (n = 5 mice per group). (J) Frequency of B-cell populations infiltrating the spleen of TCL-1+/+ and TCL-1+/+CD40−/− mice from panel H. Reported cells were identified as follows: mature B cells (B220+IgD+IgMint), T1 B cells (B220+IgD−IgM+), T2 B cells (B220+IgD+IgM+), follicular B cells (CD19+CD23+CD21int), and marginal zone B cells (CD19+CD23−CD21+). Dead cells were excluded by viability dye staining. Bar graphs show mean ± SD (n = 5 mice per group). wks, weeks.
Additionally, groups of 20-week-old TCL1+/+CD40−/− mice and TCL1+/+ mice were euthanized to undergo tissue examination. As shown in Figure 2G, the disease score attributed to the indicated organs by an experienced and blinded hematopathologist confirmed a high degree of dissemination and extension of disease in both strains of mice. Thus, CD40L is dispensable for CLL development, and CD40 is not required to induce CLL in TCL1 mice.
Although mice deficient in CD40L expression do not exhibit alterations in the percentages of B- and T-cell subpopulations and gross developmental deficiencies,24 the spleen of TCL1+/+CD40−/− mice contained fewer CD4 and CD8 T cells compared with TCL1+/+ mice (Figure 2H), and the former showed a lower frequency of Th1 and memory CD8+ T cells (Figure 2I). It is known that CD40/CD40L interactions are required to generate an effective CD8 memory T-cell response.28 Because CD40L-deficient mice display selective deficiencies in humoral immunity,24 we better characterized the B-cell compartment in TCL1+/+CD40−/− mice. The B-cell architecture of the spleen of TCL1+/+CD40−/− mice was modified substantially by the absence of CD40/CD40L interactions, leading to a dramatic decrease in the frequency of follicular B cells (Figure 2H). Based on these findings, we cannot exclude that impairment of an effective CD8+ T-cell memory and disorganization of the B-cell compartment may also contribute to the increased aggressiveness of CLL in in TCL1+/+CD40−/− mice.
Overall, our results demonstrate a dispensable role for CD40/CD40L stimulation in the development of murine CLL, whereas they suggest that CD4 T cells are essential for the appearance and development of the disease.
Cognate antigen recognition by CD4+ T cells is not needed to promote CLL development in TCL1 mice
As an additional step to investigate the role of CD4+ T cells in CLL pathogenesis, we asked whether CD4 T cell/CLL cell interaction was mediated by cognate antigen recognition. Thus, we engrafted CLL cells into C57 or transgenic OTII mice, whose T-cell receptor (TCR) repertoire in CD4+ T cells is skewed toward chicken ovalbumin 323-339 in the context of I-Ab major histocompatibility complex (MHC) class II.26 As additional control, leukemic cells were injected into the peritoneal cavity of AB0 mice (Figure 3A). As expected, CLL developed in C57 mice (Figure 3B) but not in AB0 mice (Figure 3C). CLL also developed in all OTII challenged mice (Figure 3D), suggesting that CD4+ T cells support CLL growth independently of TCR antigen recognition on leukemic cells.
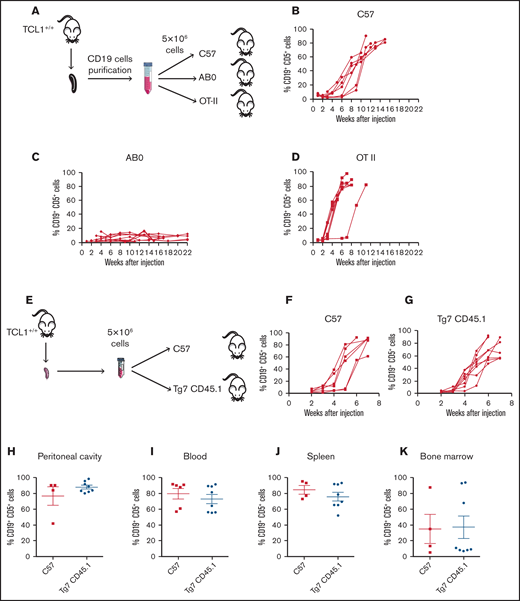
CD4+ T cells support in vivo proliferation of CLL cells independently by the antigen specificity. (A) Schematic representation of the experiment. Flow cytometry monitoring of peripheral blood from CD19+CD5+ cells obtained from a TCL1+/+ mouse and adoptively transferred into C57 (B), AB0 (C), or OT-II (D) mice. Each line represents a single mouse. Data are a pool of ≥3 independent experiments. (E) Schematic representation of the experiment. CLL appearance was monitored by flow cytometry in the peripheral blood of C57 (F) and Tg7CD45.1 (G) mice. Quantification of CD19+ CD5+ cells in peritoneal cavity (H), blood (I), spleen (J), and bone marrow (K) of the mice in panels F and G. Each point represents a single mouse. Data are a pool of 2 independent experiments. No statistically significant differences were found using the Student t test.
CD4+ T cells support in vivo proliferation of CLL cells independently by the antigen specificity. (A) Schematic representation of the experiment. Flow cytometry monitoring of peripheral blood from CD19+CD5+ cells obtained from a TCL1+/+ mouse and adoptively transferred into C57 (B), AB0 (C), or OT-II (D) mice. Each line represents a single mouse. Data are a pool of ≥3 independent experiments. (E) Schematic representation of the experiment. CLL appearance was monitored by flow cytometry in the peripheral blood of C57 (F) and Tg7CD45.1 (G) mice. Quantification of CD19+ CD5+ cells in peritoneal cavity (H), blood (I), spleen (J), and bone marrow (K) of the mice in panels F and G. Each point represents a single mouse. Data are a pool of 2 independent experiments. No statistically significant differences were found using the Student t test.
To confirm the findings obtained in OTII mice, TCL1 CD19+ cells were injected into C57 or Tg7CD45.1 mice expressing an MHC class II–restricted TCR specific for a peptide derived from the glycoprotein of vesicular stomatitis virus (Figure 3E).27 Disease developed in all challenged mice, irrespective of their genetic background (Figure 3F-G). Additionally, flow cytometry analysis of peritoneal cavity (Figure 3H), blood (Figure 3I), spleen (Figure 3J), and bone marrow (Figure 3K) confirmed a disease extension that was comparable in C57 and Tg7CD45.1 mice.
Altogether, these results support the hypothesis that antigen specificity of CD4+ T cells is not relevant for the in vivo growth of CLL cells.
CD8+ T cells contribute to immune surveillance against CLL in TCL1 mice
To test the role of CD8+ T lymphocytes during CLL development in the Eμ-TCL1 model, we generated TCL1+/+TAP−/− mice by backcrossing TCL1 mice with TAP−/− mice. The latter mice are deficient in antigen presentation for defective expression of functional MHC class I molecules on thymic epithelial cells, leading to the absence of CD8+ T cells (Figure 4A).25 The disease fully developed in TCL1+/+TAP−/− mice, as quantified in peripheral blood (Figure 4B), and these mice died earlier than did TCL1 mice (Figure 4C). Thus, in contrast with CD4+ T cells, CD8+ T cells exert an antitumor activity in TCL1 mice affected by CLL.
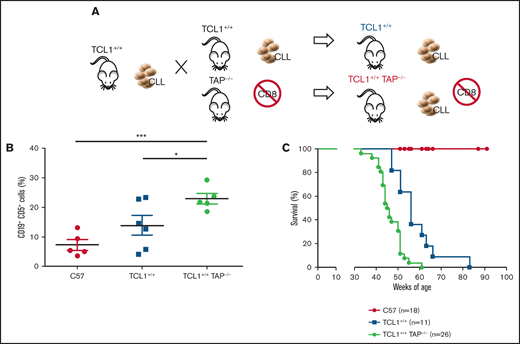
CD8+ T cells restrain CLL progression. (A) Schematic representation of the experiment. (B) Mean ± standard deviation of the relative contribution of CD19+CD5+ cells to the entire B-cell pool in peripheral blood. Statistical significance was analyzed by Student t test: *P < .05, ***P < .001. Each point represents a single mouse. (C) Survival (Kaplan-Meier plot) of mice. Statistical analyses were performed using the log-rank test: C57 vs TCL1+/+, P < .0001; C57 vs TCL1+/+TAP−/−, P < .0001; TCL1+/+ vs TCL1+/+TAP−/−, P = .0002. Mice were included in the analysis after disease-mediated death or when they became moribund.
CD8+ T cells restrain CLL progression. (A) Schematic representation of the experiment. (B) Mean ± standard deviation of the relative contribution of CD19+CD5+ cells to the entire B-cell pool in peripheral blood. Statistical significance was analyzed by Student t test: *P < .05, ***P < .001. Each point represents a single mouse. (C) Survival (Kaplan-Meier plot) of mice. Statistical analyses were performed using the log-rank test: C57 vs TCL1+/+, P < .0001; C57 vs TCL1+/+TAP−/−, P < .0001; TCL1+/+ vs TCL1+/+TAP−/−, P = .0002. Mice were included in the analysis after disease-mediated death or when they became moribund.
Discussion
The goal of this work was to provide evidence of the contribution of T cells to CLL pathogenesis. We observed that CD8+ and CD4+ T cells exert opposing roles in TCL1 mice: CD8+ T cells restrain CLL progression, whereas CD4 T cells are essential for the growth of neoplastic B-cell clones in these mice via CD40-independent mechanisms.
The finding that TCL1+/+TAP−/− mice experienced reduced overall survival is in line with the correlative studies conducted in patients with CLL8,9 and data collected in the transplantable TCL1 model.15 A protective role for CD8+ T cells can also be inferred from the findings that, at 20 and 30 weeks of age, TCL1+/+CD40−/− mice have a higher frequency of CD19+CD5+ cells in their blood, spleen, and bone marrow compared with TCL1 mice, likely because of impaired CD8+ T-cell function. Indeed, CD40/CD40L interaction is required to generate an effective CD8+ memory T-cell response.28 Additionally, expression of CD40 on leukemic cells enhances immune recognition by cytotoxic T lymphocytes through upregulation of the costimulatory molecules CD80 and CD86.29
CD4+ T cells are instead essential for CLL development and progression in TCL1 mice. This conclusion is supported by several independent pieces of experimental evidence. Indeed, CLL clones do proliferate and expand well in CD40L−/− mice but not in AB0 mice lacking CD4+ T cells. Additionally, C57 mice engrafted with CLL cells and treated with CD4-depleting antibodies experienced a profoundly delayed CLL.
Our data differ from the study by Kocher et al, in which CD4+ T cells were dispensable for CLL development in GK5 mice30 transplanted with leukemic TCL1 cells or crossed with TCL1 mice.31 The apparently contrasting results between that study and our work might be explained by the fact that adaptive immune responses are profoundly altered in GK5 mice31: classical and nonclassical monocytes supplement for the loss of Th cells by favoring CLL development. Kocher et al31 also confirmed previous data about the role of myeloid cells in supporting leukemic CLL clones.32 Thus, fully functional CD4+ T cells and myeloid cells appear to be relevant components of the tumor microenvironment in CLL.
Both subgroups of patients with CLL and with mutated or unmutated IGHV show a highly restricted repertoire of immunoglobulin genes, supporting the hypothesis that antigen encounter is the basis of disease pathogenesis in all cases.33 Interestingly, patients with CLL and unmutated IGHV preferentially express low-affinity, polyreactive, and self-reactive B-cell receptors (BCRs),33 suggesting that their neoplastic clones derive from germinal center–independent memory B cells or pre–germinal center naive B cells. Conversely, patients with mutated IGHV are characterized by oligoclonal and monoreactive BCRs,33 further supporting the hypothesis that, in the latter patients, CLL clones derive from germinal center–experienced B cells.
Similarly to human CLL, CLL clones in TCL-1 mice express stereotyped nonmutated B IGHV, which has been shown to bind several exogenous antigens and autoantigens.34-36 Chen et al reported the natural selection of a more aggressive CLL clone specific for the autoantigen phosphatidylcholine through several transfers of B cells from a single TCL1 mouse into SCID mice.37 To investigate the role of exogenous antigens in CLL pathogenesis, TCL1 mice were also crossed with genetically engineered mice expressing defined virus-specific BCRs.38 The investigators reported that those BCRs drove CLL by light chain–dependent cross-reactivity with autoantigens.38 In another study, Singh et al39 identified 2 unmutated B-cell leukemic clones with different degrees of dependence on CD40, BCR, and germinal centers that spontaneously developed in genetically engineered IgH.TEμ mice. In this model, more aggressive leukemic clones harboring the IGHV11 variant, which is unmutated, stereotype and also present in TCL1 mice,37 also developed in CD40L−/− mice unable to organize germinal centers.39 On the contrary, the IGHV1 variant expressed by the majority of leukemic clones correlated with a milder disease that was dependent on CD40 and BCR stimulation and the germinal centers.39 Interestingly, RNA-sequencing analyses showed that only the IGHV1 variant clustered with human CLL cells stimulated with CD40 agonistic antibodies and IL-4.39 Altogether, these findings further support a dual model of CLL leukemogenesis with B cells clones that might be germinal center independent or dependent.
Because we observed that CLL grew in CD40L−/− mice, in mice treated with anti-CD40L antibodies, and in CD40−/− mice, aggressive CLL in TCL1 mice appears to be completely independent of CD40 signaling. The finding that CD4+ T cells are required and CD40/CD40L interactions are dispensable for CLL development are reminiscent of what was reported by Tretter et al.40 Indeed, they showed that in vitro direct cellular contact with activated CD4+ T cells was required for CLL cell proliferation. However, blocking CD40/CD40L interactions by CD40 monoclonal antibodies caused only partial inhibition of B-cell activation. It remains to be defined by which mechanism CD4+ T cells propel CD40L-independent CLL growth.
In addition to CD40L, soluble factors released from CD4+ T cells sustain survival and proliferation of CLL clones. Interleukin-2 (IL-2),41 IL-4,42 IL-15,43 and IL-2144 reduce apoptosis or favor proliferation of human CLL cells when given in combination with B-cell stimulation (eg, cytosine guanine dinucleotide or CD40L),45 but the degree varies among patients.41,44 Early in vitro studies also identified interferon-γ (IFN-γ) as an inhibitor of apoptotic cell death in human CLL,46 although Roessner et al recently reported that proliferation of transplanted TCL1 cells was not inhibited in Tbx21−/− bone marrow chimeric mice, which have a smaller number of IFN-γ–producing Th1 T cells.47 Additionally, neutralization of total IFN-γ after tumor injection resulted in faster CLL progression in the transplantable TCL1 model.15
We can also hypothesize about the potential contributions of members of the tumor necrosis factor receptor (TNFR) family other than CD40 (eg, BAFF and APRIL), which also could function to activate NF-κB and support CLL survival.48-50 In this vein, CD4+ T cells might interact directly with CLL cells or through the induction of leukemia survival factors by neutrophils.51,52 Also, other factors independent of the TNFR family of proteins may play a role in the activation of NF-κB, as noted recently for Wnt5a-ROR1 via a mechanism that functions independent of the TNFR family of receptors.53–56
Altogether these and our data support a model by which CD4+ T cells are essential for CLL development and progression in TCL1 mice, through mechanisms that are independent of the CD40/CD40L axis. More studies are warranted to further define which membrane-bound or soluble factor is directly responsible for this T-cell–mediated effect, because this might have relevant implications in the future design of novel treatments for patients with CLL.
Acknowledgments
The authors thank Matteo Iannacone (San Raffaele Scientific Institute, Milan, Italy) for providing Tg7CD45.1 mice.
This work was supported by Fondazione Associazione Italiana per la Ricerca sul Cancro, AIRC (FIRC) 5 per 1000 Molecular Clinical Oncology Special Program (grant 9965) (M.B., P.D., G.C., and P.G.) and 5 per 1000 2019 (grant 22737) (P.D.). A.C. and A.B. were awarded a fellowship from AIRC/FIRC.
Authorship
Contribution: M.B. and A.C. conceived the study (assisted by P.G., G.C., P.D., and M.T.S.B.) and designed the experiments; M.G., A.B., E.C., A.R., J.B., and M.T.S.B. performed experiments; M.P. performed immunohistochemical analyses; M.G. took care of the mouse colonies; M.G., A.B., and A.C. prepared the figures; M.B. and A.C. wrote the manuscript; and A.B., G.C., P.D., M.P., and P.G. commented on the manuscript; and all authors read and approved the final version of the manuscript.
Conflict-of-interest disclosure: The authors declare no competing financial interests.
The current affiliation for E.C. is AstraZeneca SpA, Milan, Italy.
The current affiliation for A.R. is Thenewway, The BlocPartners, Milan, Italy.
The current affiliation for M.T.S.B. is Department of Experimental Therapeutics, Division of Cancer Medicine, The University of Texas MD Anderson Cancer Center, Houston, TX.
The current affiliation for A.C. is Institute of Oncology Research, Oncology Institute of Southern Switzerland, Bellinzona, Switzerland.
Correspondence: Matteo Bellone, Cellular Immunology Unit, IRCCS Ospedale San Raffaele, Via Olgettina 58, 20132 Milan, Italy; e-mail: bellone.matteo@hsr.it.

