

Key Points
Gata2b is required for embryonic HSPC expansion, but not HSPC generation in zebrafish.
Gata2b plays an instructive role in the lineage output of HSPCs in zebrafish.

The differentiation of hematopoietic stem cells (HSCs) is tightly controlled to ensure a proper balance between myeloid and lymphoid cell output. GATA2 is a pivotal hematopoietic transcription factor required for generation and maintenance of HSCs. GATA2 is expressed throughout development, but because of early embryonic lethality in mice, its role during adult hematopoiesis is incompletely understood. Zebrafish contains 2 orthologs of GATA2: Gata2a and Gata2b, which are expressed in different cell types. We show that the mammalian functions of GATA2 are split between these orthologs. Gata2b-deficient zebrafish have a reduction in embryonic definitive hematopoietic stem and progenitor cell (HSPC) numbers, but are viable. This allows us to uniquely study the role of GATA2 in adult hematopoiesis. gata2b mutants have impaired myeloid lineage differentiation. Interestingly, this defect arises not in granulocyte-monocyte progenitors, but in HSPCs. Gata2b-deficient HSPCs showed impaired progression of the myeloid transcriptional program, concomitant with increased coexpression of lymphoid genes. This resulted in a decrease in myeloid-programmed progenitors and a relative increase in lymphoid-programmed progenitors. This shift in the lineage output could function as an escape mechanism to avoid a block in lineage differentiation. Our study helps to deconstruct the functions of GATA2 during hematopoiesis and shows that lineage differentiation flows toward a lymphoid lineage in the absence of Gata2b.
Introduction
Hematopoietic stem cells (HSCs) have the capacity to self-renew and generate all lineages of the hematopoietic system.1 The HSC pool is a heterogeneous population of cells that are tightly controlled by cell-intrinsic and -extrinsic cues to maintain a balance between myeloid and lymphoid cell commitment.2-5 It is currently under debate whether HSCs can flow between myeloid and lymphoid lineage commitment or whether the HSC pool consists of separate lymphoid- and myeloid-biased HSCs.6
The transcription factor GATA2 has a key role in blood cell formation during mammalian embryonic development. GATA2 expression is tightly regulated during distinct stages of hematopoietic development and plays crucial roles in the specification of hemogenic endothelium (HE) and the generation and maintenance of HSCs.7-11 A role for this transcription factor in myeloid/lymphoid commitment is supported by findings of reduced and impaired granulocyte-macrophage progenitors in Gata2+/− mice.12-14 Conversely, retroviral-mediated overexpression of Gata2 results in enhanced self-renewal of myeloid progenitors and a block in lymphoid differentiation.15 Homozygous germ line deletion of Gata2 in mice results in embryonic lethality at E10, just before the generation of the first HSCs.16
Zebrafish is an ideal in vivo model in which to study the function of GATA2 in hematopoiesis. Embryonic hematopoietic development in zebrafish is similar to that of other vertebrates, including mammals. Like in mice, the first HSCs are generated in the dorsal aorta from HE cells and are subsequently amplified in the fetal liver equivalent, the caudal hematopoietic tissue (CHT).17-22 The HSCs then populate the kidney marrow (KM), which is the site of adult hematopoiesis in zebrafish. In this organ, all hematopoietic lineages are present,23 and hematopoietic cells morphologically resemble the corresponding human cells.
Zebrafish have 2 orthologs of GATA2: Gata2a and Gata2b. Previous studies have shown that gata2b is prominently expressed in hematopoietic stem and progenitor cells (HSPCs), whereas gata2a is mainly expressed in the vasculature, including the HE regulated by the conserved +9.5 enhancer previously identified in mice.24,25 Knockdown of gata2b severely reduces definitive hematopoiesis during embryonic stages. Lineage tracing revealed that all definitive hematopoietic cells are derived from gata2b-expressing cells,24 indicating that Gata2b is the predominant GATA2 ortholog required for the maintenance of HSCs.
In the present study, we show that Gata2b is not required for HE specification but regulates embryonic-definitive HSPC expansion in the CHT. This allowed us to investigate the function of Gata2b in adult hematopoiesis, and here, we demonstrate that Gata2b is necessary for balanced myeloid and lymphoid output during adulthood. Single-cell transcriptome analysis revealed that Gata2b-deficient HSPCs initiate an impaired myeloid gene expression program. As a result, differentiation is not halted but instead diverges into a lymphoid program, indicated by coexpression of lymphoid and myeloid genes within single HSPCs.
Materials and methods
Generation of gata2b-mutant zebrafish
gata2b-mutant zebrafish were generated using CRISPR/Cas9 targeting of exon 3. Single guide RNAs were designed using CHOPCHOP software and prepared according to Gagnon et al,26 with minor adjustments. All animal experiments were performed according to Dutch law.
Quantitative reverse transcription polymerase chain reaction analysis
Total RNA was isolated from 6 pooled zebrafish embryos per genotype (n = 6) using TRIzol Reagent (Life Technologies), and complementary DNA (cDNA) was synthesized using SuperScript III Reverse Transcriptase kit (Invitrogen). gata2a (forward primer, 5'-CAAACTCCACAACGTCAACAG-3'; reverse primer, 5'-CCCTCACCAGATCGTTTACTC-3') and gata2b (forward primer, 5'-TACACAATGTGAATCGCCCA-3'; reverse primer, 5'-GAAGGAGGATGGTTTGTCGT-3') expression levels were normalized to elfa (forward primer, 5'-CCGCTAGCATTACCCTCC-3'; reverse primer, 5'-CTTCTCAGGCTGACTGTG-3') expression.
ISH and analysis
At appropriate stages, 0.003% 1-phenyl-2-thiourea–treated embryos were fixed overnight with 4% paraformaldehyde in phosphate-buffered saline (PBS) containing 3% sucrose and subsequently transferred to methanol. KM smears were fixed in methanol. In situ hybridization (ISH) of embryos was performed as previously described.27 The cmyb and runx1 probes were a gift from Roger Patient and were quantified as described previously.28 ISH of KM smears was performed as follows: DIG-11-UTP–labeled s100a10b probe was incubated overnight at 68°C; slides were blocked at room temperature in MABT (sodium chloride, maleic acid, and 1% Tween 20), 2% bovine serum albumin, and sheep serum for a minimum of 3 hours, and αDIG antibody was incubated overnight at 4°C; staining was developed in tris(hydroxymethyl)aminomethane (pH 9.5), magnesium chloride, sodium chloride, and Tween 20 with 5% polyvinyl alcohol, nitro blue tetrazolium/5-bromo-4-chloro-3-indolyl phosphate-toluidine salt at room temperature for 2 days; and cells were counterstained with Nuclear Fast Red (Sigma Aldrich) and imaged using a Leica microscope (63× magnification).
s100a10b probe synthesis.
s100a10b was amplified from cDNA of adult KM (forward primer, 5'-GAG AGC AAT GGA GAC CCT GA-3'; reverse primer, 5'-ACT TCT TGG CTG CTG CTT TC-3') and cloned into pCRII-TOPO. Plasmid was linearized with HindIII and antisense probe transcribed with the DIG labeling kit (Sigma-Aldrich). Sense probe was used as negative control.
Transgenic lines, confocal imaging, and adult KM fluorescence-activated cell sorting analysis
Embryos were anesthetized using 160 mg/L of tricaine (3-amino benzoic acidethylester) and selected for reporter expression. Tg(fli:enhanced green fluorescent protein [eGFP])29 and Tg(CD41:GFP)30;Tg(flt1:RFP)31 embryos were imaged in 0.25% agarose with tricaine and imaged using a Leica SP5 confocal microscope prewarmed at 28°C. Tg(mpeg1.1:GFP),32Tg(mpx:GFP),33 and Tg(lck:GFP)34 embryos were placed in a 96-well plate (ZFplate; Hashimoto Electronic Industry Co. Ltd, Matsusaka, Japan) and imaged using a spinning disk confocal high-throughput microscope system (Opera Phenix; Perkin Elmer) equipped with a dry 10× objective (NA 0.3). B-cell populations were analyzed using Tg(IgM:GFP)35 zebrafish. Adult zebrafish were euthanized, and KM was isolated and dissociated by pipetting in PBS/10% fetal calf serum. For for live/dead discrimination, 0.5 mg/L of 7-amino-actinomycin D (BD Biosciences) or 1 mg/L of 4′,6-diamidino-2-phenylindole was used. For the embryonic proliferation assay, 25 embryos per genotype were pooled in prewarmed PBS/10% fetal calf serum, and single-cell suspension was prepared by adding 1% from each collagenase (I, II, and IV; Sigma-Aldrich) and incubating for 45 minutes at 37°C. Proliferation was assessed after 4% paraformaldehyde fixation and α-Ki67 staining for both embryonic and adult stages. The analysis was performed using FACSAriaIII (BD Biosciences).
Single-cell RNA sequencing
A total of 70 000 single viable cells were sorted from 2 pooled KMs of female Tg(CD41:GFP) zebrafish and supplemented with 114 to 1607 CD41:GFPlow-expressing cells. cDNA was prepared using the manufacturer’s protocol (Chromium [version 2]; 10× Genomics) and sequenced on a Novaseq 6000 instrument (Illumina). Two wild-type (WT) replicates and 2 gata2b−/− replicates were sequenced with the following read depth: WT1, 52 384 reads per cell; WT2, 43 876 reads per cell; gata2b knockout 1, 53 836 reads per cell; and gata2b knockout 2, 46 761 reads per cell. Data were analyzed using the Seurat R package,36 and a detailed description is provided in the data supplement.
Statistics
All statistical analyses were carried out in GraphPad Prism 5 (GraphPad Software). Normally distributed data were analyzed using 1-way analysis of variance with Tukey multiple comparison test when comparing 3 sample sets or Student t test when comparing 2 sample sets. Data with nonnormal distribution were analyzed using a nonparametric Kruskal-Wallis with Dunn correction test.
Results
Generation of Gata2b-deficient zebrafish line
To generate gata2b zebrafish mutants, we used CRISPR/Cas9 to target the third exon of the gata2b gene (Figure 1A). A 28-bp insertion was introduced, leading to a frameshift truncation from amino acid 185 (Figure 1B-D). Quantitative reverse transcription polymerase chain reaction analysis of gata2b on pooled WT and gata2b−/− embryos at 30 hpf indicated that gata2b expression level, a known transcriptional target of Gata2, was significantly reduced in mutant embryos (supplemental Figure 1A-B).25,37 Hereafter, we refer to this mutant as gata2b−/−.

Newly generated Gata2b mutant does not show defects in HSPC generation. (A) Schematic representation of the CRISPR strategy targeting exon 3 of gata2b and the 28-nt integration in gata2b mutants. (B) Alignment of sequencing data of WT gata2b exon 3, where the location of the guide is indicated by the blue arrow at the top of the sequence, and sequencing data from gata2b−/− DNA showing a 28-nucleotide integration. (C) Gel picture showing genotyping polymerase chain reaction of founder 3 and the F1 with a 28-bp integration in embryos 7 and 8. (D) Gata2b mutation leading to a STOP codon abrogating the protein before the DNA and protein binding zinc fingers. (E) Representative image of ISH for cmyb expression in WT and gata2b−/− embryos at 26 hours postfertilization (hpf). Bar indicates 100 μm (F) Quantitation of cmyb signal intensity relative to background in WT and gata2b−/− embryos at 26 hpf. (G) Representative image of runx1 expression in WT and gata2b−/− embryos at 26 hpf. (H) Quantitation of runx1 signal intensity relative to background in WT and gata2b−/− embryos at 26 hpf. (I) Example of endothelial-to-hematopoietic transition (EHT) event from WT Tg(fli1a:eGFP) transgenic zebrafish. Time indicated at the bottom right corner in minutes. Scale bar represents 10 μm. Arrow indicates endothelial cell undergoing hematopoietic transition. (J) Quantitation of EHT events between 32 and 40 hpf in WT, gata2b+/−, and gata2b−/− embryos. (K) Representative example of runx1 expression in WT and gata2i4/i4 embryos at 26 hpf in the aorta-gonad-mesonephros region. (L) Quantitation of signal intensity relative to background cells in WT and gata2ai4/i4 embryos at 26 hpf, where each dot represents 1 embryo (41.4 ± 4.8 and 23.5 ± 2.0; WT, n = 13; gata2ai4/i4 , n = 21). Error bars represent standard error of the mean. ***P < .001. DA, dorsal aorta; PVC, posterior cardinal vein; sp, somite pair.
Newly generated Gata2b mutant does not show defects in HSPC generation. (A) Schematic representation of the CRISPR strategy targeting exon 3 of gata2b and the 28-nt integration in gata2b mutants. (B) Alignment of sequencing data of WT gata2b exon 3, where the location of the guide is indicated by the blue arrow at the top of the sequence, and sequencing data from gata2b−/− DNA showing a 28-nucleotide integration. (C) Gel picture showing genotyping polymerase chain reaction of founder 3 and the F1 with a 28-bp integration in embryos 7 and 8. (D) Gata2b mutation leading to a STOP codon abrogating the protein before the DNA and protein binding zinc fingers. (E) Representative image of ISH for cmyb expression in WT and gata2b−/− embryos at 26 hours postfertilization (hpf). Bar indicates 100 μm (F) Quantitation of cmyb signal intensity relative to background in WT and gata2b−/− embryos at 26 hpf. (G) Representative image of runx1 expression in WT and gata2b−/− embryos at 26 hpf. (H) Quantitation of runx1 signal intensity relative to background in WT and gata2b−/− embryos at 26 hpf. (I) Example of endothelial-to-hematopoietic transition (EHT) event from WT Tg(fli1a:eGFP) transgenic zebrafish. Time indicated at the bottom right corner in minutes. Scale bar represents 10 μm. Arrow indicates endothelial cell undergoing hematopoietic transition. (J) Quantitation of EHT events between 32 and 40 hpf in WT, gata2b+/−, and gata2b−/− embryos. (K) Representative example of runx1 expression in WT and gata2i4/i4 embryos at 26 hpf in the aorta-gonad-mesonephros region. (L) Quantitation of signal intensity relative to background cells in WT and gata2ai4/i4 embryos at 26 hpf, where each dot represents 1 embryo (41.4 ± 4.8 and 23.5 ± 2.0; WT, n = 13; gata2ai4/i4 , n = 21). Error bars represent standard error of the mean. ***P < .001. DA, dorsal aorta; PVC, posterior cardinal vein; sp, somite pair.
Gata2b is dispensable in the generation of HSCs from HE
The first HSCs transdifferentiate from specialized HE cells in the aorta-gonad-mesonephros region, through a highly conserved process known as EHT.18,19,38-40 In mice, Gata2 is expressed in the endothelium, including the HE of the dorsal aorta,8 and deletion of Gata2 results in a reduction in HSC generation.7,8cmyb and runx1 are 2 bona fide marker genes for HE at 26 hpf in zebrafish.18,41 We quantified cmyb and runx1 expression by measuring pixel intensity of the ISH staining compared with background.28 Expression of cmyb (Figure 1E-F) and runx1 (Figure 1G-H) was indistinguishable between WT and Gata2b-deficient embryos at 26 hpf, indicating that specification of HE occurs normally in the absence of Gata2b.
Next, we examined the ability of HE to undergo EHT using Tg(fli1a:GFP) reporter embryos, in which GFP marks all endothelial cells, including HE.29 Consistent with our initial results, EHT events were not significantly reduced in gata2b−/− embryos compared with WT (P = .077; WT embryos, n = 18; gata2b−/− embryos, n =18; Figure 1I-J; supplemental Table 1). We conclude that neither HE specification nor HSPC generation through EHT is impaired in gata2b−/− embryos.
Gata2a is required for HE specification
GATA2 is required for the generation of HSCs in mice,7,16 but Gata2b-deficient zebrafish have intact HE and EHT (Figure 1E-J). High maternal expression of gata2b has been reported previously,24 and therefore, residual Gata2b protein levels could possibly rescue EHT. However, maternal zygotic gata2b−/− zebrafish that do not contain functional maternally provided gata2b messenger RNA are viable and survive to Mendelian ratios (supplemental Figure 1C-D), indicating that maternal expression of gata2b does not contribute to embryonic hematopoiesis. By contrast, gata2a is expressed in HE and regulates runx1 expression in HE.25 Therefore, we analyzed runx1 expression in gata2a mutants (gata2ai4/i4 , lacking a conserved endothelial enhancer).25runx1 expression at 26 hpf was reduced in gata2ai4/i4 embryos compared with WT embryos (Figure 1K-L). This confirmed that endothelial expression of gata2a, but not gata2b, is required for specification of HE and that the different functions of mammalian GATA2 are separated between Gata2a and Gata2b in zebrafish.
Gata2b is required for the expansion of definitive HSPCs during CHT amplification phase
CHT is temporally and spatially analogous to mouse fetal liver where HSPCs undergo amplification.22 We investigated whether the loss of Gata2b affects the number of definitive HSPCs in CHT between 2 and 3 days postfertilization (dpf). From 44 hpf onward, definitive HSPCs are marked by coexpression of the Tg(CD41:GFP)30 marker and the arterial Tg(flt:RFP)31 marker, because definitive HSPCs are derived from arteries.42 CD41:GFP+Flt:RFP+ cell numbers were similar in WT and gata2b−/− embryos at 52 to 54 hpf (Figure 2A-B; supplemental Table 1) and 56 to 58 hpf (Figure 2C; supplemental Table 1). However, at 76 hpf, CD41:GFP+Flt:RFP+ cells were significantly reduced in CHT in gata2b−/− embryos compared with WT (Figure 2D; supplemental Table 1).

HSPC numbers are reduced in CHT after 3 dpf in gata2b−/− embryos. (A) Example of Tg(CD41:GFP); Tg(Flt:RFP) expression in CHT of WT and gata2b−/− embryos at 76 hpf. (B-D) Quantitation of GFP+RFP+ cells in WT, gata2b+/−, and gata2b−/− embryos at different time points, where each dot represents 1 embryo: 52 to 54 hpf (8.50 ± 1.7 vs 11.86 ± 1.0) (B), 56 to 58 hpf (25.19 ± 3.2 vs 23.25 ± 2.9) (C), and 76 to 78 hpf (55.46 ± 3.8 vs 36.50 ± 3.0; P < .001) (D). Representative example of cmyb expression in WT and gata2b−/− embryos at 33 hpf (E), and quantitation of signal intensity relative to background at 33 hpf (F), where each dot represents 1 embryo. Representative example of cmyb expression in WT and gata2b−/− embryos at 56 hpf (G), and quantitation of signal intensity relative to background at 56 hpf (H), where each dot represents 1 embryo. (I) Quantitation of CD41:GFP+ cell percentages by flow cytometry at 3, 5, and 20 dpf. (J) Cell-cycle analysis by flow cytometry of Ki67 and 4′,6-diamidino-2-phenylindole (DAPI) staining of CD41:GFP+ cells in WT and gata2b−/− embryos at 75 hpf. (K) Bar graph representing the quantitation of cell cycle of CD41:GFP+ cells in WT and gata2b−/− embryos at 75 hpf. Bars represent mean ± standard error of the mean, with each dot indicating 1 pooled sample. *P < .05, **P < .01.
HSPC numbers are reduced in CHT after 3 dpf in gata2b−/− embryos. (A) Example of Tg(CD41:GFP); Tg(Flt:RFP) expression in CHT of WT and gata2b−/− embryos at 76 hpf. (B-D) Quantitation of GFP+RFP+ cells in WT, gata2b+/−, and gata2b−/− embryos at different time points, where each dot represents 1 embryo: 52 to 54 hpf (8.50 ± 1.7 vs 11.86 ± 1.0) (B), 56 to 58 hpf (25.19 ± 3.2 vs 23.25 ± 2.9) (C), and 76 to 78 hpf (55.46 ± 3.8 vs 36.50 ± 3.0; P < .001) (D). Representative example of cmyb expression in WT and gata2b−/− embryos at 33 hpf (E), and quantitation of signal intensity relative to background at 33 hpf (F), where each dot represents 1 embryo. Representative example of cmyb expression in WT and gata2b−/− embryos at 56 hpf (G), and quantitation of signal intensity relative to background at 56 hpf (H), where each dot represents 1 embryo. (I) Quantitation of CD41:GFP+ cell percentages by flow cytometry at 3, 5, and 20 dpf. (J) Cell-cycle analysis by flow cytometry of Ki67 and 4′,6-diamidino-2-phenylindole (DAPI) staining of CD41:GFP+ cells in WT and gata2b−/− embryos at 75 hpf. (K) Bar graph representing the quantitation of cell cycle of CD41:GFP+ cells in WT and gata2b−/− embryos at 75 hpf. Bars represent mean ± standard error of the mean, with each dot indicating 1 pooled sample. *P < .05, **P < .01.
The number of definitive HSPCs expanded rapidly from 52 to 76 hpf in WT embryos (6.5-fold); in gata2b−/− embryos, that expansion was reduced (3.1-fold). To support our findings, we investigated the expression of cmyb, which is a marker for proliferating HSPCs from 30 hpf.43,44 A significant reduction in cmyb expression was detectable from 33 hpf onward in the aorta-gonad-mesonephros and CHT regions of gata2b−/− embryos compared with WT (Figure 2E-H; supplemental Table 1). This analysis detected a reduction in cmyb expression levels rather than quantifying HSPC numbers. However, because the number of CD41:GFP+Flt:RFP+ cells was not affected at 33 hpf, but cmyb expression was already reduced at 33 hpf, this suggests that proliferation of definitive HSPCs is affected, resulting in a reduction of definitive HSPCs at 76 hpf (Figure 2D). To test this, proliferation was assessed by flow cytometry of CD41:GFP+ cells at 75 hpf in WT and gata2b−/− embryos. This analysis showed that Gata2b-deficient CD41:GFP+ cells had an increased proportion of cells in the G0 phase of cell cycle, explaining the reduction of HSPCs at 3 dpf (Figure 2I-K). At 5 dpf, the difference in proliferation was no longer detectable, although HSPC numbers were still reduced (Figure 2I; data not shown).
Single-cell RNA sequencing identifies lymphoid bias at the expense of myeloid lineage output in gata2b−/− KM
Because the functions of GATA2 are separated between Gata2a and Gata2b in zebrafish, and Gata2b-deficient zebrafish are viable, we can uniquely assess the function of Gata2b in adult hematopoiesis. To investigate the hematopoietic lineages in an unbiased manner and assess the impact of Gata2b deficiency on the transcriptional profile of hematopoietic progenitors and differentiated cells, the progenitor population, including lymphocytes from KM, were isolated and processed for single-cell RNA sequencing (supplemental Figure 2A-B). To enrich the scarce HSC population, we used pooled KM from 2 WT and gata2b−/−Tg(CD41:GFP) zebrafish per sample and included all CD41:GFPlow-expressing cells present in the KM pool, because these cells have been shown to contain transplantable HSCs30 (supplemental Figure 2A,C). This resulted in a mild enrichment of phenotypic HSCs, from 0.21% to 0.5% to 0.46% to 2.73% of CD41:GFPlow cells within the total progenitor population. We identified 20 different cell clusters using the nearest neighbor algorithm in the R Seurat package36 (Figure 3A; supplemental Figure 2G; supplemental data for 3D interactive graph). Most progenitors that were sequenced expressed previously characterized differentiation markers45-49 (Figure 3B-E; supplemental Figure 2H). We identified 2 HSPC populations. These clusters were characterized by the robust expression of HSC genes, like fli1a and meis1b48-50 (Figure 3F-G) and gata2b (Figure 3H), concomitant with intermediate levels of GFP derived from the CD41:GFP transgene (Figure 3I) and low expression of differentiation markers (Figure 3B-E; supplemental Figure 2H). Compared with HSPC2s, HSPC1s exhibited a lower expression of metabolic and proliferation markers like pcna and myca, suggesting that HSPC1s are more quiescent than HSPC2s (Figure 3J). Therefore, lineage trajectory analysis was started from this cluster, identifying separate lineage differentiation trajectories for the erythroid, myeloid, and lymphoid lineages (Figure 3K-L,N-Q).
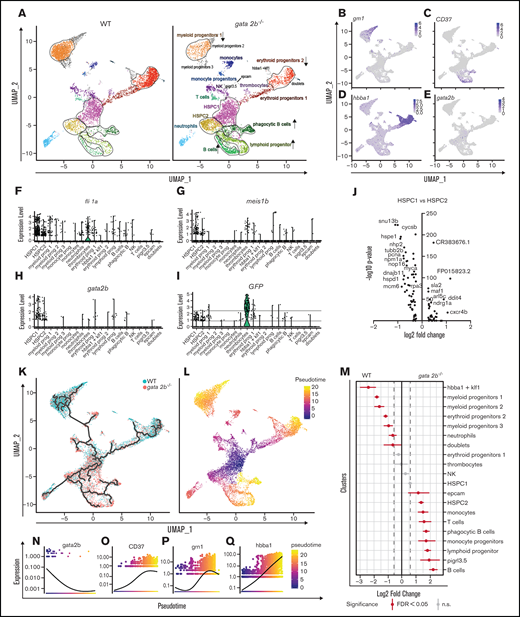
Single-cell analysis reveals that gata2b−/− KM cells are overrepresented in lymphoid lineage clusters and reduced in erythroid and myeloid lineage clusters compared with WT. (A) Split uniform manifold approximation projection (UMAP) of WT and gata2b−/− cells with cluster indication of enriched (arrow up) or reduced (arrow down) cell clusters in gata2b−/− cells. (B-E) Pooled WT and gata2b−/− UMAP feature analysis with gradual gene expression in shades of blue. Expression pattern of granulin1 (grn1) (B), cluster of differentiation 37 (CD37) (C), hemoglobin β adult (hbba1) (D), and gata2b (E). (F-I) Violin plots representing the expression levels of genes within the different clusters; each dot represents expression in 1 cell. Fli-1 proto-oncogene (fli1a) (F), meis homeobox 1b (meis1b) (G), gata2b (H), and GFP (I), indicating CD41:GFPlow cells. (J) Volcano plot comparing HSPC1s vs HSPC2s. At the left of the y-axis are genes in HSPC1s with an average logarithmic fold change less than −0.25, and to the right are genes with a logarithmic fold change >0.25 compared with HSPC2s. (K) Lineage differentiation trajectory depicted on UMAP with WT cells in blue and gata2b−/− cells in pink. (L) Pseudotime analysis assuming HSPC1s as a starting point. (M) Quantitation of proportions of distribution between WT and gata2b−/− cells in the different clusters. Significant differences are indicated in red. (N-Q) Pseudotime analysis of gene expression in lineage trajectory analysis of gata2b (N), CD37 (O), grn1 (P), and hemoglobin β adult (hbba1) (Q). FDR, false discovery rate; n.s., not significant.
Single-cell analysis reveals that gata2b−/− KM cells are overrepresented in lymphoid lineage clusters and reduced in erythroid and myeloid lineage clusters compared with WT. (A) Split uniform manifold approximation projection (UMAP) of WT and gata2b−/− cells with cluster indication of enriched (arrow up) or reduced (arrow down) cell clusters in gata2b−/− cells. (B-E) Pooled WT and gata2b−/− UMAP feature analysis with gradual gene expression in shades of blue. Expression pattern of granulin1 (grn1) (B), cluster of differentiation 37 (CD37) (C), hemoglobin β adult (hbba1) (D), and gata2b (E). (F-I) Violin plots representing the expression levels of genes within the different clusters; each dot represents expression in 1 cell. Fli-1 proto-oncogene (fli1a) (F), meis homeobox 1b (meis1b) (G), gata2b (H), and GFP (I), indicating CD41:GFPlow cells. (J) Volcano plot comparing HSPC1s vs HSPC2s. At the left of the y-axis are genes in HSPC1s with an average logarithmic fold change less than −0.25, and to the right are genes with a logarithmic fold change >0.25 compared with HSPC2s. (K) Lineage differentiation trajectory depicted on UMAP with WT cells in blue and gata2b−/− cells in pink. (L) Pseudotime analysis assuming HSPC1s as a starting point. (M) Quantitation of proportions of distribution between WT and gata2b−/− cells in the different clusters. Significant differences are indicated in red. (N-Q) Pseudotime analysis of gene expression in lineage trajectory analysis of gata2b (N), CD37 (O), grn1 (P), and hemoglobin β adult (hbba1) (Q). FDR, false discovery rate; n.s., not significant.
Proportion analysis regarding the distribution of WT and Gata2b-deficient cells between the lymphoid and myeloid lineages indicated a bias toward the lymphoid lineage in gata2b−/− cells at the expense of the myeloid lineage compared with WT (Figure 3A,K-M; supplemental Figure 2I; supplemental Table 2). The largest differences were observed in 3 clusters expressing high levels of grn1 (Figure 3B), indicating that these clusters contained myeloid progenitors and were overrepresented by WT cells (Figure 3A,K,M; supplemental Figure 2I). We defined these 3 clusters expressing myeloid-specific genes with slight differences in their expression patterns as myeloid progenitors 1, 2, and 3 (Figure 3A; supplemental Figure 2H). The grn1-expressing cluster also showed high expression of s100a10b, a potential new marker for these cells (supplemental Figure 3A). Expression analysis of KM smears showed that s100a10b was expressed in the neutrophil lineage (supplemental Figure 3B). The B-cell clusters were overrepresented by gata2b−/− cells and showed very high expression of immunoglobulin heavy variable 1-4 (ighv1-4; supplemental Figure 2H), CD37 (Figure 3C), and pax5 (data not shown), indicating that these were bona fide B-cell populations. Interestingly, we found a population of phagocytic B cells previously identified in theleosts, which express both mpeg1.1 and B-cell markers.51 Lineage trajectory analysis indicated that these cells descended from lymphoid progenitors (Figure 3C,K,L). When pseudotime analyses was performed for WT and gata2b−/− cells separately, the phagocytic B cells showed a lineage differentiation trajectory not only from lymphoid progenitors, but also from the HSPC1 population, indicating a skewing in gata2b−/− HSPCs directly toward the lymphoid lineage (supplemental Figure 2J-K).
Lack of Gata2b leads to reduced neutrophil numbers and increased lymphoid progenitors in adult KM
Because single-cell RNA sequencing analysis showed a major switch in lineage differentiation, we asked whether hematopoietic differentiation was affected in the adult gata2b−/− KM using scatter profile, transgenic marker, and morphological analyses.30,32,33,52 Although gata2b−/− embryos did not show signs of altered lineage differentiation up to 5 dpf (supplemental Figure 4A-F), scatter profiles of adult gata2b−/− zebrafish KM showed a significant reduction in the myeloid population (Figure 4A-B; Table 1) and a relative increase in the scatter population containing HSPCs and lymphoid cells at 4 months postfertilization and onward (Figure 4A,C; Table 1). This skewing in the population frequencies persisted with age (Figure 4B-C). To further address how the myeloid lineage was affected by the loss of Gata2b, Tg(mpx:GFP) expression, specifically marking neutrophils,33,53 and Tg(mpeg1.1:GFP) expression, marking monocytes and phagocytic B cells,32,54 were assessed. No significant difference was observed in mpeg:GFP+ cells between WT and gata2b−/− KM (supplemental Figure 4O-Q). gata2b−/− zebrafish showed a severe reduction in mpx:GFP+ neutrophils in the KM at 4 months postfertilization (Figure 4D-F; Table 1). Sorted mpx:GFP+ cells from these zebrafish showed that the remaining gata2b−/− mpx:GFP+ cells did not reach WT levels of GFP and had a more immature neutrophil morphology and a block at the promyelocyte stage (Figure 4G-H; supplemental Figure 3E), indicating that Gata2b is required for terminal neutrophil differentiation. This could be a result of the reduction in myeloid progenitors in the single-cell data (Figure 3A,M).

Gata2b deficiency results in decreased myeloid differentiation in adult zebrafish KM. (A) Gating strategy of fluorescence-activated cell sorting analysis of whole KM of WT and gata2b−/− zebrafish. Percentages represent the average of all zebrafish analyzed per genotype. (B-C) Quantitation as percentages of single viable cells over time of myeloid (B) and lymphoid (C) and HSPC populations. (D) Representative example of Tg(mpx:GFP) expression in WT and gata2b−/− zebrafish KM by fluorescence microscopy. (E) Forward (FSC) and side scatter (SSC) profiles of Tg(mpx:GFP) expression in WT and gata2b−/− zebrafish KM in green. (F) Quantitation of Tg(mpx:GFP)+ cells expressed as percentage in single viable cells. Each dot represents KM analysis of 1 zebrafish. (G) Representative figure of sorted Tg(mpx:GFP)+ cells from WT and gata2b−/− zebrafish KM after May Grunwald-Giemsa (MGG) staining. (H) Quantification of Tg(mpx:GFP)+ cells from WT and gata2b−/− zebrafish KM based on the differentiation phenotype using MGG staining. (I) Gating strategy for CD41:GFPlow-expressing cells in total KM in green. (J) FSC and SSC plots of WT and gata2b−/− KM cells and CD41:GFPlow-expressing cells in green. (K) Quantification of the frequency of CD41:GFPlow cells in single live cells of total KM. Each dot represents KM analysis of 1 zebrafish. (L) FSC/GFP scatter profile of Tg(IgM:GFP) WT KM. (M) Quantitation of gating 1 of Tg(IgM:GFP) WT and gata2b−/− KM as percentage of single viable cells. Each dot represents KM analysis of 1 zebrafish. (N) Quantitation of gating 3 of Tg(IgM:GFP) WT and gata2b−/− KM as percentage of single viable cells. Each dot represents KM analysis of 1 zebrafish. (O-R) Representative image of sorted IgM:GFP+ cells indicating lymphoplastic cell (O), lymphocyte (P), phagocytic B cell (Q), and plasma cell (R). (S) Quantitation of sorted IgM:GFP+ cells per genotype. Error bars represent standard error of the mean. *P < .05, **P < .01, ***P < .001, ****P < .0001.
Gata2b deficiency results in decreased myeloid differentiation in adult zebrafish KM. (A) Gating strategy of fluorescence-activated cell sorting analysis of whole KM of WT and gata2b−/− zebrafish. Percentages represent the average of all zebrafish analyzed per genotype. (B-C) Quantitation as percentages of single viable cells over time of myeloid (B) and lymphoid (C) and HSPC populations. (D) Representative example of Tg(mpx:GFP) expression in WT and gata2b−/− zebrafish KM by fluorescence microscopy. (E) Forward (FSC) and side scatter (SSC) profiles of Tg(mpx:GFP) expression in WT and gata2b−/− zebrafish KM in green. (F) Quantitation of Tg(mpx:GFP)+ cells expressed as percentage in single viable cells. Each dot represents KM analysis of 1 zebrafish. (G) Representative figure of sorted Tg(mpx:GFP)+ cells from WT and gata2b−/− zebrafish KM after May Grunwald-Giemsa (MGG) staining. (H) Quantification of Tg(mpx:GFP)+ cells from WT and gata2b−/− zebrafish KM based on the differentiation phenotype using MGG staining. (I) Gating strategy for CD41:GFPlow-expressing cells in total KM in green. (J) FSC and SSC plots of WT and gata2b−/− KM cells and CD41:GFPlow-expressing cells in green. (K) Quantification of the frequency of CD41:GFPlow cells in single live cells of total KM. Each dot represents KM analysis of 1 zebrafish. (L) FSC/GFP scatter profile of Tg(IgM:GFP) WT KM. (M) Quantitation of gating 1 of Tg(IgM:GFP) WT and gata2b−/− KM as percentage of single viable cells. Each dot represents KM analysis of 1 zebrafish. (N) Quantitation of gating 3 of Tg(IgM:GFP) WT and gata2b−/− KM as percentage of single viable cells. Each dot represents KM analysis of 1 zebrafish. (O-R) Representative image of sorted IgM:GFP+ cells indicating lymphoplastic cell (O), lymphocyte (P), phagocytic B cell (Q), and plasma cell (R). (S) Quantitation of sorted IgM:GFP+ cells per genotype. Error bars represent standard error of the mean. *P < .05, **P < .01, ***P < .001, ****P < .0001.
Adult hematopoietic cell quantitations
| WT | gata2b−/− | |
|---|---|---|
| Scatter analysis in frequency of single viable cells | n = 26 | n = 23 |
| Erythrocytes in KM (3-12 mo) | 25.4 ± 2.8 | 25.9 ± 3.0 |
| Progenitors in KM (3-12 mo) | 26.8 ± 2.0 | 24.4 ± 1.9 |
| Lymphocytes and HSCs in KM (3-12 mo) | 18.1 ± 1.1 | 29.0 ± 1.9**** |
| Myeloid cells in KM (3-12 mo) | 20.3 ± 1.4 | 10.3 ± 0.9**** |
| Reporter expression in frequency of single viable cells | ||
| Tg(mpx:GFP) (GFP+ in single live cells) | 17.2 ± 3.0 (n = 8) | 5.1 ± 1.0 (n = 7)** |
| Tg(mpeg:GFP)gl22Tg (GFP+ in single live cells) | 3.5 ± 1.9 (n = 4) | 2.1 ± 0.7(n = 6) |
| Tg(LCK:GFP) (GFP+ in single live cells) | 3.1 ± 0.8 (n = 4) | 3.4 ± 0.6 (n = 4) |
| Tg(CD41:GFP) (GFP low in single live cells) | 0.4 ± 0.1 (n = 9) | 0.4 ± 0.1 (n = 8) |
Data are given as mean ± standard error of the mean. n indicates number of zebrafish used in analysis.
**P < .01, ****P < .0001. If data are normally distributed, we used 1-way analysis of variance with Tukey posttest. If data are not normally distributed, we used Kruskal-Wallis with Dunn posttest.
Because GATA2 is also required for HSC maintenance in mice,7,12,13 we asked whether Gata2b deficiency resulted in a block in HSPC differentiation and thus an accumulation of HSPCs. In zebrafish, CD41:GFPlow expression marks the HSPC population most stringently.30 Although CD41:GFP+ cell numbers and percentages were reduced during embryonic development (Figure 2D,I), at 20 dpf these percentages normalized, resulting in comparable numbers of CD41:GFPlow cells during adulthood (Figures 2I and 4I-K), indicating that the accumulation of the population containing lymphoid cells and HSPCs in gata2b−/− KM is not due to a differentiation block in HSPCs, but instead to an increase in lymphoid cells.
Tg(IgM:GFP), marking B cells,35 and Tg(lck:GFP), marking T cells,34 were used to asses lymphoid differentiation. We did not find an increase in the lck:GFP+ population (supplemental Figure 4M-N; Table 1). However, in Tg(IgM:GFP) zebrafish, we identified several populations of IgM:GFP+ cells, with a significant increase in immature IgM:GFP+ cells (IgM:GFP3 fraction; Figure 4L-N; supplemental Figure 4G-M). We could classify the different IgM:GFP+ populations as lymphoblastic cells, lymphocytes, plasma cells, and phagocytic B cells51,55 (Figure 4O-S). In particular, phagocytic B cells were increased in gata2b−/− KM compared with WT, but mature plasma cells were significantly reduced (Figure 4S; P < .01 and P < .001, respectively). Although a majority of cells in the lymphoid and HSPC populations were not marked by known lymphoid lineage markers IgM:GFP or lck:GFP, we could still detect a significant increase in immature B cells, confirming the increase in lymphoid output in KM in gata2b−/− zebrafish compared with WT.
Gene expression analysis reveals different HSPC populations in zebrafish
Next, we explored the molecular origin of the increase in lymphoid lineage output observed in Gata2b-deficient zebrafish. Previous studies have shown that blocked neutrophil differentiation results in a shift toward monocytic lineage differentiation.56 Our data indeed show an increase in monocyte progenitors and monocytes (Figure 3M). However, we also detected a shift toward the lymphoid lineage, indicating that Gata2b is required for lineage programming in more immature progenitors. First, we tested if the lymphoid lineage bias was detectable in the HSPC clusters we had identified as HSPC1s and HSPC2s (Figure 3A).
HSPC1s made up 18% of the total analyzed KM population. Because HSCs are a rare population of cells based on transplantation studies, we hypothesized that HSPC1s also contain other progenitor cells. We subclustered HSPC1s to subdivide these progenitors (Figure 5A-B). In this way, clustering was not based on gene expression differences found in comparison with more committed cells, but only based on gene expression differences within the HSPC1 population. Eight subclusters were identified based on differential gene expression analysis (supplemental Figure 5A). These subclusters were classified as a quiescent subcluster with very low gene expression, an HSC subcluster with expression of meis1b and fli1a, 3 myeloid subclusters, 1 lymphoid subcluster, a proliferative subcluster, and an undefined subcluster (Figure 5B,E,F; supplemental Figure 5A). Interestingly, proportion analysis of WT and gata2b−/− cells showed that Gata2b-deficient cells almost entirely lost the quiescent subcluster and gained a proliferative subcluster and myeloid subcluster 3 (Figure 5C-D). A differential expression analysis of the whole HSPC1 cluster revealed a downregulation of myeloid genes like s100a10b, grn1, csf3b, and cepba in gata2b−/− HSPC1s (Figure 5G), but not a clear upregulation of lymphoid genes. When the same comparison was performed in HSPC2s (supplemental Figure 6A-B), we detected a larger reduction in the myeloid gene expression program in the entire HSPC2 cluster (supplemental Figure 6C-D) and found that gata2b−/− cells expressed higher levels of lymphoid genes like IKAROS family zinc finger 1 (ikzf1), fcer1gl, ighv1-4, ccr9a, and xbp1 (supplemental Figure 6E-J). Psuedotime analysis showed the differentiation trajectories within the HSPC1 cluster when started from the quiescent subcluster, containing most CD41:GFP-expressing cells (Figure 3E-F,H-I). When inferring gene expression in psuedotime analysis of HSPC1s, we found that gata2b and meis1 expression were highest in the quiescent population and decreased during differentiation (Figure 5J-L). Interestingly, gata2a expression did not overlap with gata2b, indicating that gata2a does not compensate for the loss of gata2b in Gata2b-deficient HSPCs (Figure 5K,M). As HSPCs become more mature, they first upregulate proliferation markers like pcna and mki67, both highly expressed in the gata2b−/− unique subcluster (Figure 5N-O). Assessing proliferation by flow cytometry of CD41:GFPlow cells in WT and gata2b−/− KM, we found that gata2b−/− CD41:GFPlow cells had increased numbers of cells in S phase, indicating that gata2b−/− zebrafish HSPCs are more proliferative (Figure 5P-R). Together, these data show that the absence of Gata2b leads to transcriptional changes in the HSPC compartment, concomitant with a shift in lineage output from the myeloid lineage toward the lymphoid lineage.

Subclustering of HSPC1s demonstrates the loss of gata2b-expressing quiescent subcluster and appearance of proliferative subcluster. (A) Cluster selection for subclustering. (B) Reclustering of the HSPC1 population split between WT and gata2b−/− cells. (C) Genotype distribution of each of the clusters, with WT cells in white and gata2b−/− cells in black. (D) Quantitation of proportions of distribution between WT and gata2b−/− cells in the different clusters. Significant differences are indicated in red. (E-F) WT and gata2b−/− feature analysis with gradual gene expression in shades of blue within HSPC1s of gata2b (E) and mki67 (F). (G) Volcano plot comparing HSPC1 gata2b−/− vs WT. At the left of the y-axis is gene expression in gata2b−/− HSPC1s with an average logarithmic fold change less than −0.25, and to the right is gene expression with a logarithmic fold change >0.25 compared with WT HSPC1s. Each dot represents a gene. (H) Lineage differentiation trajectory depicted on uniform manifold approximation projection, with WT cells in blue and gata2b−/− cells in pink. (I) Pseudotime analysis assuming the quiescent population as starting point. (J-O) Gene expression analysis on pseudotime analysis with meis1b (J), gata2b (K), GFP (L), gata2a (M), pcna (N), and ki67 (O). (P) WT and gata2b−/− feature analysis with gradual gene expression of GFP in shades of blue within HSPC1 cells. Dotted circles indicate the quiescent and HSC subcluster. (Q) Cell-cycle analysis by flow cytometry of Ki67 and DAPI staining of CD41:GFPlow cells in adult WT and gata2b−/− KM cells. (R) Bar graph representing the quantitation of cell cycle of CD41:GFPlow cells in adult WT and gata2b−/− KM cells. Bars represent mean ± standard error of the mean; each dot indicates analysis from 1 zebrafish. *P < .05, **P < .01. FDR, false discovery rate; n.s., not significant.
Subclustering of HSPC1s demonstrates the loss of gata2b-expressing quiescent subcluster and appearance of proliferative subcluster. (A) Cluster selection for subclustering. (B) Reclustering of the HSPC1 population split between WT and gata2b−/− cells. (C) Genotype distribution of each of the clusters, with WT cells in white and gata2b−/− cells in black. (D) Quantitation of proportions of distribution between WT and gata2b−/− cells in the different clusters. Significant differences are indicated in red. (E-F) WT and gata2b−/− feature analysis with gradual gene expression in shades of blue within HSPC1s of gata2b (E) and mki67 (F). (G) Volcano plot comparing HSPC1 gata2b−/− vs WT. At the left of the y-axis is gene expression in gata2b−/− HSPC1s with an average logarithmic fold change less than −0.25, and to the right is gene expression with a logarithmic fold change >0.25 compared with WT HSPC1s. Each dot represents a gene. (H) Lineage differentiation trajectory depicted on uniform manifold approximation projection, with WT cells in blue and gata2b−/− cells in pink. (I) Pseudotime analysis assuming the quiescent population as starting point. (J-O) Gene expression analysis on pseudotime analysis with meis1b (J), gata2b (K), GFP (L), gata2a (M), pcna (N), and ki67 (O). (P) WT and gata2b−/− feature analysis with gradual gene expression of GFP in shades of blue within HSPC1 cells. Dotted circles indicate the quiescent and HSC subcluster. (Q) Cell-cycle analysis by flow cytometry of Ki67 and DAPI staining of CD41:GFPlow cells in adult WT and gata2b−/− KM cells. (R) Bar graph representing the quantitation of cell cycle of CD41:GFPlow cells in adult WT and gata2b−/− KM cells. Bars represent mean ± standard error of the mean; each dot indicates analysis from 1 zebrafish. *P < .05, **P < .01. FDR, false discovery rate; n.s., not significant.
Differential gene expression analysis reveal decreased myeloid marker expression in gata2b−/− HSPCs and aberrant coexpression of myeloid and lymphoid genes
Overall, the expression of myeloid genes in gata2b−/− HSPC1s was reduced, but the percentage of gata2b−/− HSPC1s with detectable expression of myeloid genes such as grn1 was increased (Figures 5G and 6A). This apparent contradiction was clarified by an overall transcript upregulation (Figure 6A; actinb1 expression), indicative of a loss of quiescence. It is known that HSPCs can coexpress myeloid and lymphoid genes before lineage decision.57,58 Although WT cells had a clear dichotomy in expression of myeloid and lymphoid genes, gata2b−/− HSPCs had a higher fraction of cells coexpressing lymphoid and myeloid genes (Figure 6B-E). For example, increased coexpression of a phagocytic B-cell marker, igic1s1, could be detected in gata2b−/− HSPC1s together with the myeloid marker cebpb (Figure 6B). This result suggests that the loss of Gata2b does not halt HSPC differentiation, but instead redirects this toward another lineage. Interestingly, when we inferred psuedotime analysis of only WT and only gata2b−/− cells, this was exactly what we found. In gata2b−/− cells, phagocytic B cells could be formed from both lymphoid progenitors, as well as HSPC1s, as opposed to WT phagocytic B cells (supplemental Figure 2J-K). On the basis of these data, we conclude that the lymphoid bias in gata2b−/− zebrafish KM initiates in the most immature HSPC population. This is due to a failure to elicit proper expression of the myeloid differentiation program and concomitant upregulation of the lymphoid program, which redirects HSPCs toward a lymphoid fate.
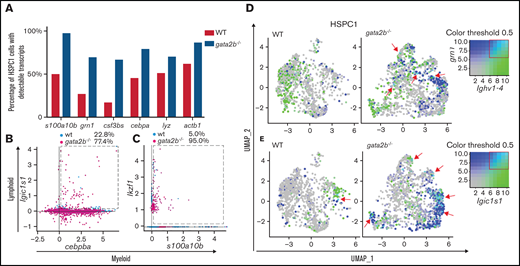
Gata2b-deficient HSPC1s show coexpression of myeloid and lymphoid gene expression programs. (A) Bar graph representing the percentage of WT HSPC1s in white and gata2b−/− HSPC1s in gray, with at least 1 read of s100a10b, grn1, colony stimulating factor 3b (csf3bs), CCAAT enhancer binding protein α (cebpa), lysozyme (lyz), or actin beta1 (actb1), indicating more cells with detectable myeloid gene expression in Gata2b-deficient HSPC1s. Coexpression analysis of the lymphoid gene igic1s1 with the myeloid gene cebpb (B) and the lymphoid gene ikzf1 (C) with the myeloid gene s100a10b. Values represent percentages of WT and gata2b−/− HSPC1s coexpressing myeloid and lymphoid genes (within the dashed box). WT and gata2b−/− feature analysis representing coexpression analysis of the lymphoid gene ighv1-4, with the myeloid gene grn1 (D) and the phagocytic B-cell marker immunoglobulin light ι constant 1-s1 (igic1s1) with the myeloid gene s100a10b (E), with myeloid genes in blue and lymphoid genes in green. Coexpression of the myeloid and lymphoid genes is represented in turquoise and indicated by red arrows in the WT and gata2b−/− feature analysis. Coloring threshold set in quantiles, with minimum cutoff of q10 and maximum cutoff of q90.
Gata2b-deficient HSPC1s show coexpression of myeloid and lymphoid gene expression programs. (A) Bar graph representing the percentage of WT HSPC1s in white and gata2b−/− HSPC1s in gray, with at least 1 read of s100a10b, grn1, colony stimulating factor 3b (csf3bs), CCAAT enhancer binding protein α (cebpa), lysozyme (lyz), or actin beta1 (actb1), indicating more cells with detectable myeloid gene expression in Gata2b-deficient HSPC1s. Coexpression analysis of the lymphoid gene igic1s1 with the myeloid gene cebpb (B) and the lymphoid gene ikzf1 (C) with the myeloid gene s100a10b. Values represent percentages of WT and gata2b−/− HSPC1s coexpressing myeloid and lymphoid genes (within the dashed box). WT and gata2b−/− feature analysis representing coexpression analysis of the lymphoid gene ighv1-4, with the myeloid gene grn1 (D) and the phagocytic B-cell marker immunoglobulin light ι constant 1-s1 (igic1s1) with the myeloid gene s100a10b (E), with myeloid genes in blue and lymphoid genes in green. Coexpression of the myeloid and lymphoid genes is represented in turquoise and indicated by red arrows in the WT and gata2b−/− feature analysis. Coloring threshold set in quantiles, with minimum cutoff of q10 and maximum cutoff of q90.
Discussion
In this study, we showed that the function of mammalian GATA2 in zebrafish is split between Gata2a and Gata2b. Gata2a is required for HE specification upstream of Gata2b. Gata2b is not vital for embryonic generation of HSPCs, but supports their expansion in CHT. However, during adulthood, Gata2b is required for the quiescent HSPC population, and in its absence, HSPCs are more proliferative. In addition, Gata2b-deficient KM from adult zebrafish showed a lymphoid bias at the expense of the myeloid lineage based on scatter profiles and transgenic marker analyses. Single-cell transcriptome analysis showed that the stem and progenitor cells were the origin of the increased lymphoid lineage output in gata2b−/− KM cells as a resul tof a failure to increase myeloid gene expression to sufficient levels and a subsequent coexpression of both myeloid and lymphoid genes in gata2b−/− HSPCs. These data establish that Gata2b is vital for maintaining the myeloid differentiation program while restricting lymphoid differentiation.
The molecular mechanism controlling lineage commitment has long been thought to be regulated by stochastic variations in the levels of transcription factors, and progenitors are committed to a lineage choice.59 However, later reports have suggested that some transcription factors have a reinforcing activity for terminal differentiation and have proposed that microenvironmental or upstream regulators are decisive in lineage commitment.60 This would suggest that when these reinforcing factors are removed, cells can redirect their lineage. Our results are consistent with Gata2b being required for stemness of HSCs. Single-cell transcriptome analysis showed a unique cluster of Gata2b-deficient cells with upregulation of genes related to proliferation, suggestive of a role for Gata2b in cell-cycle adaptation. The quiescent subcluster was almost entirely lost, and the CD41:GFPlow population showed increased proliferation. Loss of quiescence in HSPCs then increased the expression of commitment genes, resulting in cells coexpressing lymphoid and myeloid lineage markers as detected in gata2b−/− HSPCs, and Gata2b is therefore an essential cell-intrinsic regulator of lineage output in HSPCs.
In mice, GATA2 is also required for the maintenance of HSCs after they are generated.7 During embryonic hematopoiesis, the number and percentage of HSPCs are reduced because of reduced proliferation, but during adult stages, Gata2b-deficient HSCs as marked by CD41:GFPlow expression are not reduced, and proliferation is increased, probably responsible for the normalization in HSC numbers (Figures 4I-K and 5Q-R). We did not find upregulation of gata2a in these cells as a rescue mechanism (Figure 5M). Single-cell transcriptome analysis identified several HSPC populations with unique transcriptional signatures. Interestingly, the CD41:GFPlow-expressing cells were scattered among different HSPC populations. Transplantation data suggest that only a minority of these cells are bona fide HSCs.30,61 Because zebrafish are outbred, limiting dilution transplantation studies result in a gross underestimation of actual HSC numbers. This indicates that further research could provide us with a more stringent marker for HSCs in zebrafish. In Gata2b-deficient HSPC1s, the quiescent HSPC population is absent (Figure 5B-D). This could represent the true quiescent HSC population. Interestingly, this does not affect survival of zebrafish.
Myeloid lineage differentiation was not entirely abrogated in Gata2b-deficient zebrafish, and few intact neutrophils remained present. Also, the monocyte progenitor and cluster marked by mpeg1.1 were present in Gata2b-deficient KM. Previous studies have found that if neutrophil development is blocked, myeloid differentiation progresses toward monocytic lineage.56 In addition to an increase in monocytic progenitors, we also detected a redirection of lineage differentiation at a much earlier state, leading to increases in B-cell populations (Figure 3M; supplemental Figure 2J-K). This indicates that in Gata2b-deficient HSPCs, a reprogramming occurs both in immature cells to delineate lineage differentiation toward the lymphoid lineage and in the myeloid lineage to redirect the lineage to monocytes, again indicating separate functions for Gata2 in lineage differentiation. Interestingly, the number and percentage of plasma cells were reduced (Figure 4S). Along with the severe neutropenia, this is similar to conditions of patients with MonoMAC syndrome, which is characterized by neutropenia, monocytopenia, and dendritic cell– and B-cell lymphopenias.62-64 This syndrome is caused by haploinsufficiency of the GATA2 transcription factor. Despite the severe neutropenia, no infections were observed in Gata2b-deficient zebrafish, probably because of the SPF conditions of the animal facility.
In conclusion, we find that Gata2b is required for proliferation of the HSPC pool in CHT and vital for myeloid lineage differentiation in the adult, both in the HSPC compartment and for terminal differentiation. Loss of Gata2b consequently induces a differentiation diversion toward the lymphoid lineage.
Acknowledgments
The authors thank members of the E.d.P., I.P.T., Raaijmakers, and Schneider-Kramann laboratories for helpful discussions; Tom Cupedo (Erasmus MC) and Elaine Dzierzak (University of Edinburgh) for careful reading of the manuscript; and the Experimental Animal Facility of Erasmus MC for animal husbandry and the Erasmus Optical Imaging Center for confocal microscopy services. The visual abstract was created with BioRender.com.
This research was supported by the European Hematology Association (junior nonclinical research fellowship) (E.d.P.), the Dutch Cancer Foundation/Alpe d’HuZes (SK10321) (E.d.P.), the British Heart Foundation (BHF IBSR fellowship FS/13/50/30436) (R.M. and C.B.M.), the Wellcome Trust (PhD scholarship #WT102345/Z/13/Z) (T.D.), the Daniel den Hoed Foundation for support of the Cancer Genome Editing Center (I.P.T.), and the Josephine Nefkens Foundation for purchase of the Chromium (10× Genomics) (I.P.T.).
Authorship
Contribution: E.d.P., E.G., and C.K. conceived the study; E.G., C.K., H.d.L., J.Z., D.B., T.D., C.B.M., P.M.H.v.S., M.E.v.R., and E.B. performed experiments; E.G., C.K., M.d.J., R.H., C.B.M., R.M., K.J.G., and E.d.P. analyzed results; R.M., P.J.F., and I.P.T. provided resources; E.G., C.K., and E.d.P. wrote the manuscript; and I.P.T. revised the manuscript.
ORCID profiles: C.K., 0000-0002-9006-1135; J.Z., 0000-0001-6829-244X; M.d.J., 0000-0002-6145-6154; T.D., 0000-0002-7708-3188; R.M., 0000-0002-4223-8506.
Conflict-of-interest disclosure: The authors declare no competing financial interests.
Correspondence: Emma de Pater, Erasmus MC, Wijtemaweg 80, Rotterdam, 3015 CN, The Netherlands; e-mail: e.depater@erasmusmc.nl.

