

Page 2690: In Figure 1J, the y-axis label “Pixel intensity” should read “EHT events in 5 sp”. The corrected Figure 1J is shown below.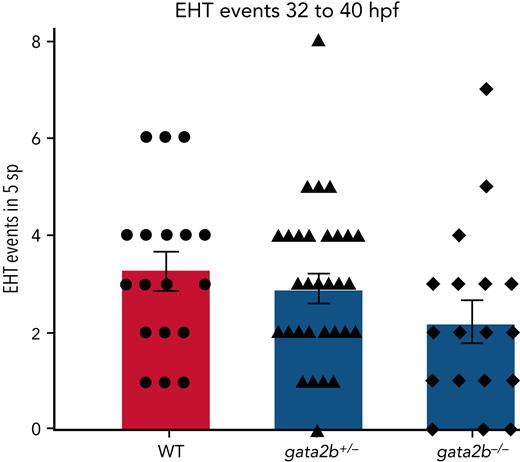

Page 2694: In Figure 4H, the bottom portion of the bar graph labeled gata2b−/− should be red, not blue. The corrected Figure 4H is shown below.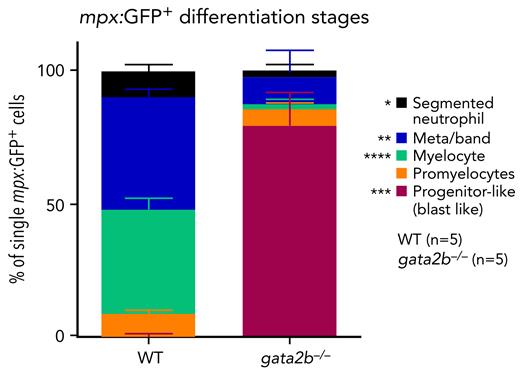

The publisher apologizes for the errors.

