

Key Points
NGS MRD detected after the first consolidation might provide better prognostic insight than the one after induction chemotherapy.
NGS MRD monitoring could help identify high-risk patients among those without detectable MRD by MFC after the first consolidation.

Abstract
Next-generation sequencing (NGS) has been applied to measurable/minimal residual disease (MRD) monitoring after induction chemotherapy in patients with acute myeloid leukemia (AML), but the optimal time point for the test remains unclear. In this study, we aimed to investigate the clinical significance of NGS MRD at 2 different time points. We performed targeted NGS of 54 genes in bone marrow cells serially obtained at diagnosis, first complete remission (first time point), and after the first consolidation chemotherapy (second time point) from 335 de novo AML patients. Excluding DNMT3A, TET2, and ASXL1 mutations, which are commonly present in individuals with clonal hematopoiesis of indeterminate potential, MRD could be detected in 46.4% of patients at the first time point (MRD1st), and 28.9% at the second time point (MRD2nd). The patients with detectable NGS MRD at either time point had a significantly higher cumulative incidence of relapse and shorter relapse-free survival and overall survival. In multivariate analysis, MRD1st and MRD2nd were both independent poor prognostic factors. However, the patients with positive MRD1st but negative MRD2nd had a similar good prognosis as those with negative MRD at both time points. The incorporation of multiparameter flow cytometry and NGS MRD revealed that the presence of NGS MRD predicted poorer prognosis among the patients without detectable MRD by multiparameter flow cytometry at the second time point but not the first time point. In conclusion, the presence of NGS MRD, especially after the first consolidation therapy, can help predict the clinical outcome of AML patients.
Introduction
A majority of acute myeloid leukemia (AML) patients can achieve cytomorphologic complete remission (CR); however, ∼50% eventually relapse, which indicates the presence of measurable/minimal residual disease (MRD) that escapes the detection of conventional morphologic examination.1,2 The detection of MRD by multiparameter flow cytometry (MFC)3 or quantitative polymerase chain reaction (PCR)4 has been recognized as an independent prognostic factor in AML patients.2,5 Persistent high or rising levels of MRD after an initial response in sequential analyses invariably predict a relapse.6 MRD monitoring provides a more real-time, individualized prediction of survival for AML patients.7-10
Next-generation sequencing (NGS) can simultaneously detect various mutations and be applied to most AML patients, but the clinical implications of its use in MRD monitoring requires further clarification. Recently, it was shown that NGS MRD of mutants other than the common mutations in clonal hematopoiesis of indeterminate potential (CHIP), including DNMT3A, TET2, and ASXL1 (DTA) mutations, after induction chemotherapy carried a prognostic impact on relapse rate and overall survival (OS) of AML patients, and their presence either before or after allogeneic hematopoietic stem cell transplantation (HSCT) could significantly predict prognosis.11-14 The European LeukemiaNet (ELN) MRD working group has recommended optimal time points for MRD monitoring via MFC and PCR for different molecular targets.2 For example, the most important time point for MRD monitoring of PML-RARA15 or RUNX1-RUNX1T116 using real-time quantitative PCR is reportedly at the end of consolidation treatment and that for the NPM110 mutant is after 2 cycles of chemotherapy.2 The proper time point for NGS MRD detection after treatment still requires clarification. We hypothesized that the detection of NGS MRD at different time points might have different prognostic impacts and clinical implications. Thus, we aimed to explore the clinical significance of NGS MRD at CR1 after induction chemotherapy and after the first consolidation chemotherapy. We found that the NGS MRD at the above time points were both independent prognostic factors in AML patients. Furthermore, we found that the model of MRD at the second time point had a higher area under the curve (AUC) than that of MRD at the first time point for the 5-year cumulative incidence of relapse (CIR), relapse-free survival (RFS), and OS. NGS MRD at the second time point might be a potential marker to guide AML treatment.
Materials and methods
Patients and samples
We recruited 335 adult patients newly diagnosed with de novo non-M3 AML at the National Taiwan University Hospital with adequate cryopreserved bone marrow (BM) specimens. AML was diagnosed according to the 2016 World Health Organization (WHO) criteria.17 Patients with antecedent cytopenia, hematologic disease, or therapy-related AML were excluded. This retrospective study was approved by the National Taiwan University Hospital Research Ethics Committee, and written informed consents were obtained from all participants in accordance with the Declaration of Helsinki. All patients achieved a morphologic CR, defined by the 2017 ELN recommendation,18 after standard induction chemotherapy and received 2 to 4 courses of postremission chemotherapy with high-dose cytarabine with or without anthracycline.19 The patients who achieved CR with incomplete hematologic recovery were not included. The choice of allogeneic HSCT was based on chromosomal findings, age, availability of donors, and response to induction treatment, evaluated by morphologic observation and MFC examination, which is a routine test in our institute. The pre-HSCT status was defined by cytomorphologic evaluation. NGS MRD analysis results were made unavailable to physicians to avoid bias in the choice of consolidation options. The median follow-up time of this cohort was 8.8 years (range, 0.3-23.3 years).
Gene mutation, cytogenetics, and flow cytometry analyses
We analyzed 1,005 BM samples serially collected at diagnosis, first CR after induction chemotherapy (first time point for MRD analysis), and after the first consolidation chemotherapy (second time point). We used the TruSight myeloid sequencing panel and HiSeq platform (Illumina, San Diego, CA) to survey mutations in 54 genes related to myeloid malignancies (supplemental Table 1). Library preparation and sequencing were performed according to the manufacturer’s instructions. The median reading depth was 10 550×. We used COSMIC database version 86, dbSNP version 151, ClinVar, PolyPhen-2, and SIFT to evaluate the consequence of every variant. The detailed variant analysis algorithm for diagnostic samples was described previously,20 and the minimum variant allele frequency (VAF) for diagnostic samples was 5%. As shown in previous studies,11,13 all variants detected at diagnosis were compiled to determine their background VAF error levels. The variant-specific error level was determined in all samples obtained from patients not carrying the specific variant at diagnosis. Variants with VAF more than mean background error plus 2 standard deviations of background error were selected for MRD analysis (supplemental Table 2). Because of the sequencing sensitivity issue, we excluded CEBPA mutations and FLT3-ITD in subsequent MRD analyses. The mutational status of these 2 genes at diagnosis was analyzed using previously described methods.21
Statistical analysis
To evaluate the clinical robustness of prognostic models contributed by either the first or second MRD, we randomly divided the cohort into the training (80%) and validation (20%) sets. To minimize the bias introduced during this procedure, the division process was performed repeatedly 1000 times; 1000 AUC values of the MRD1st model, derived from the time-dependent receiver operating characteristic curve,25 were compared with the other 1000 AUC values of the MRD2nd model, using the paired Student t test in the validation cohort. The model construction process and other statistical methods are thoroughly described in supplemental Materials.
Results
Prognostic impact of detectable MRD attributable to DNMT3A, TET2, and ASXL1 (DTA) mutations, the most common CHIP-related gene mutations
Among 335 patients, 303 (90.4%) had at least 1 gene mutation (supplemental Figure 1A), with a median of 2.0 mutations (range, 1-6) per patient. CHIP-related gene mutations reportedly had little prognostic impact as MRD targets.11,13,14 We evaluated whether this was also true for our cohort. Among the 303 patients initially carrying gene mutations, the VAF values for MRD attributable to DTA mutations were much higher than values for other mutations (supplemental Figure 1B). Patients with MRD attributable only to DTA mutations at the first and second time point had similar CIR (supplemental Figure 2A-B, respectively) and RFS (supplemental Figure 2C-D, respectively) as those without MRD, and had better outcomes than those with non-DTA MRD. However, patients with only DTA MRD had worse OS than those without MRD but similar to those with non-DTA MRD (supplemental Figure 2E-F). This could be attributed to the older age of patients with only DTA MRD compared with that of those without MRD (median age, 47.7 vs 38.0 years, P = .001 at the first time point; median age 49.0 vs 38.0 years, P < .001 at the second time point). This resulted in less tolerability for them to receive aggressive salvage therapy after relapse. In multivariate Cox proportional hazards regression analysis, after considering age and other important clinical factors, patients with only DTA mutations at the first and second time points, respectively, were shown to have similar CIR, RFS, and OS values as those without MRD (supplemental Tables 3 and 4, respectively). Thus, we excluded DTA mutations in the following analyses regarding clinical implications of MRD. Furthermore, the patients harboring only DTA mutations at diagnosis were considered to be uninformative for MRD assessment and were excluded (n = 12).
MRD at CR1 and after first consolidation chemotherapy
After excluding DTA mutations, 135 (46.4%) patients had NGS MRD at the 1st time point, with VAFs ranging from 0.07% to 43.57%, and 84 (28.9%) had NGS MRD at the 2nd time point, with VAFs ranging from 0.09% to 37.39%.
Association of NGS MRD with clinical features and outcomes
Patients with detectable MRD at either the first or second time points were significantly older and more frequently harbored RUNX1 mutations but less commonly inv(16) and CEBPA double mutations (supplemental Table 5). Patients with detectable MRD at either time point had a higher CIR (P < .001; Figure 1A), shorter RFS (median 1.4 years v. not reached [NR], P < .001; Figure 1B), and poorer OS (median 4.4 years vs NR, P < .001; Figure 1C). In multivariate Cox proportional hazards regression analysis, after incorporating age, white blood cell counts (WBC) at diagnosis, cycles of induction chemotherapy to attain CR, HSCT at CR1, and the 2017 ELN risk groups, detectable MRD was an independent prognostic factor for CIR (hazard ratio [HR], 2.036; 95% confidence interval [CI], 1.426-2.909; P < .001), RFS (HR, 1.875; 95% CI, 1.350-2.604; P < .001), and OS (HR, 1.614; 95% CI, 1.117-2.332; P = .011; supplemental Table 6).
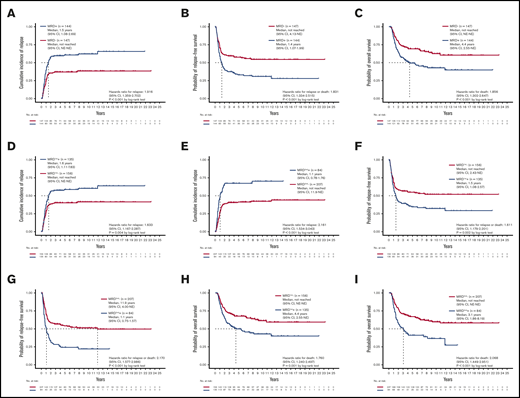
Prognostic impact of NGS MRD. (A-C) The CIR, RFS, and OS of patients stratified by the MRD status, detected at either the first or second time point. Patients with detectable MRD had significantly poorer outcomes than those without MRD. (D-I) The CIR, RFS, and OS of patients stratified by the MRD status at the first (D,F,H) and second time points (E,G,I). The difference in outcome remained significant at both time points. NE, not estimated.
Prognostic impact of NGS MRD. (A-C) The CIR, RFS, and OS of patients stratified by the MRD status, detected at either the first or second time point. Patients with detectable MRD had significantly poorer outcomes than those without MRD. (D-I) The CIR, RFS, and OS of patients stratified by the MRD status at the first (D,F,H) and second time points (E,G,I). The difference in outcome remained significant at both time points. NE, not estimated.
We speculated that the detection of NGS MRD at different time points might yield different prognostic values. To clarify the effects of sequential MRD, we classified MRD to that detected at the first time point (denoted as MRD1st) and that at the second time point (MRD2nd). The detectable MRD1st and MRD2nd were both positively associated with older age (both P = .001; Table 1) and higher relapse rate (P = .003 and < 0.001, respectively) but negatively associated with inv(16) (P = .036 and 0.046, respectively) and CEBPA double mutations (P = .004 and 0.022, respectively). Patients with detectable MRD1st and MRD2nd, respectively, had a higher CIR (P = .004, Figure 1D; and < 0.001, Figure 1E, respectively), shorter RFS (median 1.5 years vs NR, P = .002, Figure 1F; and median 1.1 vs 11.9 years, P < .001, Figure 1G, respectively), and poorer OS (median, 4.4 years vs NR, P = .001, Figure 1H; and median 3.1 years vs NR, P < .001, Figure 1I, respectively) compared with patients without MRD.
Comparison of clinical characteristics between AML patients with positive and negative MRD at first and second time points
| Variables | MRD1st− (n = 156, 53.6%) | MRD1st+ (n = 135, 46.4%) | P | MRD2nd− (n = 207, 71.1%) | MRD2nd+ (n = 84, 28.9%) | P |
|---|---|---|---|---|---|---|
| Sex* | .724 | .518 | ||||
| Male | 85 (54.5) | 70 (51.9) | 113 (54.6) | 42 (50.0) | ||
| Female | 71 (45.5) | 65 (48.1) | 94 (45.4) | 42 (50.0) | ||
| Age, y† | 41 (15-72) | 50 (16-84) | .001 | 43 (15-76) | 53 (16-84) | .001 |
| Laboratory data† | ||||||
| WBCs, ×103/μL | 24.89 (0.86-380.18) | 19.04 (0.76-387.40) | .064 | 24.73 (0.86-387.40) | 18.49 (0.76-248.00) | .153 |
| Hb, g/dL | 8.1 (3.4-15.0) | 8.4 (3.7-14.2) | .162 | 8.2 (3.4-15.0) | 8.4 (4.2-14.2) | .276 |
| Platelets, ×103/μL | 43 (6-712) | 46 (5-514) | .387 | 45 (5-712) | 46 (5-305) | .840 |
| Peripheral blood blasts/μL | 12 330 (0-342 162) | 7523 (0-371 904) | .023 | 10 632 (0-371 940) | 7715 (0-220 720) | .105 |
| LDH, U/L | 799 (182-8693) | 673 (129-7734) | .142 | 782 (137-8693) | 687 (129-7747) | .296 |
| FAB* | ||||||
| M0 | 1 (0.6) | 6 (4.4) | .052 | 2 (1.0) | 5 (6.0) | .023 |
| M1 | 47 (30.1) | 31 (23.0) | .186 | 56 (27.1) | 22 (26.2) | >.999 |
| M2 | 60 (38.5) | 58 (43.0) | .473 | 82 (39.6) | 36 (42.9) | .693 |
| M4 | 38 (24.4) | 35 (25.9) | .787 | 53 (25.6) | 20 (23.8) | .881 |
| M5 | 10 (6.4) | 5 (3.7) | .427 | 14 (6.8) | 1 (1.2) | .075 |
| 2016 WHO Classification* | ||||||
| AML with t(8;21)(q22;q22.1) | 20 (12.8) | 14 (10.4) | .585 | 27 (13.0) | 7 (8.3) | .317 |
| AML with inv(16)(p13.1q22) or t(16;16)(p13.1;q22) | 13 (8.3) | 3 (2.2) | .036 | 15 (6.8) | 1 (1.2) | .046 |
| AML with t(9;11)(p21.3;q23.3) | 5 (3.2) | 1 (0.7) | .221 | 5 (2.3) | 1 (1.2) | .677 |
| AML with t(6;9)(p23;q34.1) | 3 (1.9) | 1 (0.7) | .626 | 3 (1.4) | 1 (1.2) | >.999 |
| AML with inv(3)(q21.3q26.2) or t(3;3)(q21.3;q26.2) | 0 (0) | 2 (1.5) | .214 | 0 (0) | 2 (2.4) | .083 |
| AML with mutated NPM1 | 25 (16.0) | 36 (26.7) | .030 | 43 (20.8) | 18 (21.4) | .875 |
| AML with biallelic mutations of CEBPA | 35 (22.4) | 13 (9.6) | .004 | 41 (19.8) | 7 (8.3) | .022 |
| Provisional: AML with mutated RUNX1 | 6 (3.8) | 12 (8.9) | .089 | 9 (4.1) | 9 (10.7) | .058 |
| AML with myelodysplasia-related changes | 5 (3.2) | 6 (4.4) | .760 | 5 (2.4) | 6 (7.1) | .084 |
| AML, NOS | ||||||
| AML with minimal differentiation | 0 (0) | 4 (3.0) | .045 | 1 (0.5) | 3 (3.6) | .074 |
| AML without maturation | 15 (9.6) | 11 (8.1) | .686 | 18 (8.7) | 8 (9.5) | .823 |
| AML with maturation | 17 (10.1) | 21 (15.6) | .296 | 23 (11.1) | 13 (15.5) | .328 |
| Acute myelomonocytic leukemia | 11 (7.1) | 10 (7.4) | >.999 | 13 (6.3) | 8 (9.5) | .327 |
| Acute monoblastic/monocytic leukemia | 3 (1.9) | 1 (0.7) | .626 | 4 (1.9) | 0 (0) | .328 |
| Cytogenetic risk*‡ | ||||||
| Favorable | 33 (21.2) | 17 (13.0) | .069 | 42 (20.5) | 8 (9.8) | .030 |
| Intermediate | 117 (75.0) | 104 (79.4) | .379 | 158 (77.1) | 63 (76.8) | .965 |
| Unfavorable | 6 (3.8) | 10 (7.6) | .164 | 5 (2.4) | 11 (13.4) | <.001 |
| 2017 ELN riskstratification* | ||||||
| Favorable | 85 (54.5) | 60 (44.4) | .100 | 117 (56.5) | 28 (33.3) | <.001 |
| Intermediate | 45 (28.8) | 41 (30.4) | .798 | 57 (27.5) | 29 (34.5) | .258 |
| Unfavorable | 26 (16.7) | 34 (25.2) | .082 | 33 (15.9) | 27 (32.1) | .004 |
| Number of cycle(s) to attain CR* | .779 | .063 | ||||
| One cycle | 120 (76.9) | 106 (78.5) | 167 (80.7) | 59 (70.2) | ||
| Two cycles | 36 (23.1) | 29 (21.5) | 40 (19.3) | 25 (29.8) | ||
| HSCT at CR1* | 35 (22.4) | 32 (23.7) | .889 | 45 (21.7) | 22 (26.2) | .444 |
| Relapse* | 61 (39.1) | 77 (57.0) | .003 | 83 (40.1) | 55 (65.5) | <.001 |
The MRD positivity and negativity are evaluated after excluding DTA mutations. FAB, French-American-British classification; Hb, hemoglobin; LDH, lactate dehydrogenase; NOS, not otherwise specified; PR, partial remission.
Number of patients (%).
Median (range).
According to the refined Medical Research Council criteria. Cytogenetics data were not available for 4 patients.
In univariate Cox regression analysis, MRD detected either at the first or second time point that 2017 ELN risk stratification, age, cycles to attain CR, and HSCT at CR1 were all significant prognostic factors for CIR, RFS, and OS (supplemental Figure 3A-C). In multivariate Cox proportional hazards regression, after incorporating factors with prognostic significance in univariate analysis, MRD1st was an independent prognostic factor for CIR (HR, 1.739; 95% CI, 1.223-2.473; P = .002), RFS (HR, 1.656; 95% CI, 1.196-2.294; P = .002), and OS (HR, 1.545; 95% CI, 1.068-2.233; P = .021; Table 2). MRD2nd was an even stronger independent prognostic factor for CIR (HR, 2.206; 95% CI, 1.525-3.190; P < .001), RFS (HR, 2.142; 95% CI, 1.520-3.018; P < .001), and OS (HR, 1.649; 95% CI, 1.133-2.399; P = .009), with higher HRs and lower P values compared with those for MRD1st (Table 3).
Multivariate Cox proportional hazards regression analyses focusing on the MRD1st
| Variables | CIR | RFS | OS | |||||||||
|---|---|---|---|---|---|---|---|---|---|---|---|---|
| HR | Lower | Upper | P | HR | Lower | Upper | P | HR | Lower | Upper | P | |
| Age* | 0.998 | 0.987 | 1.009 | .703 | 0.999 | 0.989 | 1.010 | .889 | 1.012 | 1.000 | 1.024 | .048 |
| WBC counts,* ×103/μL | 1.004 | 1.001 | 1.007 | .003 | 1.003 | 1.001 | 1.006 | .007 | 1.003 | 1.000 | 1.006 | .029 |
| ELN risk stratification | ||||||||||||
| Intermediate vs favorable | 2.114 | 1.409 | 3.172 | <.001 | 2.156 | 1.475 | 3.151 | <.001 | 2.534 | 1.641 | 3.913 | <.001 |
| Adverse vs favorable | 2.583 | 1.621 | 4.116 | <.001 | 2.628 | 1.704 | 4.052 | <.001 | 2.816 | 1.738 | 4.565 | <.001 |
| Number of induction chemotherapy cycles† | 1.597 | 1.058 | 2.412 | .026 | 1.560 | 1.068 | 2.279 | .021 | 1.501 | 1.004 | 2.244 | .048 |
| HSCT at CR1‡ | 0.206 | 0.118 | 0.360 | <.001 | 0.293 | 0.183 | 0.467 | <.001 | 0.568 | 0.353 | 0.912 | .019 |
| MRD1st§ | 1.739 | 1.223 | 2.473 | .002 | 1.656 | 1.196 | 2.294 | .002 | 1.545 | 1.068 | 2.233 | .021 |
Continuous variables.
Two cycles vs 1 cycle.
HSCT at CR1 vs HSCT at other disease status or without HSCT.
MRD positivity vs negativity at the first time point. The MRD positivity and negativity are evaluated after excluding DTA mutations.
Multivariate Cox proportional hazards regression analyses focusing on the MRD2nd
| Variables | CIR | RFS | OS | |||||||||
|---|---|---|---|---|---|---|---|---|---|---|---|---|
| HR | Lower | Upper | P | HR | Lower | Upper | P | HR | Lower | Upper | P | |
| Age* | 0.995 | 0.984 | 1.007 | .425 | 0.997 | 0.986 | 1.007 | .561 | 1.012 | 1.000 | 1.024 | .051 |
| WBC counts,* ×103/μL | 1.004 | 1.001 | 1.007 | .004 | 1.003 | 1.001 | 1.006 | .011 | 1.003 | 1.000 | 1.006 | .044 |
| ELN risk stratification | ||||||||||||
| Intermediate vs favorable | 1.990 | 1.322 | 2.995 | .001 | 2.034 | 1.388 | 2.980 | <.001 | 2.478 | 1.603 | 3.831 | <.001 |
| Adverse vs favorable | 2.361 | 1.477 | 3.773 | <.001 | 2.416 | 1.564 | 3.734 | <.001 | 2.712 | 1.676 | 4.387 | <.001 |
| Number of induction chemotherapy cycles† | 1.500 | 1.002 | 2.244 | .049 | 1.497 | 1.032 | 2.172 | .034 | 1.465 | 0.984 | 2.185 | .060 |
| HSCT at CR1‡ | 0.202 | 0.116 | 0.53 | <.001 | 0.286 | 0.180 | 0.455 | <.001 | 0.578 | 0.362 | 0.922 | .021 |
| MRD2nd§ | 2.206 | 1.525 | 3.190 | <.001 | 2.142 | 1.520 | 3.018 | <.001 | 1.649 | 1.133 | 2.399 | .009 |
Continuous variables.
Two cycles vs 1 cycle.
HSCT at CR1 vs HSCT at other disease status or without HSCT.
MRD positivity vs negativity at the second time point. The MRD positivity and negativity are evaluated after excluding DTA mutations.
We formulated 2 MRD models, using MRD1st or MRD2nd and factors with independent prognostic values in multivariate analyses, encompassing the WBC count at diagnosis, 2017 ELN risk classification, induction chemotherapy cycles for attaining CR, and HSCT at CR1, and applied the time-dependent area under ROC to compare prognostic values between these models. We divided the cohort into the training and validation sets. In the validation set, we observed that the AUC values, calculated via the formulation derived from the training set, were significantly higher for 5-year CIR (P = 1.4E-6), RFS (P < 2.2E-16), and OS (P = 7.5E-15) in the second MRD prognostic model than in the first MRD model. Furthermore, the AUC distinction remained significant for CIR, RFS, and OS at 6 months, 12 months, and 2 years, respectively; for example, P < 2.2E-16 for CIR at 6 months, P = 8.9E-13 for CIR at 12 months, and P = 2.2E-10 for CIR at 2 years.
Prognostic impact of serial NGS MRD
Here, we evaluated the association of different statuses of MRD at the first and second time points with clinical outcomes (Table 4). In summary, 147 (50.5%) patients had no MRD at both the first and second time points (denoted as MRD1st−MRD2nd−); 60 (20.6%) patients had MRD at the first time point but became MRD negative at the second time point (MRD1st+MRD2nd−); 9 (3.1%) patients had no MRD at the first time point but became MRD positive at the second time point (MRD1st−MRD2nd+); and 75 (25.8%) patients had MRD at both the first and second time points (MRD1st+MRD2nd+). Among MRD1st-negative patients, 94.2% (147 of 156) remained MRD2nd negative, whereas 44.4% of MRD1st-positive patients were MRD2nd negative after receiving 1 cycle of standard consolidation chemotherapy (supplemental Figure 1A).
Comparison of clinical characteristics among AML patients with different statuses of MRD1st and MRD2nd
| Variables | Total (n = 291) | MRD1st−MRD2nd− (n = 147, 50.5%) | MRD1st+MRD2nd− (n = 60, 20.6%) | MRD1st−MRD2nd+ (n = 9, 3.1%) | MRD1st+MRD2nd+ (n = 75, 25.8%) | P |
|---|---|---|---|---|---|---|
| Sex* | .589 | |||||
| Male | 155 (53.3) | 82 (55.8) | 31 (51.7) | 3 (33.3) | 39 (52.0) | |
| Female | 136 (46.7) | 65 (44.2) | 29 (48.3) | 6 (66.7) | 36 (48.0) | |
| Age, y† | 45 (15-84) | 41 (15-72) | 46 (16-76) | 39 (35-65) | 54 (16-84) | .001 |
| Laboratory data† | ||||||
| WBCs, ×103/μL | 22.935 (0.76-387.40) | 25.37 (0.86-380.18) | 23.065 (0.86-387.40) | 20.125 (1.86-248.00) | 18.49 (0.76-195.27) | .153 |
| Hb, g/dL | 8.3 (3.4-15.0) | 8.2 (3.4-15.0) | 8.2 (3.7-14.0) | 7.5 (5.7-10.1) | 8.6 (4.2-14.2) | .276 |
| Platelets, ×103/μL | 45 (5-712) | 43 (6-712) | 50 (5-514) | 57 (7-144) | 42 (5-305) | .840 |
| Peripheral blood blasts/μL | 9959 (0-371 904) | 11 400 (0-342 162) | 7879 (0-371 904) | 11 458 (577-220 720) | 7524 (0-152 562) | .105 |
| LDH, U/L | 751 (129-8693) | 761 (182-8693) | 837 (137-5559) | 1020 (793-7747) | 585 (129-7 734) | .296 |
| FAB* | ||||||
| M0 | 7 (2.4) | 1 (0.7) | 1 (1.7) | 0 (0) | 5 (6.7) | .045 |
| M1 | 78 (26.8) | 42 (28.6) | 14 (23.3) | 5 (55.6) | 17 (22.7) | .168 |
| M2 | 118 (40.5) | 58 (39.5) | 24 (40.0) | 2 (22.2) | 34 (45.3) | .563 |
| M4 | 73 (25.1) | 36 (24.5) | 17 (28.3) | 2 (22.2) | 18 (24.0) | .930 |
| M5 | 15 (5.2) | 10 (6.8) | 4 (6.7) | 0 (0) | 1 (1.3) | .281 |
| 2016 WHO Classification* | ||||||
| AML with t(8;21)(q22;q22.1) | 34 (11.7) | 17 (11.6) | 10 (16.7) | 3 (33.3) | 4 (5.3) | .037 |
| AML with inv(16)(p13.1q22) or t(16;16)(p13.1;q22) | 16 (5.5) | 13 (8.8) | 2 (3.3) | 0 (0) | 1 (1.3) | .081 |
| AML with t(9;11)(p21.3;q23.3) | 6 (2.1) | 5 (3.4) | 0 (0) | 0 (0) | 1 (1.3) | .398 |
| AML with t(6;9)(p23;q34.1) | 4 (1.4) | 3 (2.0) | 0 (0) | 0 (0) | 1 (1.3) | .695 |
| AML with inv(3)(q21.3q26.2) or t(3;3)(q21.3;q26.2) | 2 (0.7) | 0 (0) | 0 (0) | 0 (0) | 2 (2.7) | .122 |
| AML with mutated NPM1 | 61 (21.0) | 25 (17.0) | 18 (30.0) | 0 (0) | 18 (24.0) | .067 |
| AML with biallelic mutations of CEBPA | 48 (16.5) | 34 (23.1) | 7 (11.7) | 1 (11.1) | 6 (8.0) | .020 |
| Provisional: AML with mutated RUNX1 | 18 (6.2) | 5 (3.4) | 4 (6.7) | 1 (11.1) | 8 (10.7) | .175 |
| AML with myelodysplasia-related changes | 11 (3.8) | 4 (2.7) | 1 (1.7) | 1 (11.1) | 5 (6.7) | .237 |
| AML, NOS | ||||||
| AML with minimal differentiation | 4 (1.4) | 0 (0) | 1 (1.7) | 0 (0) | 3 (4.0) | .110 |
| AML without maturation | 26 (8.9) | 13 (8.8) | 5 (8.3) | 2 (22.2) | 6 (8.0) | .560 |
| AML with maturation | 36 (12.4) | 15 (10.2) | 8 (13.3) | 0 (0) | 13 (17.3) | .300 |
| Acute myelomonocytic leukemia | 21 (7.2) | 10 (6.8) | 3 (5.0) | 1 (11.1) | 7 (9.3) | .757 |
| Acute monoblastic/monocytic leukemia | 4 (1.4) | 3 (2.0) | 1 (1.7) | 0 (0) | 0 (0) | .639 |
| Cytogeneticrisk*‡ | ||||||
| Favorable | 50 (17.2) | 30 (20.4) | 12 (20.7) | 3 (33.3) | 5 (6.8) | .035 |
| Intermediate | 221 (75.9) | 112 (76.2) | 46 (79.3) | 5 (55.6) | 58 (79.5) | .421 |
| Unfavorable | 16 (5.5) | 5 (3.4) | 0 (0) | 1 (11.1) | 10 (13.7) | .002 |
| 2017 ELN riskstratification* | ||||||
| Favorable | 145 (49.8) | 81 (55.1) | 36 (60.0) | 4 (44.4) | 24 (32.0) | .003 |
| Intermediate | 86 (29.6) | 42 (28.6) | 15 (25.0) | 3 (33.3) | 26 (34.7) | .644 |
| Unfavorable | 60 (20.6) | 24 (16.3) | 9 (15.0) | 2 (22.2) | 25 (33.3) | .017 |
| Number of cycle(s) to attain CR* | .080 | |||||
| One cycle | 226 (77.7) | 115 (78.2) | 52 (86.7) | 5 (55.6) | 54 (72.0) | |
| Two cycles | 65 (22.3) | 32 (21.8) | 8 (13.3) | 4 (44.4) | 21 (28.0) | |
| HSCT at CR1* | 67 (23.0) | 33 (22.4) | 12 (20.0) | 2 (22.2) | 20 (26.7) | .825 |
| Relapse* | 138 (47.4) | 53 (36.1) | 30 (50.0) | 8 (88.9) | 47 (62.7) | <.001 |
The MRD positivity and negativity are evaluated after excluding DTA mutations. The percentage may not sum to 100 because of rounding. See Table 1 for abbreviations.
Number of patients (%).
Median (range).
According to refined Medical Research Council criteria. Cytogenetics data were available for 287 patients.
With regard to clinical outcomes, the MRD2nd− patients, regardless of the MRD1st status (either MRD1st− or MRD1st+), had a lower CIR (Figure 2A) and longer RFS (Figure 2B) and OS (Figure 2C) than MRD2nd+ patients. The MRD1st−MRD2nd+ and MRD1st+MRD2nd+ patients had similar dismal outcomes with regard to CIR (P = .119), RFS (P = .204), and OS (P = .808). However, MRD1st+ patients had a good prognosis similar to that of MRD1st−MRD2nd− patients once they could achieve MRD2nd− (P = .140 for CIR, 0.231 for RFS, and 0.188 for OS, respectively; Figure 2A-C), and had significantly better outcomes than MRD1st+MRD2nd+ patients in terms of CIR (P = .032), RFS (P = .009), and OS (P = .031). In the multivariate Cox proportional hazards regression model, MRD2nd+ patients had a poorer prognosis, regardless of their MRD1st status (Table 5). These findings also suggested that MRD2nd might have stronger prognostic impact than MRD1st.
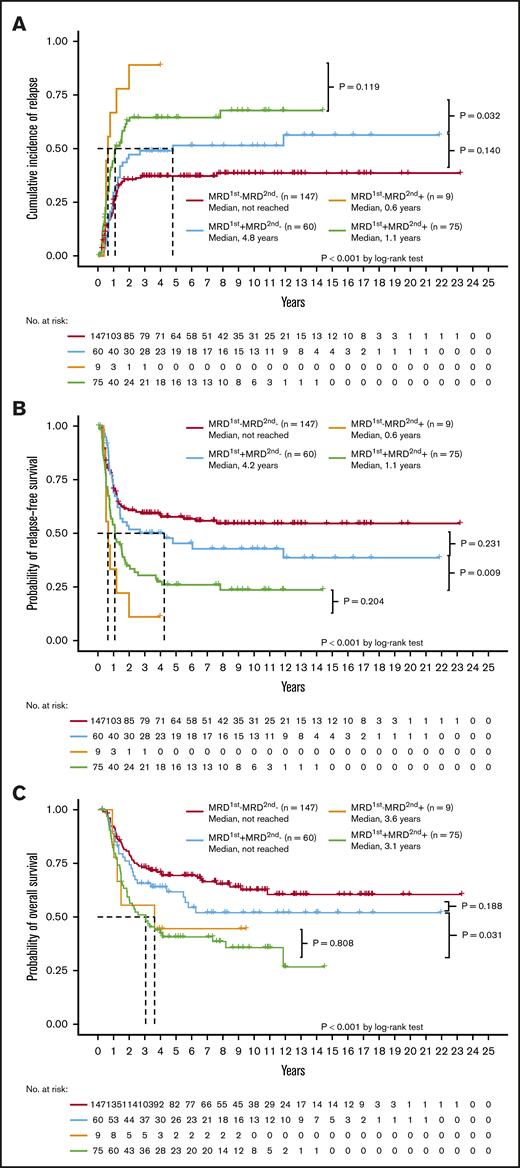
Prognostic significance of different statuses of NGS MRD at the first and second time points. The Kaplan-Meier curves stratified by the NGS MRD status for CIR (A), RFS (B), and OS (C). The MRD2nd− patients, either MRD1st− or MRD1st+, had a better outcome than MRD2nd+ patients. The MRD1st−MRD2nd+ and MRD1st+MRD2nd+ patients had a similar dismal prognosis, whereas MRD1st+MRD2nd− patients had a good prognosis similar to that of MRD1st−MRD2nd− patients.
Prognostic significance of different statuses of NGS MRD at the first and second time points. The Kaplan-Meier curves stratified by the NGS MRD status for CIR (A), RFS (B), and OS (C). The MRD2nd− patients, either MRD1st− or MRD1st+, had a better outcome than MRD2nd+ patients. The MRD1st−MRD2nd+ and MRD1st+MRD2nd+ patients had a similar dismal prognosis, whereas MRD1st+MRD2nd− patients had a good prognosis similar to that of MRD1st−MRD2nd− patients.
Multivariate Cox proportional hazards regression analyses focusing on the status of MRD detected at first and second time points
| Variables | CIR | RFS | OS | |||||||||
|---|---|---|---|---|---|---|---|---|---|---|---|---|
| HR | Lower | Upper | P | HR | Lower | Upper | P | HR | Lower | Upper | P | |
| Age* | 0.996 | 0.985 | 1.008 | .535 | 0.998 | 0.987 | 1.008 | .654 | 1.011 | 0.999 | 1.023 | .074 |
| WBC counts* | 1.004 | 1.001 | 1.007 | .004 | 1.003 | 1.001 | 1.006 | .010 | 1.003 | 1.000 | 1.006 | .039 |
| ELN riskstratification | ||||||||||||
| Intermediate vs favorable | 2.047 | 1.357 | 3.086 | .001 | 2.065 | 1.407 | 3.030 | <.001 | 2.475 | 1.596 | 3.837 | <.001 |
| Adverse vs favorable | 2.419 | 1.510 | 3.875 | <.001 | 2.455 | 1.586 | 3.799 | <.001 | 2.722 | 1.678 | 4.416 | <.001 |
| Number of induction chemotherapy cycles† | 1.502 | 0.990 | 2.278 | .056 | 1.490 | 1.017 | 2.185 | .041 | 1.476 | 0.984 | 2.213 | .060 |
| HSCT at CR1‡ | 0.196 | 0.112 | 0.344 | <.001 | 0.280 | 0.175 | 0.448 | <.001 | 0.562 | 0.350 | 0.902 | .017 |
| MRD status§ | ||||||||||||
| MRD1st+MRD2nd− | 1.544 | 0.981 | 2.431 | .061 | 1.393 | 0.911 | 2.129 | .126 | 1.355 | 0.871 | 2.183 | .212 |
| MRD1st−MRD2nd+ | 4.018 | 1.868 | 8.642 | <.001 | 3.373 | 1.584 | 7.185 | .002 | 1.777 | 0.697 | 4.529 | .228 |
| MRD1st+MRD2nd+ | 2.354 | 1.536 | 3.606 | <.001 | 2.259 | 1.527 | 3.343 | <.001 | 1.828 | 1.189 | 2.811 | .006 |
Continuous variables.
Two cycles vs 1 cycle.
HSCT at CR1 vs HSCT at other disease status or without HSCT.
§Reference is MRD1st−MRD2nd−.
Integration of NGS MRD and MFC MRD
Here, we evaluated the feasibility of incorporating NGS MRD into the current MFC MRD platform, which is a routine test in our institute. We included a subgroup of 121 patients, who had both MFC and NGS MRD studies of simultaneously obtained BM cells in the analysis. At the first time point, 70 (57.9%) patients had concordant MFC and NGS results, 46 (38.0%) had NGS MRD but no MFC MRD, and the remaining 5 (4.1%) had MFC MRD but no NGS MRD. At the second time point, 94 (77.7%) patients had concordant MFC and NGS results, 25 (20.7%) had NGS MRD but no MFC MRD, and the remaining 2 (1.7%) had MFC MRD but no NGS MRD. The mutation profile of patients with flow MRD but no NGS MRD is listed in supplemental Table 7.
We further analyzed the implication of detectable NGS MRD in patients without MFC MRD. At the second time point, the presence of NGS MRD predicted a significant higher CIR (P = .030; supplemental Figure 4A), poorer RFS (P = .010; supplemental Figure 4B), and a trend of shorter OS (P = .113; supplemental Figure 4C) among patients without MFC MRD, indicating that detection of NGS MRD at the second time point could enable the identification of patients with worse outcomes, even though they did not have MFC MRD. On the contrary, at the first time point, NGS MRD showed no impact on CIR (P = .090), RFS (P = .075), and OS (P = .170) among patients without MFC MRD.
Prognostic impact of HSCT at CR1 based on NGS MRD status
We found that performing HSCT at CR1 could improve the prognosis of patients with MRD2nd with regard to CIR, nonrelapse mortality, and OS but not for those with MRD1st (supplemental Figure 5A-F). On the contrary, MRD negativity could identify patients who did not benefit from HSCT. For patients without NGS MRD at either the first or second time points, HSCT at CR1 could not provide survival benefit in the total cohort (supplemental Figure 6A-B), the 2017 ELN classification-defined intermediate-risk patients (supplemental Figure 7A-B), and the favorable-risk patients (supplemental Figure 8A-B).
Discussion
All studies regarding NGS MRD have focused on MRD at only 1 time point. To the best of our knowledge, this is the first study to monitor MRD via NGS at 2 different time points in AML patients. We found that after the first consolidation (second time point), the NGS MRD status had a stronger prognostic impact than that at CR1 after induction chemotherapy (first time point). This was supported by the fact that the AUC of the second MRD model was greater than that of the first model for CIR, RFS, and OS, at 5 years, 2 years, 12 months, and 6 months after the tests, respectively. Furthermore, at the second time point, but not the first time point, NGS MRD could help identify a group of patients with worse outcomes among patients without detectable MRD by MFC (supplemental Figure 4A-C). Because MRD1st+MRD2nd− patients did as well as MRD1st−MRD2nd− patients (Table 5; Figure 2A-C), it might not be necessary to alter treatment strategies when patients achieved cytomorphologic CR1 but had MRD, as determined by NGS, after induction chemotherapy. However, more aggressive treatment is indicated for patients with MRD, as determined by NGS, after the first consolidation chemotherapy, even though MRD was undetectable via MFC.
It is challenging to perform standardization while using NGS to evaluate MRD. Here, we uniformly used BM as the sample source because the detection of MRD in peripheral blood seems less sensitive than in BM,26,27 especially when patients are in hematologic remission.2,28 Additionally, some prior studies recruited a heterogeneous patient population with de novo, secondary, and therapy-related AML and high-risk myelodysplastic syndrome for MRD monitoring via NGS.11,13,14 However, we excluded patients with antecedent cytopenia, hematologic disease, or therapy-related AML, because de novo and secondary AML patients have distinct leukemogenesis, molecular features, and diverse responses to treatment.29 The results of this study can thus truly reflect the situation of patients with this disease entity. Besides, we enrolled patients uniformly treated with standard induction and consolidation chemotherapy.
Standardization analysis is another important issue in applying NGS for MRD monitoring. Differences in panels used for test genes, NGS platforms, and analysis pipelines would lead to different sensitivity and specificity levels. To minimize false interpretations, various methods were used in prior studies, including background noise level calculation,11,13 threshold establishment through sensitivity analysis,12 and relatively high threshold settings.14,30 Here, we used a thoroughly validated and widely adopted gene sequencing panel. Furthermore, we computed the background noise of every specific variant from all patient samples without the specific variant at diagnosis to diminish the potential bias.11,13 To further confirm the prognostic significance of NGS MRD at 2 time points, we also analyzed the MRD determined via NGS by setting the VAF threshold12 at 0.3%, after a robust sensitivity test (described in the supplemental Methods). The NGS MRD results based on the 0.3% threshold in the training cohort of 174 patients (randomly selected from the total cohort of 291 patients) showed that MRD2nd had a stronger prognostic impact than MRD1st (supplemental Figure 9A-I), which was similar to results obtained by calculating background noise levels, as shown in Results. These findings were further verified in an independent validation cohort with 117 patients (supplemental Figure 10A-I). The advancement of sequencing technology and bioinformatics truly opens a door for MRD monitoring in hematologic diseases, including AML. Nevertheless, it remains challenging to maintain concordant and reproducible results while applying broadly in clinical practice. With the help of delicate platforms and sophisticated analyses as shown above, the current study provides a scientifically solid observation that the presence of NGS MRD, especially after the first consolidation therapy, can help predict clinical outcomes of AML patients.
Other than DTA mutations, SRSF2 and IDH2 mutations in 2 patients (UPN 71 and 199; supplemental Table 8), respectively, were probably CHIP mutations because the VAF of these 2 mutations were high and did not change during the course, but the impact of NGS MRD on the outcome remained the same if we removed these 2 patients from the cohort in the analyses, including multivariate analyses.
The choice of HSCT is another potential bias in interpreting the clinical significance of NGS MRD. In our cohort, there was no difference in the proportion of patients receiving HSCT at CR1 among subgroups with different MRD statuses (Table 1). Moreover, during multivariate analysis, in which HSCT status was incorporated as a variable, NGS MRD was still an independent prognostic factor. To further ameliorate the influence of HSCT on clinical outcomes, we analyzed the prognostic impact of NGS MRD status with survival censored on the day of HSCT, and the prognostic value of NGS MRD was validated (supplemental Figures 11A-I and 12A-C). Furthermore, we did multivariate analyses using HSCT as a time-dependent variable, and the MRD1st or MRD2nd remained independent prognostic factors (data not shown).
It was noteworthy that patients without MRD1st or MRD2nd had a relapse rate of ∼40%. This could probably be explained by that we used the targeted gene panel to monitor MRD, which might cause clonal evolution in genes not in the panel to be overlooked. Although MRD monitoring using whole-exome or whole-genome sequencing would lessen the chances of new molecular alterations being missed during follow-up, these techniques cannot provide enough coverage to ensure high sensitivity. Another chance to improve the outcome prediction might be the use of a more sensitive assay, such as the error-corrected sequencing or droplet digital PCR. Moreover, considering the retrospective nature of this study, further prospective studies are needed to obtain more unbiased results that would provide insight into the possibility of pre-emptive treatment.
Conclusion
Here we demonstrated that the detection of MRD via NGS after the first consolidation might provide better prognostic insight than that after induction chemotherapy. The combination of NGS and MFC for MRD monitoring could help identify high-risk patients among those without detectable MRD by MFC at the second time point. After the first consolidation, NGS MRD might act as an effective marker that could guide AML treatment. Further prospective and intervention trials are warranted to validate these findings.
The raw sequencing reads have been deposited in the NCBI Sequence Read Archive (SRA; accession no. SRP313307) and BioProject (accession no. PRJNA719439). For other inquiries, please contact the corresponding author at hftien@ntu.edu.tw.
Acknowledgments
The authors acknowledge the service provided by the DNA Sequencing Core of the First Core Laboratory, National Taiwan University, College of Medicine.
This study was funded by Grants MOST 104-2314-B-002-128-MY4 and 106-2314-B-002-226-MY3 from the Ministry of Science and Technology (Taiwan) and Grant MOHW 107-TDU-B-211-114009 from the Ministry of Health and Welfare (Taiwan).
Authorship
Contribution: C.-H.T. was responsible for data management and interpretation, statistical analysis, bioinformatics analysis, and manuscript writing; J.-L.T., F.-M.T., C.-C.L., M.-F.H., M.-C.Y., and W.-C.C. contributed clinical data and/or patient samples; M.-H.T., Y.-L.P., Y.-K.C., M.-C.L., and C.-W.L. performed the gene mutation and cytogenetic studies; Y.-Y.K. and L.-I.L. were responsible for mutation analysis and interpretation; D.-C.W. and C.-Y.C. contributed to the bioinformatics and statistical analysis; and H.-A.H. and H.-F.T. designed, planned, and coordinated the study over the entire period and wrote the manuscript.
Conflict-of-interest disclosure: H.-F.T., W.-C.C., and H.-A.H. received research funding from Celgene. The remaining authors declare no competing financial interests.
Correspondence: Hwei-Fang Tien, Department of Internal Medicine, National Taiwan University Hospital, No. 7, Chung Shan S. Rd, Zhongzheng District, Taipei City 10002, Taiwan; e-mail: hftien@ntu.edu.tw; and Hsin-An Hou, Department of Internal Medicine, National Taiwan University Hospital, No. 7, Chung Shan S. Rd, Zhongzheng District, Taipei City 10002, Taiwan; e-mail: hsinanhou@ntu.edu.tw.

