

Key Points
Inv(3) places a distal GATA2 enhancer proximal to EVI1, inducing expression in hematopoietic stem/progenitor cells and megakaryocytes.
Inv(3)-driven EVI1 expression plus Gata2 haploinsufficiency promotes megakaryocyte-lineage skewing and leukemogenesis.

Abstract
Chromosomal rearrangements between 3q21 and 3q26 elicit high-risk acute myeloid leukemia (AML), which is often associated with elevated platelet and megakaryocyte (Mk) numbers. The 3q rearrangements reposition a GATA2 enhancer near the EVI1 (or MECOM) locus, which results in both EVI1 overexpression and GATA2 haploinsufficiency. However, the mechanisms explaining how the misexpression of these 2 genes individually contribute to leukemogenesis are unknown. To clarify the characteristics of differentiation defects caused by EVI1 and GATA2 misexpression and to identify the cellular origin of leukemic cells, we generated a system to monitor both inv(3) allele-driven EVI1 and Gata2 expression in 3q-rearranged AML model mice. A cell population in which both EVI1 and Gata2 were highly induced appeared in the bone marrows before the onset of frank leukemia. This population had acquired serial colony-forming potential. Because hematopoietic stem/progenitor cells (HSPCs) and Mks were enriched in this peculiar population, we analyzed the independent EVI1 and GATA2 contributions to HSPC and Mk. We found that inv(3)-driven EVI1 promotes accumulation of Mk-biased and myeloid-biased progenitors, Mks, and platelets, and that Gata2 heterozygous deletion enhanced Mk-lineage skewing of EVI1-expressing progenitors. Notably, inv(3)-directed EVI1 expression and Gata2 haploinsufficient expression cooperatively provoke a leukemia characterized by abundant Mks and platelets. These hematological features of the mouse model phenocopy those observed in human 3q AML. On the basis of these results, we conclude that inv(3)-driven EVI1 expression in HSPCs and Mks collaborates with Gata2 haploinsufficiency to provoke Mk-lineage skewing and leukemogenesis with excessive platelets, thus mimicking an important feature of human AML.
Introduction
Chromosomal translocation and inversion between 3q21 and 3q26 [t(3;3)(q21.3;q26.2) and inv(3)(q21.3q26.2), respectively] are observed in 1% to 2% of acute myeloid leukemias (AMLs), as well as in myelodysplastic syndrome (MDS).1-4 Patients with AML and MDS with 3q rearrangements have a poor prognosis.5,6 In AML cells harboring the 3q-rearranged allele, 2 genes, EVI1 (also known as MECOM) and GATA2, are misexpressed by repositioning the GATA2 distal hematopoietic enhancer (G2DHE) from the GATA2 locus on 3q21 close to the EVI1 locus on 3q26.7-9 Although EVI1 gene expression is induced after acquiring G2DHE, GATA2 expression is diminished by half because of the loss of G2DHE on 1 chromosome. Mechanisms underlying the leukemogenesis provoked by EVI1 and GATA2 misexpression remain to be clarified.
3q rearrangements are observed in several types of AML in which AML without maturation, acute monocytic leukemia, and/or acute megakaryocytic leukemia are frequently observed.10,11 Whereas the blasts in patients with AML bearing 3q rearrangements are morphologically variable, dysplastic nonblast cells, especially megakaryocytes (Mks), are frequently observed. In addition, 7% to 22% of the patients with 3q AML show thrombocythemia11,12 ; giant and hypogranular platelets and bare Mk nuclei appear in their peripheral blood.13 On the basis of these observations, it has been recognized that these 3q AML and MDS are associated with megakaryocytic abnormalities. In this regard, to clarify mechanisms of leukemogenesis and related pathologies, several EVI1-overexpressing mouse models have been established.14-17 However, none of the established mouse models recapitulates the megakaryocytic phenotypes that are often observed in patients with 3q AML. Therefore, development of new, more accurate models is required to address how EVI1 and GATA2 misexpression individually affect megakaryopoiesis, and to determine how either or both contribute to the poor prognosis of patients with 3q AML.
To elucidate the mechanism of leukemogenesis associated with 3q rearrangements, we previously generated 3q21q26-EVI1 mice harboring a transgene that recapitulates the human inv(3)(q21q26) allele.9 This transgene contains a 196-kbp linked bacterial artificial chromosome (BAC) recombinant bearing the EVI1 gene and the Gata2 enhancer G2DHE.9 In 3q21q26 mice, the human EVI1 gene driven by G2DHE is highly expressed in hematopoietic stem and progenitor cells (HSPCs). These mice develop leukemia in which B220+c-Kit+Gr1– blast-like cells have leukemia-initiating capacity and differentiate into Gr1+ myeloid leukemia cells (myeloid-differentiated leukemia), indicating that G2DHE-driven EVI1 overexpression provokes leukemia.18
In these transgenics, the endogenous murine Gata2 alleles are both intact, and therefore Gata2 expression did not decrease in the 3q21q26-EVI1 mice, as it does naturally in 3q AML. To examine the possible effects of the loss of 1 Gata2 allele on leukemia development, we crossed the 3q21q26-EVI1 mice to Gata2 heterozygous germ-line knockout (Gata2+/gfp) mice to recapitulate Gata2 haploinsufficiency.18 Gata2 heterozygous deletion hastened leukemia onset in the 3q21q26 mice.18 In these compound mutants, B220+c-Kit+Gr1– blast-like cells failed to differentiate into myeloid cells and developed leukemia in which blasts had expanded (undifferentiated leukemia), showing that Gata2 haploinsufficiency accelerates EVI1-driven leukemogenesis. However, approximately 30% of the 3q21q26-EVI1::Gata2+/gfp mice developed leukemia that was classified as neither the undifferentiated nor the myeloid-differentiated type.
To probe the cellular basis for leukemogenesis associated with 3q-rearrangements, we attempted to define a discrete cell population from which the leukemic cells originate before the onset of frank leukemia. To do so, we generated a dual reporter system that enabled monitoring of both inv(3) allele-derived EVI1 and endogenous Gata2 expression. This strategy revealed a distinct candidate cell population for the origin of leukemia in which both EVI1 and Gata2 were highly induced. Because HSPC and Mks were enriched in this population, we analyzed the individual and combinatorial functions of EVI1 overexpression and Gata2 haploinsufficiency. The data show that inv(3)-driven EVI1 expression promotes the expansion of erythroid- and Mk-biased, as well as myeloid-biased, progenitors. Reduced Gata2 expression enhanced EVI1-driven Mk-lineage skewing. Of note, 24% of the 3q21q26-EVI1::Gata2+/gfp mice developed leukemia associated with elevated Mks and platelets, indicating that coordinated EVI1 and Gata2 misexpression provoked a leukemia that exhibits similar features to human 3q AML cells. We conclude that inv(3)-driven EVI1 overexpression coupled to GATA2 misexpression promotes HSPC accumulation and Mk-lineage skewing and results in myeloid leukemia with high platelets.
Methods
Generation of 3q21q26-tdTomato-targeting fragment
We generated a targeting fragment containing tdTomato gene and an ampicillin-resistance (Amp) gene cassette flanked by Frt sequences (FrtAmp). The tdTomato gene and polyA signal were inserted between BamHI and EcoRV sites in pBluescript2-SK vector to generate tdTomato-polyA/pBS-SK plasmid. The FrtAmp fragment was generated by polymerase chain reaction (PCR), using pFrtAmp plasmid19 as a template with the following primer set: TomatoFrtAmp(f) and TomatoFrtAmp(r) (supplemental Table 1). The FrtAmp fragment was inserted into a SalI site of tdTomato-polyA/pBS-SK plasmid by homolog recombination, using In-Fusion HD cloning kit (Clontech) to generate tdTomato-polyA-FrtAmp/pBS plasmid. The 3q21q26-tdTomato targeting fragment was generated by PCR, using tdTomato-polyA-FrtAmp/pBS plasmid as a template, with the following primer set: 3q21q26tdTomato(f) and 3q21q26tdTomato(r) (supplemental Table 1). PCR was performed using PrimeSTAR Max DNA polymerase (Takara). PCR products were gel-purified by Gel Extraction Kit (Qiagen).
Generation of the 3q21q26-tdTomato BAC clone
To generate the 3q21q26-tdTomato BAC clone, we modified the 3q21q26-EVI1 BAC clone that removed the Amp and neomycin-resistance (Neo) gene, as described previously.9 We used homologous recombination to insert the tdTomato gene into the translation start site of the EVI1 gene in the 3q21q26-EVI1 BAC clone. BAC recombination was performed as described previously.19,20 The EL250 strain of Escherichia coli was used for Flp recombinase induction.19 The strain was prepared for homologous recombination with the addition of a 15-minute induction period in a 42°C shaking water bath before harvest. BAC DNA and targeting constructs were transformed into the strain by electroporation at 1.8 kV, 25 μF, and 200 W, using a Gene Pulser (Bio-Rad). For drug selection, the antibiotics chloramphenicol and ampicillin were added to Luria-Bertani (LB) broth at a concentration of 25 μg/mL and 100 μg/mL, respectively. To remove the Amp gene, Flp recombinase was induced by supplementing arabinose to LB broth. BAC DNA was purified using a Nucleo-bond BAC DNA preparation kit (Macherey-Nagel). Purified BAC DNA was transformed into DH10B strain without Flp recombinase by electroporation.
Validation of the 3q21q26-tdTomato BAC clone
We verified the homolog recombination by Southern blot analysis (supplemental Figure 1A-B). BAC DNA was digested with restriction enzymes (BamHI or EcoRI), electrophoresed, and transferred to a nylon membrane. The membrane was reacted with DNA probe that was digoxigenin labeled, using digoxigenin DNA Labeling and Detection Kit (Roche), subsequently reacted with alkaline phosphatase–labeled anti-digoxigenin antibody and visualized using nitro blue tetrazolium-5-bromo-4-chloro-3-indolyl-phosphate (NBT-BCIP) substrate. PCR products with a primer set 5′-TTCCAGGCAGGATTCAACTC-3′ and 5′-TGGTGACAAATGGAAAGCTG-3′, using 3q21q26 BAC as a template, were used as a probe (supplemental Figure 1A, orange box). Flp-mediated recombination was confirmed by PCR and sequencing.
Generation of 3q21q26-tdTomato BAC transgenic mice
BAC DNA was linearized by PI-SceI digestion and then purified by phenol-chloroform extraction and ethanol precipitation. Linearized BAC constructs were injected into BDF1 fertilized eggs. The transgenic mice were backcrossed with C57BL/6 mice more than 8 times. Genotypes were determined by PCR with a primer set for the transgene (5′-CCTGTACGGCATGGACGAGC-3′ and 5′-AGTGGCCAGATGTCAAACCA-3′). Copy numbers of the transgenes were determined by quantitative PCR (qPCR) with a primer set for the human and mouse EVI1 7th exon (5′-ACAAGCCAAGACCAGCCCCTGG-3′ and 5′-TGGTTTTTTCGAGGCTCAGTC-3′).
Mice
Flow cytometry and cell sorting
Mononuclear cells were isolated from bone marrows, using Histopaque-1083 (Sigma-Aldrich), following the protocol provided by the manufacturer. The bone marrow cells were stained with sets of antibodies, as described in supplemental Methods. Antibodies used for flow cytometric analyses are described in supplemental Table 2. Propidium iodide (1 μg/mL; Nacalai Tesque) was used to remove dead cells. Analyses and cell sorting were performed using FACSVerse and FACSAria II (BD Biosciences). Data were analyzed using FlowJo software (BD Biosciences). To calculate absolute cell number of each population, we counted cell numbers of bone marrows in 2 femora and tibiae, and multiplied cell numbers and frequencies of each cell type together.
Hematological analysis
Hematological indices were measured using an automatic blood cell analyzer Celltac α (Nihon Kohden). Hemogram profiles were examined by Wright-Giemsa staining. Cytospin preparations of the cells (1 × 10⁴ cells) were made using a Shandon Cytospin3 centrifuge (Thermo Electron Corp.).
RNA extraction and quantitative RT-PCR
Total RNA was extracted with Sepazol RNA I Super G reagent (Nacalai Tesque) and reverse-transcribed with ReverTra Ace qPCR RT Kit (Toyobo) according to the manufacturer’s instructions. The resulting cDNA was used as a template for quantitative RT-PCR, using TaqMan or SYBR Green with a QuantStudio 6 Real-time PCR analyzer (Thermo Fisher Scientific). Primers for the other genes are described in supplemental Table 3.
Colony-forming assays
Sorted cells were plated in methylcellulose-based medium with recombinant mouse stem cell factor, mouse interleukin 3, human interleukin 6, and human erythropoietin (MethoCult GF M3434, StemCell Technologies) at a concentration of 100 cells/mL. Colonies were scored after 7 days of incubation. For replating experiments, the whole culture cells were pooled on day 7 and washed twice, and 1000 cells were subjected to subsequent culture in the same medium. Scoring for colonies and replating were repeated every 7 days.
Disease-free survival curve
A humane endpoint of leukemia onset was defined at white blood cell counts in the peripheral blood higher than 5 × 10⁴/μL, and the animals were euthanized when they reached this clinical stage. The periods from birth to the day of leukemia onset were analyzed, and disease-free survival curves were determined using the Kaplan-Meier method. For survival curves of primary leukemia-developing mice, we collected 10 μL peripheral blood from the tail vain and counted white blood cells as well as red blood cells and platelets, using an automatic blood cell analyzer Celltac α (Nihon Kohden). The log-rank statistic was used to test whether the survival distributions differed between groups.
Transplantation analysis
Sorted cells (5 × 10⁴ cells) derived from CD45.1 homozygous or CD45.1/CD45.2 heterozygous mice were injected into the tail vein of sublethally (6 Gy) irradiated CD45.2 homozygous C57BL/6 mice 6 to 7 weeks old, using Gammacell 40 Exactor (MDS Nordion). We traced the differentiation of transplanted cells by means of CD45.1 and CD45.2 marker detection.
Results
Generation of a reporter mouse that monitors inv(3) allele-driven EVI1 expression
To identify the progenitor population in which leukemic cells originate, we monitored concomitant EVI1 expression driven by inv(3) allele at the same time as endogenous GATA2 expression in the bone marrow before leukemia onset. To specifically monitor the inv(3) allele-driven EVI1 expression profile, we generated a new reporter transgenic mouse line, using the 3q21q26-EVI1 BAC clone that recapitulates the genomic alterations in the 196-kb inv(3) allele9 (Figure 1A). To this end, we introduced a tdTomato reporter gene into the translational start site of the EVI1 gene in exon 3 of the 3q21q26-EVI1 parental BAC clone by homologous recombination (Figure 1A; supplemental Figure 1A). We confirmed correct recombination of tdTomato within the BAC clone by Southern blotting and DNA sequence analysis (supplemental Figure 1A-B). We injected the recombinant BAC into fertilized eggs and generated 3 lines (lines A, B, and C) of BAC reporter transgenic mice (3q21q26-tdTomato mice). Copy numbers of the integrated transgenes were determined by qPCR, which revealed that the mice retained between 2 and 5 copies of the transgenes (supplemental Figure 1C). Unless noted otherwise, we used line A, harboring 3 copies of the transgene, which faithfully recapitulated EVI1 gene expression driven by the inv(3) allele (see next section).

An EVI1 plus Gata2 High population has replicative potential. (A) Structures of the inv(3) allele, the 3q21q26-EVI1 BAC, and the 3q21q26-tdTomato BAC. In the 3q21q26-tdTomato BAC, a tdTomato reporter gene was introduced at the translation start site of the EVI1 gene in the parental 3q21q26-EVI1 BAC. (B) Dual-reporter mouse to monitor the effects of inv(3)-driven EVI1 and endogenous Gata2 expression by tdTomato and green fluorescent protein (GFP) fluorescence, respectively. (C) Representative flow cytometric profiles of bone marrow cells recovered from Gata2+/gfp::Tom or 3q21q26-EVI1::Gata2+/gfp::Tom mice. (D) Relative intensities of tdTomato (left) and GFP (right) fluorescence in High, Low, and Negative sorted populations (C). The average values for the High population in Gata2+/gfp::Tom mice was set as 1. (E) Relative mRNA levels of transgenic human plus endogenous mouse EVI1 (left) and mouse endogenous Gata2 mRNA (right). mRNA abundance was normalized to glyceraldehyde-3-phosphate dehydrogenase mRNA. The average values for the High population in Gata2+/gfp::Tom mice was set as 1. (F) Absolute number of High, Low, and Negative cells in Gata2 haploinsufficient mice either containing or lacking the 3q21q26-EVI1 BAC. (G) Percentages of “High” population cells in the bone marrows of Gata2+/gfp::Tom and 3q21q26-EVI1::Gata2+/gfp::Tom mice. (H) Colony-forming potential of High, Low, and Negative populations of Gata2+/gfp::Tom and 3q21q26-EVI1::Gata2+/gfp::Tom mice. Note that the EVI1-/Gata2-High population has high colony-forming potential, and that EVI1 overexpression alone confers serial replating potential on the High cell population. (I) Percentages of High population cells in primary and subsequent passage colonies derived from High populations of Gata2+/gfp::Tom and 3q21q26-EVI1::Gata2+/gfp::Tom mice. Values represent the means ± standard deviations (SDs). *P < .05; **P < .01 (unpaired Student t test). n.s., not significant.
An EVI1 plus Gata2 High population has replicative potential. (A) Structures of the inv(3) allele, the 3q21q26-EVI1 BAC, and the 3q21q26-tdTomato BAC. In the 3q21q26-tdTomato BAC, a tdTomato reporter gene was introduced at the translation start site of the EVI1 gene in the parental 3q21q26-EVI1 BAC. (B) Dual-reporter mouse to monitor the effects of inv(3)-driven EVI1 and endogenous Gata2 expression by tdTomato and green fluorescent protein (GFP) fluorescence, respectively. (C) Representative flow cytometric profiles of bone marrow cells recovered from Gata2+/gfp::Tom or 3q21q26-EVI1::Gata2+/gfp::Tom mice. (D) Relative intensities of tdTomato (left) and GFP (right) fluorescence in High, Low, and Negative sorted populations (C). The average values for the High population in Gata2+/gfp::Tom mice was set as 1. (E) Relative mRNA levels of transgenic human plus endogenous mouse EVI1 (left) and mouse endogenous Gata2 mRNA (right). mRNA abundance was normalized to glyceraldehyde-3-phosphate dehydrogenase mRNA. The average values for the High population in Gata2+/gfp::Tom mice was set as 1. (F) Absolute number of High, Low, and Negative cells in Gata2 haploinsufficient mice either containing or lacking the 3q21q26-EVI1 BAC. (G) Percentages of “High” population cells in the bone marrows of Gata2+/gfp::Tom and 3q21q26-EVI1::Gata2+/gfp::Tom mice. (H) Colony-forming potential of High, Low, and Negative populations of Gata2+/gfp::Tom and 3q21q26-EVI1::Gata2+/gfp::Tom mice. Note that the EVI1-/Gata2-High population has high colony-forming potential, and that EVI1 overexpression alone confers serial replating potential on the High cell population. (I) Percentages of High population cells in primary and subsequent passage colonies derived from High populations of Gata2+/gfp::Tom and 3q21q26-EVI1::Gata2+/gfp::Tom mice. Values represent the means ± standard deviations (SDs). *P < .05; **P < .01 (unpaired Student t test). n.s., not significant.
To examine whether the 3q21q26-tdTomato transgene affects hematopoiesis, we analyzed the lineage–c-Kit+Sca1+ (LSK) fraction of bone marrow cells in wild-type (WT), 3q21q26-tdTomato, 3q21q26-EVI1, and 3q21q26-EVI1::3q21q26-tdTomato mice, as accumulation of LSK cells is the most prominent signature of 3q21q26-EVI1 mice.9 We found that the percentages of LSK cells were comparable between WT and 3q21q26-tdTomato mice and between 3q21q26-EVI1 and 3q21q26-EVI1::3q21q26-tdTomato mice (supplemental Figure 2A-B). In contrast, the percentage of LSK cells was highly increased in 3q21q26-EVI1 and 3q21q26-EVI1::3q21q26-tdTomato mice when compared with WT or 3q21q26-tdTomato mice. These results indicate that the 3q21q26-tdTomato transgene hardly affects hematopoiesis.
3q21q26-tdTomato and Gata2-GFP reporters identify an EVI1-/Gata2-High population
To monitor the expression levels of both inv(3) allele-driven EVI1 and endogenous Gata2 simultaneously in bone marrow cells, we crossed the 3q21q26-tdTomato mice into the heterozygous Gata2-GFP knock-in background21 (Gata2+/gfp mice) and obtained Gata2+/gfp::3q21q26-tdTomato mice (hereafter Gata2+/gfp::Tom mice; Figure 1B, left). In the Gata2+/gfp mice, the GFP gene is inserted into the translation start site in the second exon of Gata2, and therefore GFP is expressed instead of Gata2.21 To analyze the effects of EVI1 gene overexpression, we further crossed the Gata2+/gfp::Tom mice to 3q21q26-EVI1 mice and obtained 3q21q26-EVI1::Gata2+/gfp::Tom mice (Figure 1B, right).
We analyzed tdTomato and GFP fluorescence in bone marrows of 12-week-old Gata2+/gfp::Tom and 3q21q26-EVI1::Gata2+/gfp::Tom triple-mutant mice. We observed a positive correlation between tdTomato and GFP expression in both lines of mice before leukemia onset, indicating that inv(3)-driven EVI1 gene expression correlates positively with endogenous Gata2 (Figure 1C). Moreover, we found that tdTomato and GFP highly double-positive cells were a distinct population in the bone marrows of both Gata2+/gfp::Tom and 3q21q26-EVI1::Gata2+/gfp::Tom mice. Therefore, we fractionated these bone marrow cells into High, Low, and Negative populations on the basis of the intensity of tdTomato and GFP fluorescence (Figure 1C). Intensity of tdTomato and GFP in each population was comparable between Gata2+/gfp::Tom and 3q21q26-EVI1::Gata2+/gfp::Tom mice except for the tdTomato signal in the High population, suggesting that inv(3)-driven EVI1 did not substantially affect tdTomato and GFP intensities (Figure 1D). Total EVI1 (endogenous Evi1 gene plus human EVI1 transgene) and Gata2 mRNA levels in the High population were higher than those in Low and Negative populations, both in Gata2+/gfp::Tom and 3q21q26-EVI1::Gata2+/gfp::Tom mice, indicating that tdTomato and GFP fluorescence accurately reflected EVI1 and Gata2 gene expression, respectively (Figure 1E).
The absolute cell numbers of Negative, Low, and High populations all increased in the 3q21q26-EVI1::Gata2+/gfp::Tom mice compared with those in the Gata2+/gfp::Tom mice (Figure 1F). Importantly, the frequency of the High population in the 3q21q26-EVI1::Gata2+/gfp::Tom mice increased significantly in comparison with the Gata2+/gfp::Tom mice (Figure 1G). Based on these results, we hypothesized that the EVI1 expression might confer a proliferative advantage on the High population.
The High population of EVI1-expressing mice has sequential replicative potential
To examine the replicative capacities of each progenitor cell population, we performed colony assays on sorted High, Low, and Negative cell populations (Figure 1C) in the presence of stem cell factor, interleukin 3, interleukin 6, and erythropoietin. We detected an enormous increase in colony numbers in the High population of both Gata2+/gfp::Tom and 3q21q26-EVI1::Gata2+/gfp::Tom mice (1st colonies; Figure 1H). Therefore, to ascertain whether these cells retained serial cell division capacity, we performed replating analyses using cells from the High population colonies. We found that the High population of 3q21q26-EVI1::Gata2+/gfp::Tom mice had sequential colony-forming ability for at least 3 additional rounds of replating (blue bars in second, third, and fourth colonies; Figure 1H), whereas only a very small number of colonies were generated after replating primary clones from the equivalent population of Gata2+/gfp::Tom mice (a green bar in second colonies; Figure 1H). These results indicate that the EVI1-/Gata2-High population has high colony-forming potential, and implies that EVI1 overexpression confers serial passage ability on the High cell population.
To examine how many High-population cells emerge in the second to fourth colonies after replating, we performed flow cytometric analysis of cells recovered from the High population colonies. We found that the percentage of High cells in the 3q21q26-EVI1::Gata2+/gfp::Tom colonies maintained at approximately 70% from the second to the fourth replated generation, whereas the percentage of High population cells was approximately 50% in the primary assay (Figure 1I). The reason for the increase of High cells in the subsequent replating colonies is unknown. In contrast, the percentage of High cells was about 30% in the primary colony assay of the Gata2+/gfp::Tom mice (Figure 1I), but these cells essentially lost replating capacity thereafter. These results indicate that EVI1 overexpression contributes to the proliferative capacity of High-population cells. On the basis of these results, we hypothesized that the High population of the 3q21q26-EVI1::Gata2+/gfp::Tom cells might harbor the parental preleukemic cells.
To examine the contribution of Gata2 haploinsufficiency alone to colony-forming potential, we isolated tdTomato-high (T-High) cells instead of the double (GFP/Tom) positive High population by using tdTomato fluorescence and side scatter from WT::Tom, Gata2+/gfp::Tom, 3q21q26-EVI1::Tom, and 3q21q26-EVI1::Gata2+/gfp::Tom mice (supplemental Figure 3A). We found that 41.3% ± 7.7% and 62.9% ± 5.7% of the T-High population were in the High population of Gata2+/gfp or 3q21q26-EVI1::Gata2+/gfp mice, respectively. The colony-formation potential and the percentage of High cells were comparable between WT::Tom and Gata2+/gfp::Tom mice and between 3q21q26-EVI1::Tom and 3q21q26-EVI1::Gata2+/gfp::Tom mice, suggesting that any additional effects of Gata2 heterozygous loss were undetectable in this experiment (supplemental Figure 3B-C).
EVI1-/Gata2-High population contains HSPC and Mks
To examine which cell types are found in the High population of the 3q21q26-EVI1::Gata2+/gfp::Tom and Gata2+/gfp::Tom mice, we next examined the expression of typical hematopoietic cell surface markers in High and Negative/Low populations by flow cytometry. Notably, we found that Mk-lineage cells (CD41+CD61+) were highly enriched in the High population of both Gata2+/gfp::Tom and 3q21q26-EVI1::Gata2+/gfp::Tom mice (Figure 2A,F; supplemental Figure 4A). In contrast, neutrophils (CD3–B220–Ly6G+), B cells (B220+CD19+), and erythroid cells (CD71+Ter119+) were found predominantly in the Negative/Low populations in both Gata2+/gfp::Tom and 3q21q26-EVI1::Gata2+/gfp::Tom mice (Figure 2B-D,F; supplemental Figure 4B-D). Monocytes (CD3–B220–CD115+) were also predominantly found in the Negative/Low (especially Low) populations (Figure 2B,F; supplemental Figure 4B). Notably, c-Kit+ HSPCs were highly enriched in the High population in both lines of mice (Figure 2E; supplemental Figure 4E). These results indicate that the EVI1-/Gata2-High population contains HSPCs and Mks both in the presence and the absence of inv(3)-driven EVI1 (Figure 2H). These results also indicate that the inv(3) regulatory region containing G2DHE has the potential to induce the tdTomato reporter gene in Mk, even in the absence of inv(3)-driven EVI1 expression.
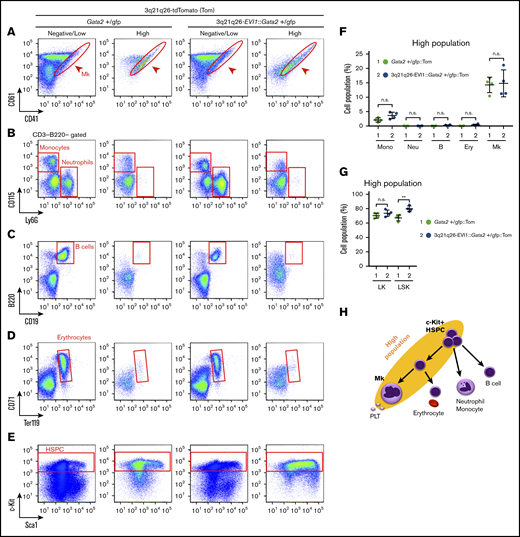
EVI1 plus Gata2 High fraction contains HSPC and Mks. (A-E) Representative flow cytometric profiles of High and Low/Negative populations in Gata2+/gfp::Tom and 3q21q26-EVI1::Gata2+/gfp::Tom mouse bone marrows. Red circles and boxes in each panel represent populations of Mk cells (A), monocytes and neutrophils (B), B cells (C), erythrocytes (D), and HSPC (E). (F) Percentages of High population cells falling into cell type-specific gated fractions from Gata2+/gfp::Tom (green circle) and 3q21q26-EVI1::Gata2+/gfp::Tom (blue circle) mouse bone marrows; monocytes (Mono), neutrophils (Neu), B cells (B), erythroid cells (Ery), and Mks. (G) Percentages of High populations in LK and LSK fractions from Gata2+/gfp::Tom (green circle) and 3q21q26-EVI1::Gata2+/gfp::Tom (blue circle) mouse bone marrows. (H) Cell populations contained in High population (yellow background ellipse). Note that HSPC and Mk-lineage cells are both enriched in the High population. Values represent the means ± SD. **P < .01 (unpaired Student t test).
EVI1 plus Gata2 High fraction contains HSPC and Mks. (A-E) Representative flow cytometric profiles of High and Low/Negative populations in Gata2+/gfp::Tom and 3q21q26-EVI1::Gata2+/gfp::Tom mouse bone marrows. Red circles and boxes in each panel represent populations of Mk cells (A), monocytes and neutrophils (B), B cells (C), erythrocytes (D), and HSPC (E). (F) Percentages of High population cells falling into cell type-specific gated fractions from Gata2+/gfp::Tom (green circle) and 3q21q26-EVI1::Gata2+/gfp::Tom (blue circle) mouse bone marrows; monocytes (Mono), neutrophils (Neu), B cells (B), erythroid cells (Ery), and Mks. (G) Percentages of High populations in LK and LSK fractions from Gata2+/gfp::Tom (green circle) and 3q21q26-EVI1::Gata2+/gfp::Tom (blue circle) mouse bone marrows. (H) Cell populations contained in High population (yellow background ellipse). Note that HSPC and Mk-lineage cells are both enriched in the High population. Values represent the means ± SD. **P < .01 (unpaired Student t test).
To examine which proportion of the High population represents hematopoietic stem cells (HSCs) or multipotent progenitors (MPPs), we analyzed LSK populations. We found that LSK cells accounted for 8.3% ± 1.3% and 36.4% ± 8.7% of the High population in Gata2+/gfp::Tom and 3q21q26-EVI1::Gata2+/gfp::Tom mice, respectively (supplemental Figure 5A-B). We further dissected LSK into MPP and long term-HSC (LT-HSC) fractions, using a previously described sorting strategy.22 We used a signaling lymphocyte activation molecule–based method22 to isolate the MPP and HSC fractions, because we found that the CD34 expression profile of 3q21q26-EVI1 mice was different from that of WT mice (supplemental Figure 6A-B).
The percentage of LT-HSC (LSK Flt3–CD150+CD48–) in the High population of 3q21q26-EVI1::Gata2+/gfp::Tom mice was diminished in comparison with Gata2+/gfp::Tom mice. Although the percentages of short-term HSC (ST-HSC; LSK Flt3–CD150–CD48–) and MPP4 (LSK Flt3+) were comparable in these mice, the percentages of MPP2 (LSK Flt3–CD150+CD48+) and MPP3 (LSK Flt3–CD150–CD48+) were significantly higher in 3q21q26-EVI1::Gata2+/gfp::Tom mice when compared with Gata2+/gfp::Tom mice (supplemental Figure 5A,C). These results indicate that the High population of 3q21q26-EVI1::Gata2+/gfp::Tom bone marrow cells contains more myeloid and Mk/erythroid-primed progenitors than the Gata2+/gfp::Tom bone marrows.
Inv(3)-driven EVI1 promotes expansion of multipotent progenitors
To elucidate the individual or combinatorial contributions of EVI1 overexpression and Gata2 haploinsufficiency to leukemogenesis, we next analyzed the bone marrows of 12-week-old mice of 4 different genotypes: WT, Gata2+/gfp (Gata2 heterozygous null mutant), 3q21q26-EVI1 (EVI1 overexpression BAC transgenic), and 3q21q26-EVI1::Gata2+/gfp (Figure 3A). Because LSK cells were highly enriched in the High population (Figure 2G), we first analyzed the LSK fraction. We found that the absolute number of LSK cells increased markedly in the 3q21q26-EVI1 and 3q21q26-EVI1::Gata2+/gfp mice when compared with the WT and Gata2+/gfp mice, indicating that inv(3)-driven expression of EVI1 enhances the expansion of the HSPC pool (Figure 3B-C).
![Inv(3)-driven EVI1 expression promotes expansion of multipotent progenitors, but not LT-HSC. (A) Mouse models used for evaluation of the individual or combinatorial contributions of EVI1 overexpression and Gata2 haploinsufficiency to leukemogenesis. Twelve-week-old mice were used for this study. (B) Representative flow cytometric profiles of lineage-negative fractions from 12-week-old WT, Gata2+/gfp, 3q21q26-EVI1, and 3q21q26-EVI1::Gata2+/gfp bone marrows. Further analysis of the LSK fraction (top) is shown in the middle panels, whereas analyses of the Flt3-low fraction in the middle panels are shown in the bottom panels. (C) Absolute numbers of LSK cells in the bone marrows from 12-week-old WT (blue circle), Gata2+/gfp (red square), 3q21q26-EVI1 (green triangle), and 3q21q26-EVI1::Gata2+/gfp (purple reverse triangle) mice. (D) Percentages of LT-HSC, ST-HSC, MPP2, MPP3, and MPP4 in LSK fractions from 12-week-old WT (blue circle), Gata2+/gfp (red square), 3q21q26-EVI1 (green triangle), and 3q21q26-EVI1::Gata2+/gfp (purple reverse triangle) mice. (E) Absolute numbers of LT-HSC, ST-HSC, MPP2, MPP3, and MPP4 in the bone marrows from 12-week-old WT (blue circle), Gata2+/gfp (red square), 3q21q26-EVI1 (green triangle), and 3q21q26-EVI1::Gata2+/gfp (purple reverse triangle) mice. Values represent the means ± SD. *P < .05; **P < .01 (1-way analysis of variance [ANOVA]).](https://ash.silverchair-cdn.com/ash/content_public/journal/bloodadvances/4/8/10.1182_bloodadvances.2019000978/1/m_advancesadv2019000978f3.png?Expires=1765957365&Signature=D9-bGOWgQ1IOLxpHwaLtaDgFomu7MtFEDMSsua3s3d0yhdHmLm4ijcyY6PaC3rpuhVQDVnCY4ZwNV-Ue2Zu3UNaB2EvbRYFPw6vYLGQvwYfSwlqhHlgELiguPMCu-hZxRxaoM9ZyeUJMsTqIRczVTPPpQA~6CFIQkZiuhh-NY4PDN5wrkCdPIiDqLzMcgSoARxOPFUmouNXDBjWAfbhy-mB6~6uxNgKyUxCbv4qqrymS-2w2kmbWvEU5GRKX3vrhmqHOtcE5wUTPv15Cn27jwiqQRAH64adi16BBhq2jDt1Td9ciUgmDNaGWpvYrZ-U8fpABmpjV~rm3XFQH4YQTmw__&Key-Pair-Id=APKAIE5G5CRDK6RD3PGA)
Inv(3)-driven EVI1 expression promotes expansion of multipotent progenitors, but not LT-HSC. (A) Mouse models used for evaluation of the individual or combinatorial contributions of EVI1 overexpression and Gata2 haploinsufficiency to leukemogenesis. Twelve-week-old mice were used for this study. (B) Representative flow cytometric profiles of lineage-negative fractions from 12-week-old WT, Gata2+/gfp, 3q21q26-EVI1, and 3q21q26-EVI1::Gata2+/gfp bone marrows. Further analysis of the LSK fraction (top) is shown in the middle panels, whereas analyses of the Flt3-low fraction in the middle panels are shown in the bottom panels. (C) Absolute numbers of LSK cells in the bone marrows from 12-week-old WT (blue circle), Gata2+/gfp (red square), 3q21q26-EVI1 (green triangle), and 3q21q26-EVI1::Gata2+/gfp (purple reverse triangle) mice. (D) Percentages of LT-HSC, ST-HSC, MPP2, MPP3, and MPP4 in LSK fractions from 12-week-old WT (blue circle), Gata2+/gfp (red square), 3q21q26-EVI1 (green triangle), and 3q21q26-EVI1::Gata2+/gfp (purple reverse triangle) mice. (E) Absolute numbers of LT-HSC, ST-HSC, MPP2, MPP3, and MPP4 in the bone marrows from 12-week-old WT (blue circle), Gata2+/gfp (red square), 3q21q26-EVI1 (green triangle), and 3q21q26-EVI1::Gata2+/gfp (purple reverse triangle) mice. Values represent the means ± SD. *P < .05; **P < .01 (1-way analysis of variance [ANOVA]).
Inv(3)-driven EVI1 expression promotes expansion of multipotent progenitors, but not LT-HSC. (A) Mouse models used for evaluation of the individual or combinatorial contributions of EVI1 overexpression and Gata2 haploinsufficiency to leukemogenesis. Twelve-week-old mice were used for this study. (B) Representative flow cytometric profiles of lineage-negative fractions from 12-week-old WT, Gata2+/gfp, 3q21q26-EVI1, and 3q21q26-EVI1::Gata2+/gfp bone marrows. Further analysis of the LSK fraction (top) is shown in the middle panels, whereas analyses of the Flt3-low fraction in the middle panels are shown in the bottom panels. (C) Absolute numbers of LSK cells in the bone marrows from 12-week-old WT (blue circle), Gata2+/gfp (red square), 3q21q26-EVI1 (green triangle), and 3q21q26-EVI1::Gata2+/gfp (purple reverse triangle) mice. (D) Percentages of LT-HSC, ST-HSC, MPP2, MPP3, and MPP4 in LSK fractions from 12-week-old WT (blue circle), Gata2+/gfp (red square), 3q21q26-EVI1 (green triangle), and 3q21q26-EVI1::Gata2+/gfp (purple reverse triangle) mice. (E) Absolute numbers of LT-HSC, ST-HSC, MPP2, MPP3, and MPP4 in the bone marrows from 12-week-old WT (blue circle), Gata2+/gfp (red square), 3q21q26-EVI1 (green triangle), and 3q21q26-EVI1::Gata2+/gfp (purple reverse triangle) mice. Values represent the means ± SD. *P < .05; **P < .01 (1-way analysis of variance [ANOVA]).
We next fractionated LSK into separate MPP and HSC pools (Figure 3B,D-E) and examined the frequencies of these populations within the LSK fraction (Figure 3D), as well as the absolute numbers of each population (Figure 3E). We found that both the frequencies and absolute numbers of ST-HSC and MPPs were comparable between WT and Gata2+/gfp mice (Figure 3D-E); however, the frequency of LT-HSC in Gata2+/gfp mice was lower than in WT mice, consistent with a previous report.23 Because the absolute numbers of LT-HSC were comparable between WT and Gata2+/gfp mice, the data suggest that loss of 1 Gata2 allele does not substantially affect LT-HSC. These results indicate that Gata2 heterozygous deletion in the absence of inv(3)-driven EVI1 expression does not significantly affect the HSC or MPP populations.
We found that although the percentages of LT-HSC and ST-HSC were both significantly reduced in 3q21q26-EVI1 mice when compared with WT mice (Figure 3D), the absolute numbers of LT-HSC and ST-HSC were comparable (Figure 3E). These data suggest that inv(3)-driven expression of EVI1 does not induce stem-cell expansion. Notably, both the frequencies and the absolute numbers of erythroid-Mk-biased MPP2 and myeloid-biased MPP3 were highly elevated in 3q21q26-EVI1 mice when compared with WT mice (Figure 3D-E). In contrast, the frequency of lymphoid-biased MPP4 was lower in 3q21q26-EVI1 mice, whereas the absolute numbers of MPP4 increased modestly. These results indicate that inv(3)-driven EVI1 expression induces expansion of the erythroid-Mk-biased MPP2 and myeloid-biased MPP3 compartments, but has a negligible effect on lymphoid-biased MPP4.
We also found that the frequency of MPP2 was significantly elevated in the 3q21q26-EVI1::Gata2+/gfp mice compared with the 3q21q26-EVI1 mice (Figure 3D), indicating a significant contribution of GATA2 haploinsufficiency to the accumulation of MPP2. In addition, the absolute number of ST-HSC increased slightly in the 3q21q26-EVI1::Gata2+/gfp mice when compared with WT or Gata2+/gfp mice. These data suggest that reduced Gata2 expression enhances MPP2 and ST-HSC expansion collaboratively with inv(3)-elevated EVI1 expression.
Inv(3)-driven EVI1 promotes production of Mks and platelets
Because the High population contained Mk-lineage cells in addition to HSPC (Figure 2A), we next asked whether or not Mk differentiation might be affected by EVI1 and/or GATA2 misexpression. The data show that the absolute numbers of Mk-erythrocyte progenitors (MEP; Figure 4A) and Mk cells (CD41+CD61+; Figure 4B) in the bone marrow were markedly higher in the 3q21q26-EVI1 and 3q21q26-EVI1::Gata2+/gfp mice when compared with either WT or Gata2+/gfp animals. Within the Mk-lineage, the frequency of c-Kit+ immature cells increased in both 3q21q26-EVI1 and 3q21q26-EVI1::Gata2+/gfp mice compared with WT and Gata2+/gfp mice (Figure 4C). The platelet numbers were highly increased in both the 3q21q26-EVI1 and 3q21q26-EVI1::Gata2+/gfp mice, but there was no significant difference between the 2 genotypes (Figure 4D). These results thus support the contention that inv(3)-driven EVI1 expression promotes Mk and platelet production through an increase in MEP. As high platelet counts are often observed in human leukemia cases bearing the 3q rearrangement,11,12 these results demonstrate that 3q21q26-EVI1 and 3q21q26-EVI1::Gata2+/gfp mice accurately recapitulate the human AML phenotype.
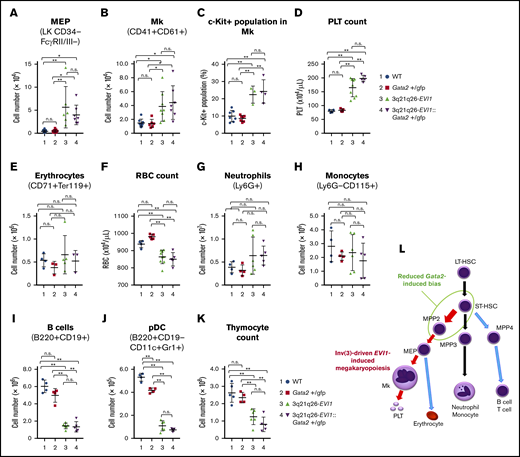
Inv(3)-driven EVI1 expression promotes Mk-lineage skewing. (A-B) Absolute numbers of MEP (A) and Mks (B) in the bone marrows of 12-week-old WT (blue circle), Gata2+/gfp (red square), 3q21q26-EVI1 (green triangle), and 3q21q26-EVI1::Gata2+/gfp (purple reverse triangle) mice. (C) Percentages of c-Kit+ cells in (CD41+CD61+) Mk of WT (blue circle), Gata2+/gfp (red square), 3q21q26-EVI1 (green triangle), and 3q21q26-EVI1::Gata2+/gfp (purple reverse triangle) mice. (D) Platelet (PLT) counts in the peripheral blood of WT (blue circle), Gata2+/gfp (red square), 3q21q26-EVI1 (green triangle), and 3q21q26-EVI1::Gata2+/gfp (purple reverse triangle) mice. Note that inv(3)-driven EVI1 expression promotes Mk and platelet numbers through increased MEP abundance. (E) Absolute numbers of erythroid cells in the bone marrows. (F) Red blood cell (RBC) counts in the peripheral blood of WT (blue circle), Gata2+/gfp (red square), 3q21q26-EVI1 (green triangle), and 3q21q26-EVI1::Gata2+/gfp (purple reverse triangle) mice. (G-J) Absolute numbers of neutrophils (G), monocytes (H), B cells (I), and pDCs (J) in the bone marrows of WT (blue circle), Gata2+/gfp (red square), 3q21q26-EVI1 (green triangle), and 3q21q26-EVI1::Gata2+/gfp (purple reverse triangle) mice. (K) Absolute numbers of thymocytes from WT (blue circle), Gata2+/gfp (red square), 3q21q26-EVI1 (green triangle), and 3q21q26-EVI1::Gata2+/gfp (purple reverse triangle) mice. (L) A model for lineage skewing by misexpression of EVI1 (red arrows) and Gata2 (green circle). Values represent the means ± SD. *P < .05; **P < .01 (1-way ANOVA).
Inv(3)-driven EVI1 expression promotes Mk-lineage skewing. (A-B) Absolute numbers of MEP (A) and Mks (B) in the bone marrows of 12-week-old WT (blue circle), Gata2+/gfp (red square), 3q21q26-EVI1 (green triangle), and 3q21q26-EVI1::Gata2+/gfp (purple reverse triangle) mice. (C) Percentages of c-Kit+ cells in (CD41+CD61+) Mk of WT (blue circle), Gata2+/gfp (red square), 3q21q26-EVI1 (green triangle), and 3q21q26-EVI1::Gata2+/gfp (purple reverse triangle) mice. (D) Platelet (PLT) counts in the peripheral blood of WT (blue circle), Gata2+/gfp (red square), 3q21q26-EVI1 (green triangle), and 3q21q26-EVI1::Gata2+/gfp (purple reverse triangle) mice. Note that inv(3)-driven EVI1 expression promotes Mk and platelet numbers through increased MEP abundance. (E) Absolute numbers of erythroid cells in the bone marrows. (F) Red blood cell (RBC) counts in the peripheral blood of WT (blue circle), Gata2+/gfp (red square), 3q21q26-EVI1 (green triangle), and 3q21q26-EVI1::Gata2+/gfp (purple reverse triangle) mice. (G-J) Absolute numbers of neutrophils (G), monocytes (H), B cells (I), and pDCs (J) in the bone marrows of WT (blue circle), Gata2+/gfp (red square), 3q21q26-EVI1 (green triangle), and 3q21q26-EVI1::Gata2+/gfp (purple reverse triangle) mice. (K) Absolute numbers of thymocytes from WT (blue circle), Gata2+/gfp (red square), 3q21q26-EVI1 (green triangle), and 3q21q26-EVI1::Gata2+/gfp (purple reverse triangle) mice. (L) A model for lineage skewing by misexpression of EVI1 (red arrows) and Gata2 (green circle). Values represent the means ± SD. *P < .05; **P < .01 (1-way ANOVA).
Inv(3)-driven EVI1 impairs lymphoid differentiation
We next asked whether 3q21q26-driven EVI1 and Gata2 misexpression might affect other hematopoietic lineages. To this end, we analyzed bone marrow and peripheral blood cells. Although erythroid cell numbers (CD71+Ter119+) in the bone marrow were comparable among all 4 genotypes (Figure 4E), red blood cells in the peripheral blood were moderately lower in the 3q21q26-EVI1 and 3q21q26-EVI1::Gata2+/gfp mice (Figure 4F). Neutrophils (Ly6G+) and monocytes (Ly6G–CD115+) were comparable among the 4 genotype mice (Figure 4G-H). However, we found that B lymphocytes (B220+CD19+) were significantly diminished in both the 3q21q26-EVI1 and 3q21q26-EVI1::Gata2+/gfp mice when compared with WT or Gata2+/gfp mice (Figure 4I). As the B220+CD19– flow population has been shown to contain progenitors for plasmacytoid dendritic cells (pDCs) in addition to B-lineage cells,24 we also examined possible changes in pDC population (B220+CD19–CD11c+Gr1+). We found that the pDC population had also decreased significantly in the 3q21q26-EVI1 and 3q21q26-EVI1::Gata2+/gfp mice (Figure 4J). Thymocyte cellularity was also markedly reduced in both 3q21q26-EVI1 and 3q21q26-EVI1::Gata2+/gfp mice compared with WT or Gata2+/gfp mice, suggesting that EVI1 also directly or indirectly affects T-cell development (Figure 4K). These data demonstrate that EVI1 expression driven by the 3q-rearranged allele suppresses lymphocyte production.
As summarized in Figure 4L, we conclude, based on these results, that EVI1 expression driven by the 3q-rearranged allele markedly promotes hematopoietic progenitor expansion and Mk differentiation, but at the same time, it significantly suppresses lymphoid differentiation. Although reduction of Gata2 expression enhances the Mk bias toward MPP2 progenitors, the reduction of Gata2 expression does not significantly increase the number of Mk cells or platelets in 3q21q26-EVI1::Gata2+/gfp mice when compared with those in 3q21q26-EVI1 mice. These changes in Mk and platelet counts contrast starkly with the analogous changes in leukemic cells (see next section).
Gata2 haploinsufficiency increases the incidence of EVI1-driven leukemia with high platelet and Mk numbers
Both 3q21q26-EVI1 and 3q21q26-EVI1::Gata2+/gfp mice develop leukemia, whereas WT and Gata2+/gfp mice do not.18 Because EVI1 and Gata2 misexpression enhanced megakaryopoiesis before leukemic onset, we next analyzed platelet counts in the peripheral blood of leukemic 3q21q26-EVI1 and 3q21q26-EVI1::Gata2+/gfp mice. To this end, we examined hematologic indices of the peripheral blood on a regular basis and euthanized the mice whose white blood cell counts exceeded 5 × 10⁴ cells/μL, which we defined as the onset of leukemia. 3q21q26-EVI1::Gata2+/gfp mice developed leukemia earlier than 3q21q26-EVI1 mice did, consistent with our previous analysis18 (supplemental Figure 7). At the onset of leukemia, we measured platelet counts and Mk numbers. We found that although most of the leukemic 3q21q26-EVI1 mice exhibited low platelet counts when compared with the platelet numbers in age-matched WT mice, leukemic mice in the 3q21q26-EVI1::Gata2+/gfp cohort exhibited a much wider range of platelet numbers than the 3q21q26-EVI1 group (Figure 5A). Of note, 6 mice among the former cohort showed higher platelet counts than WT mice.
![Gata2 heterozygous loss increases the incidence of EVI1-driven leukemia with high platelets and Mks. (A) PLT counts in the peripheral blood of leukemic 3q21q26-EVI1 (red circle) and 3q21q26-EVI1::Gata2+/gfp (blue square) mice. An orange dotted line represents PLT levels of age-matched WT mice. (B) Percentages of Mks in the bone marrows of leukemic 3q21q26-EVI1 (red circle) and 3q21q26-EVI1::Gata2+/gfp (blue square) mice. (C) Kaplan-Meier survival curves of 3q21q26-EVI1 (High-Mk type leukemia [orange dotted line], Low-Mk type leukemia [red line]), and 3q21q26-EVI1::Gata2+/gfp mice (High-Mk type leukemia [turquoise line] or Low-Mk type leukemia [blue dashed line]). *P < .05 (log-rank test).](https://ash.silverchair-cdn.com/ash/content_public/journal/bloodadvances/4/8/10.1182_bloodadvances.2019000978/1/m_advancesadv2019000978f5.png?Expires=1765957365&Signature=PXB8JiPgDZ~owfx-sVnFCNJryBX0bDauzsHRmCn6y1Vjqt-toWIj-b1QPh2xIy9BiUqUSRU4ie7b0fFi~6KVH0zK1Ds~vat0oYra5htH~1HqXSvCuD4z-FHJuyirSrHRprCnMWwodzmJQ2K1whNr51iNFlQmeriUevf8sETuadSgM89rtHW2GT9LFJaTan0cilKn~art9sXtp9Qpukelcch69ns0cKf0FZNn~tLZ4-4bYUyH-qeUfuUeApl5TsCVSCYH-luPsFMdPRbVNBc-~JtI6Iile4vTfg68ykCVgZQfQLYihegR4vNY8uDHVAqg96jr9zzvfiFo4mghbX3zTQ__&Key-Pair-Id=APKAIE5G5CRDK6RD3PGA)
Gata2 heterozygous loss increases the incidence of EVI1-driven leukemia with high platelets and Mks. (A) PLT counts in the peripheral blood of leukemic 3q21q26-EVI1 (red circle) and 3q21q26-EVI1::Gata2+/gfp (blue square) mice. An orange dotted line represents PLT levels of age-matched WT mice. (B) Percentages of Mks in the bone marrows of leukemic 3q21q26-EVI1 (red circle) and 3q21q26-EVI1::Gata2+/gfp (blue square) mice. (C) Kaplan-Meier survival curves of 3q21q26-EVI1 (High-Mk type leukemia [orange dotted line], Low-Mk type leukemia [red line]), and 3q21q26-EVI1::Gata2+/gfp mice (High-Mk type leukemia [turquoise line] or Low-Mk type leukemia [blue dashed line]). *P < .05 (log-rank test).
Gata2 heterozygous loss increases the incidence of EVI1-driven leukemia with high platelets and Mks. (A) PLT counts in the peripheral blood of leukemic 3q21q26-EVI1 (red circle) and 3q21q26-EVI1::Gata2+/gfp (blue square) mice. An orange dotted line represents PLT levels of age-matched WT mice. (B) Percentages of Mks in the bone marrows of leukemic 3q21q26-EVI1 (red circle) and 3q21q26-EVI1::Gata2+/gfp (blue square) mice. (C) Kaplan-Meier survival curves of 3q21q26-EVI1 (High-Mk type leukemia [orange dotted line], Low-Mk type leukemia [red line]), and 3q21q26-EVI1::Gata2+/gfp mice (High-Mk type leukemia [turquoise line] or Low-Mk type leukemia [blue dashed line]). *P < .05 (log-rank test).
We next analyzed the frequencies of CD41+ Mk cells in the bone marrow. Again, we found a wider range of Mk numbers in the 3q21q26-EVI1::Gata2+/gfp mice than in 3q21q26-EVI1 mice (Figure 5B). We next divided both groups of leukemic mice into 3 tiers (High-, Medium-, and Low-Mk types) and compared the distributions of these 3 tiers in the leukemias that developed in the presence of either 1 or 2 active Gata2 alleles. The incidence of High-Mk leukemia increased in 3q21q26-EVI1::Gata2+/gfp mice (6 of 25 mice: 24%) when compared with 3q21q26-EVI1 mice (1 of 25 mice: 4%), whereas the Medium- and Low-Mk categories were comparable between these 2 genotypes. These results suggest that Gata2 heterozygous deletion promotes EVI1-driven leukemia development with high Mk and platelet numbers.
To address whether the properties of the Mks affect transformation of EVI1-driven leukemias, we analyzed the onset of leukemia within the cohorts of High- and Low-Mk 3q21q26-EVI1::Gata2+/gfp mice (n = 6 and 15, respectively), as well as in High- and Low-Mk 3q21q26-EVI1 mice (n = 1 and n = 21, respectively). We also examined latency periods from birth to the leukemia onset (Figure 5C). We found that the latency of High-Mk-type leukemia in 3q21q26-EVI1::Gata2+/gfp mice was comparable to that in the Low-Mk-type leukemia, but the latency of High-Mk-type leukemia in 3q21q26-EVI1::Gata2+/gfp mice was significantly shorter than that of Low-Mk-type leukemia in 3q21q26 mice (Figure 5C). These results imply that the Mk nature of the leukemic cells does not correlate directly with the onset of leukemia.
3q21q26-EVI1::Gata2+/gfp leukemia with elevated platelets shows similar characteristics to patients with AML harboring 3q rearrangements
To further characterize the High-Mk-type of leukemia developed by the 3q21q26-EVI1::Gata2+/gfp mice, we analyzed peripheral blood smears at the onset of frank leukemia. Morphological analysis revealed that peripheral blood cells from High-Mk leukemic 3q21q26-EVI1::Gata2+/gfp mice exhibited significant heterogeneity (Figure 6A). We observed blast cells with large nuclei and blue cytoplasm (white arrowhead), myeloid cells harboring segmented nuclei (yellow arrowhead) and Mk cells with large nuclei and light-blue unstructured cytoplasm (black arrowhead). Morphological analysis showed that the size of Mk cells in leukemic mice was comparable to that of blast cells and myeloid cells, indicating that these Mks were micromegakaryocytes that are smaller than normal Mk cells. We also observed giant platelets (arrow) in the High-Mk-type leukemia. These morphological features are similar to those found in patients with AML harboring chromosomal rearrangements between 3q21 and 3q26.

Leukemia in the 3q21q26-EVI1::Gata2+/gfpmice with high platelets has characteristics similar to those of human patients with AML harboring 3q rearrangements. (A) Representative peripheral blood smears (Wright-Giemsa staining) from leukemic 3q21q26-EVI1::Gata2+/gfp mice (High-Mk type leukemia). Note that Blast cells (white arrowheads), myeloid cells (yellow arrowhead), micromegakaryocytes (black arrowheads), and giant platelets (arrow) are observed. (B) Representative flow cytometric profiles of bone marrow cells from leukemic 3q21q26-EVI1::Gata2+/gfp mice (High-Mk type leukemia). CD41– and CD41+CD61+ fractions were further subdivided to assess granulocytic and blast cell characteristics. (C) Representative c-Kit expression profile in each fraction from leukemic 3q21q26-EVI1::Gata2+/gfp mice (High-Mk type leukemia). (D) Wright-Giemsa staining of leukemic cells from 3q21q26-EVI1::Gata2+/gfp bone marrows. (E) Relative mRNA levels of EVI1 and mouse endogenous Gata2 mRNA in each population. B220+Gr1–CD41– (red), B220–Gr1+CD41– (orange), B220–Gr1–CD41– (green), and B220–Gr1–CD41+CD61+ (blue) cells are shown. The abundance of the mRNA was normalized to glyceraldehyde-3-phosphate dehydrogenase. Average values of B220+Gr1–CD41– population were set to 1. Values represent the means ± SD. *P < .05; **P < .01 (1-way ANOVA). (F) Schema for the transplantation analysis; 5 × 10⁴ CD41+B220–Gr1–, CD41–B220+Gr1–, and CD41–B220–Gr1+ cells from leukemic 3q21q26-EVI1::Gata2+/gfp (High-Mk type leukemia, CD45.1/CD45.2 heterozygotes or CD45.1 homozygous) mice were independently transplanted into sublethally irradiated CD45.2 homozygous WT mice. (G) Kaplan-Meier survival curves of WT mice receiving CD41+B220–Gr1–, CD41–B220+Gr1–, and CD41–B220–Gr1+ cells from leukemic 3q21q26-EVI1::Gata2+/gfp mice (High-Mk type leukemia). (H) Representative flow cytometric patterns of the bone marrows of recipient mice receiving CD41–B220+Gr1– cells.
Leukemia in the 3q21q26-EVI1::Gata2+/gfpmice with high platelets has characteristics similar to those of human patients with AML harboring 3q rearrangements. (A) Representative peripheral blood smears (Wright-Giemsa staining) from leukemic 3q21q26-EVI1::Gata2+/gfp mice (High-Mk type leukemia). Note that Blast cells (white arrowheads), myeloid cells (yellow arrowhead), micromegakaryocytes (black arrowheads), and giant platelets (arrow) are observed. (B) Representative flow cytometric profiles of bone marrow cells from leukemic 3q21q26-EVI1::Gata2+/gfp mice (High-Mk type leukemia). CD41– and CD41+CD61+ fractions were further subdivided to assess granulocytic and blast cell characteristics. (C) Representative c-Kit expression profile in each fraction from leukemic 3q21q26-EVI1::Gata2+/gfp mice (High-Mk type leukemia). (D) Wright-Giemsa staining of leukemic cells from 3q21q26-EVI1::Gata2+/gfp bone marrows. (E) Relative mRNA levels of EVI1 and mouse endogenous Gata2 mRNA in each population. B220+Gr1–CD41– (red), B220–Gr1+CD41– (orange), B220–Gr1–CD41– (green), and B220–Gr1–CD41+CD61+ (blue) cells are shown. The abundance of the mRNA was normalized to glyceraldehyde-3-phosphate dehydrogenase. Average values of B220+Gr1–CD41– population were set to 1. Values represent the means ± SD. *P < .05; **P < .01 (1-way ANOVA). (F) Schema for the transplantation analysis; 5 × 10⁴ CD41+B220–Gr1–, CD41–B220+Gr1–, and CD41–B220–Gr1+ cells from leukemic 3q21q26-EVI1::Gata2+/gfp (High-Mk type leukemia, CD45.1/CD45.2 heterozygotes or CD45.1 homozygous) mice were independently transplanted into sublethally irradiated CD45.2 homozygous WT mice. (G) Kaplan-Meier survival curves of WT mice receiving CD41+B220–Gr1–, CD41–B220+Gr1–, and CD41–B220–Gr1+ cells from leukemic 3q21q26-EVI1::Gata2+/gfp mice (High-Mk type leukemia). (H) Representative flow cytometric patterns of the bone marrows of recipient mice receiving CD41–B220+Gr1– cells.
To analyze various cell compartments from the bone marrows of the High-Mk-type leukemia, we performed flow cytometric and morphological analysis. We found that CD41+CD61+ Mk cells accumulated in the leukemic bone marrow, whereas CD41– cells also accumulated (Figure 6B). The CD41– population contained B220+Gr1– cells, B220–Gr1+ cells, and B220–Gr1– cells. To identify the leukemic progenitor fraction within these populations, we analyzed c-Kit expression and found that the CD41–B220+Gr1– population also contains abundant c-Kit+ cells (Figure 6C), consistent with the secondary leukemia observed in 3q21q26-EVI1::Gata2+/gfp mice.18
We also observed that the CD41+CD61+ population contained cells with pseudopodia (Figure 6D). The CD41–B220+Gr1– population contained blast-like cells, whereas the CD41–B220–Gr1+ cells bore myeloid-featured cells harboring segmented nuclei. We examined EVI1 and Gata2 expression levels in the CD41+CD61+B220–Gr1–, CD41–B220+Gr1–, CD41–B220–Gr1+, and CD41–B220–Gr1– cell populations (Figure 6E). The results revealed that CD41+CD61+ Mk cells expressed the highest EVI1 and Gata2 levels among these populations, whereas the CD41–B220+Gr1– cohort also expressed high levels of both EVI1 and Gata2. In contrast, the levels of EVI1 and Gata2 were both diminished in the CD41–B220–Gr1+ myeloid cells. These expression profiles in the distinct populations of leukemic mice are similar to those in the preleukemic mice we previously examined using reporter genes (Figure 2). These results suggest that the CD41–B220+Gr1– blast-like cells may supply Mk and myeloid leukemia cells in the High-Mk-type leukemic mice.
To examine whether CD41+ cells within the 3q21q26-EVI1::Gata2+/gfp bone marrow are leukemogenic, we isolated CD41+ cells and transplanted them into sublethally irradiated WT mice (Figure 6F); none of the recipient mice developed leukemia, indicating that CD41+ cells are not leukemogenic (Figure 6G). We next isolated CD41–B220+Gr1– cells containing leukemic blast cells from the bone marrow and transplanted the cells into sublethally irradiated WT mice. We found that the recipients developed leukemia containing CD41+CD61+ cells similar to donor’s leukemia (Figure 6H, left panels), or leukemia occupied by CD41–B220+Gr1– blast cells (right panels). These results indicate that bone marrow CD41–B220+Gr1– cells from 3q21q26-EVI1::Gata2+/gfp mice are leukemogenic and that CD41+CD61+ cells are derived from CD41–B220+Gr1– leukemic blast cells. In addition, these results imply that the CD41–B220+Gr1– population contains both cells that retain the capacity to differentiate into CD41+CD61+ cells and cells without that capability.
We observed that only a single 3q21q26-EVI1 mouse developed high Mk-type leukemia (Figure 5A-B). Morphological analyses of its peripheral blood and flow cytometric analyses of its bone marrow cells showed that the phenotype of high Mk-type leukemia in the 3q21q26-EVI1 mouse was similar to that observed in 3q21q26-EVI1::Gata2+/gfp mice (supplemental Figure 8A-B). On the basis of these results, we conclude that Gata2 haploinsufficiency increases the frequency of High-Mk-type leukemia driven by EVI1.
Discussion
Abnormal accumulation of HSPC as a consequence of differentiation defects often provides an important basis for leukemogenesis. Here, we established a new reporter mouse model that enabled us to identify an EVI1-/Gata2 High population that accumulates in mice before leukemia onset. This population supports sequential replicative potential in vitro, suggesting that it includes cellular origin of leukemic cells. Because the High population contains not only HSPCs but also Mk-lineage cells, we have investigated the functional contributions of EVI1 and Gata2 to multiple abnormal and normal blood cell types. As summarized in Figure 7, erythroid-Mk-biased MPP2 and myeloid-biased MPP3 are highly expanded by inv(3)-driven EVI1 expression, whereas in contrast, inv(3)-driven EVI1 expression does not significantly affect LT-HSC expansion. Inv(3)-driven EVI1 expression also induces subsequent megakaryopoiesis (shown by the red circle in Figure 7), but haploinsufficient Gata2 has only a modest enhancement of MPP2 or ST-HSC cohorts (shown by the green circle). We also found that reduced Gata2 expression increased the frequency of leukemia in EVI1-expressing cells with a high number of platelets and Mk among all inv(3)-driven EVI1 leukemias, thus recapitulating major hematological features of patients with 3q AML. These results indicate that inv(3)-driven EVI1 expression, coupled with GATA2 haploinsufficiency, at least partially induces Mk-lineage bias and accumulation of MPP2 or ST-HSC, and further implies that a component within either ST-HSC or MPP2 or a progenitor somewhere between them may well be the cell of origin for leukemias with elevated Mk.
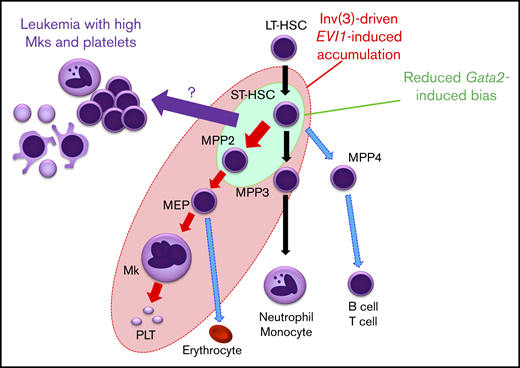
A model for lineage skewing and leukemogenesis induced by inv(3)-driven EVI1 expression and GATA2 haploinsufficiency. Inv(3)-driven EVI1 expression promotes expansion of MPP2 and MPP3, and also induces subsequent megakaryopoiesis (all cells encompassed by the red ellipse circle). Gata2 haploinsufficiency has a mild enhancement effect on MPP2 and ST-HSC (green circle). Based on the results that the 3q21q26-EVI1::Gata2+/gfp-induced leukemias nicely recapitulate major hematological features of patients with 3q AML with elevated Mk and platelet numbers, it is implied that the High Mk/platelet leukemia arises from a cell that could be ST-HSC, MPP2, or a progenitor somewhere between these 2 (purple arrow).
A model for lineage skewing and leukemogenesis induced by inv(3)-driven EVI1 expression and GATA2 haploinsufficiency. Inv(3)-driven EVI1 expression promotes expansion of MPP2 and MPP3, and also induces subsequent megakaryopoiesis (all cells encompassed by the red ellipse circle). Gata2 haploinsufficiency has a mild enhancement effect on MPP2 and ST-HSC (green circle). Based on the results that the 3q21q26-EVI1::Gata2+/gfp-induced leukemias nicely recapitulate major hematological features of patients with 3q AML with elevated Mk and platelet numbers, it is implied that the High Mk/platelet leukemia arises from a cell that could be ST-HSC, MPP2, or a progenitor somewhere between these 2 (purple arrow).
In this study, we examined the characteristics of EVI1-overexpressing cells in mice that have not yet developed leukemia by employing a novel reporter system. To date, several mouse models of EVI1-overexpressing AML or MDS have been established by means of bone marrow transplantation, using cells transduced with EVI1-expressing retroviruses or transgenic mice in which EVI1 is expressed under the control of the Sca1 promoter.14-17 These models exhibit expansion of hematopoietic progenitors and defective erythroid and lymphoid lineages, which are consistent with the hematological features of the 3q21q26-EVI1 model mice we present here. However, an important difference between the present and previous model studies is that Mk abnormalities (including Mk accumulation and elevated platelet numbers) have not been previously observed. In contrast, the 3q21q26-EVI1 in vivo mouse model examined here exhibits promotion of megakaryopoiesis, as well as the expansion of other progenitors (shown by the red circle in Figure 7). Importantly, the expression of inv(3)-driven EVI1 is observed both in HSPC and Mk-lineage cells. On the basis of these results, we surmise that enhanced megakaryopoiesis in 3q21q26-EVI1 model mouse may be a result of EVI1 overexpression in megakaryocytic progenitors of the inv(3) allele that is controlled by the G2DHE.
We also addressed megakaryocytic commitment of leukemic cells in 3q21q26-EVI1 mice. Whereas 3q21q26-EVI1 mice exhibit enhanced megakaryopoiesis and thrombocytosis before leukemia onset, in most 3q21q26-EVI1 mice, the platelet numbers have diminished by the time they develop leukemia. Notably, Gata2 heterozygous deletion promotes development of EVI1-driven leukemia with increased Mk cells and platelets, supporting the notion that GATA2 haploinsufficiency may play specific roles in the leukemogenesis of the high platelet-containing type leukemia. Although the molecular mechanism or mechanisms underlying the leukemogenesis caused by inv(3)-driven EVI1 misexpression and GATA2 haploinsufficiency are largely unknown, it is interesting to note that GATA2 upregulates Gata1 expression, a key regulator of both erythropoiesis and megakaryopoiesis. High-level expression of GATA1 promotes erythropoiesis, but lower-level expression of GATA1 promotes megakaryopoiesis.25 As GATA2 haploinsufficiency results in reduced GATA1 expression, reduced GATA2 levels may promote megakaryopoiesis. In addition, it is known that GATA2 is required for megakaryopoiesis in the absence of GATA1, and the molecular basis for this is hypothesized to be a result of GATA2 regulation of genes associated with cell cycle and the Mk-lineage.26 On the basis of these results, we propose that the GATA2 haploinsufficiency may confer an increase in Mk-lineage potential in EVI1-expressing leukemic cells.
Although it is well known that 3q AML is often associated with high numbers of Mk cells and platelets,11,12 its pathologic significance remains unknown. In this regard, Mk cells have the potential to sustain HSC and regulate HSC proliferation in the bone marrow.27,28 In addition, Mk cells produce factors such as platelet-derived growth factor that can affect the vascular niche.29 These observations imply that high numbers of Mk and platelets may play roles in the malignant leukemogenesis by sustaining leukemic stem cells. We provide evidence here that the 3q21q26-EVI1::Gata2+/gfp mouse represents a significant advance in our ability to analyze the pathologic significance of high Mk cells and platelets that is associated with a major AML phenotype for the study of malignant leukemogenesis.
Data available via e-mail request to the corresponding author, Masayuki Yamamoto (masiyamamoto@med.tohoku.ac.jp).
Acknowledgments
The authors thank Hiromi Suda and the Biomedical Research Core of Tohoku University Graduate School of Medicine for technical support.
This work was supported in part by KAKENHI 15H02507 (M.Y.), 18K19463 (M.S.), and 18K16105 (S.K.) from the Japan Society for the Promotion of Science.
Authorship
Contribution: A.Y. and M.S. designed and performed the experiments, analyzed the data, and wrote the paper; S.K. and D.O. performed the experiments and analyzed the data; and J.D.E. and M.Y. supervised the project and wrote the paper.
Conflict-of-interest disclosure: The authors declare no competing financial interests.
Correspondence: Mikiko Suzuki, Center for Radioisotope Sciences, Tohoku University Graduate School of Medicine, 2-1 Seiryo-machi, Aoba-ku, Sendai, Miyagi 980-8575, Japan; e-mail: suzukimikiko@med.tohoku.ac.jp; and Masayuki Yamamoto, Department of Medical Biochemistry, Tohoku University Graduate School of Medicine, 2-1 Seiryo-machi, Aoba-ku, Sendai, Miyagi 980-8575, Japan; e-mail: masiyamamoto@med.tohoku.ac.jp.

