

Key Points
My-DST tracks the development of multi-drug resistance from newly diagnosed to multi-relapsed bone marrow samples.
Ex vivo drug resistance to drugs received in clinical treatment identifies patients reaching poor response to treatment of multiple myeloma.

Abstract
The oncogenic drivers and progression factors in multiple myeloma (MM) are heterogeneous and difficult to target therapeutically. Many different MM drugs have emerged, however, that attack various phenotypic aspects of malignant plasma cells. These drugs are administered in numerous, seemingly interchangeable combinations. Although the availability of many treatment options is useful, no clinical test capable of optimizing and sequencing the treatment regimens for an individual patient is currently available. To overcome this problem, we developed a functional ex vivo approach to measure patients’ inherent and acquired drug resistance. This method, which we termed myeloma drug sensitivity testing (My-DST), uses unselected bone marrow mononuclear cells with a panel of drugs in clinical use, followed by flow cytometry to measure myeloma-specific cytotoxicity. We found that using whole bone marrow cultures helped preserve primary MM cell viability. My-DST was used to profile 55 primary samples at diagnosis or at relapse. Sensitivity or resistance to each drug was determined from the change in MM viability relative to untreated control samples. My-DST identified progressive loss of sensitivity to immunomodulatory drugs, proteasome inhibitors, and daratumumab through the disease course, mirroring the clinical development of resistance. Prospectively, patients’ ex vivo drug sensitivity to the drugs subsequently received was sensitive and specific for clinical response. In addition, treatment with <2 drugs identified as sensitive by My-DST led to inferior depth and duration of clinical response. In summary, ex vivo drug sensitivity is prognostically impactful and, with further validation, may facilitate more personalized and effective therapeutic regimens.
Introduction
Multiple myeloma (MM) afflicts >30 000 Americans each year, and its incidence is increasing.1 Since the 2000s, the implementation of proteasome inhibitors (PIs) and immunomodulatory drugs (IMiDs) has greatly improved the life expectancy of patients with MM.2 These agents are now used extensively to treat both newly diagnosed and relapsed MM patients. In addition, the monoclonal antibody daratumumab (Dara) has come to play a vital role in treating relapsed disease and has emerged in the upfront setting as well.3-5 Despite this progress, MM remains largely incurable, and patients experience cycles of relapse and remission, until the disease ultimately becomes multi-drug resistant. Throughout the disease course, quality of life is affected by lytic bone lesions, pathologic fractures, renal failure, immune compromise, and eventually death. Although new therapies continue to emerge, little progress has been made in the development of biomarkers that would allow for the identification of optimal treatment regimens for individual patients with MM.
The development of personalized medicine approaches to MM has been challenging due to the underlying genetic heterogeneity of the disease. Nearly one-half of all patients with MM have chromosomal translocations juxtaposing immunoglobulin promoters with various oncogenes, and the other half have gains in odd-numbered chromosomes (known as hyperdiploidy).6 The oncogenes overexpressed or dysregulated from immunoglobulin heavy chain translocations include cyclin D1, cyclin D3, MMSET/FGFR3, C-MAF, and MAFB, which have been difficult to successfully target in MM. Similarly, the genes most commonly deleted (TP53) or mutated (K-RAS and N-RAS) are notoriously difficult to target. Some patients develop mutations in genes that encode proteins for which targeted agents are available, including B-RAF and IDH1, but the benefits of inhibiting these mutant proteins in MM has not yet been established. In contrast, many drugs have been developed that target phenotypic features of MM and provide clinical benefit. There are now >16 clinically available drugs for MM in at least 7 different drug classes. Many have been approved by the US Food and Drug Administration in the last 16 years. Unfortunately, cross-resistance is both variable and unpredictable from patient to patient.
Currently, patients with MM are cycled through lines of therapy (LOT) consisting of multiple 2- to 3-drug combinations. The sequence of combinations chosen is highly variable and heavily influenced by individual physician and institutional preferences. Although evidence of mechanistic synergy between anti-myeloma agents is largely lacking, the benefit of combining 3-drug combinations over 2-drug combinations has been repeatedly borne out in clinical trials. This observation supports the model put forth by Palmer and Sorger7 wherein the independent actions of the available agents underlie the clinical benefits of most combinations. Currently, the National Comprehensive Cancer Network guidelines list >10 different options for MM combination treatment in the upfront setting and >30 different options in the relapsed setting. Consequently, the inconsistency in clinical practice increases progressively with LOT, and outcomes are disparate across practice settings.8
Drug sensitivity profiling of tumor aspirates may help facilitate personalized medicine for patients with MM. Before the IMiD/PI era, Durie et al9 studied chemotherapy effects on MM samples and found that inhibition of colony growth was predictive of survival. With limited drugs available at that time, and the subsequent widespread use of cell lines to evaluate new drugs, sensitivity profiling using primary samples was not pursued. Later, a mouse model of MM was shown to recapitulate clinical efficacy but required a long turnaround time.10 The ability to use short-term ex vivo cultures to measure drug sensitivities within a clinically useful time frame remains an attractive approach. Various three-dimensional cell culture methods, stromal coculture approaches, and advanced acquisition techniques to profile MM drug sensitivity have been reported.11-14 However, these MM drug sensitivity profiling approaches have used CD138-selected MM cell cultures in the absence of other immune effector cells. Notably, in the preclinical development of Dara, unselected mononuclear cell (MNC) cultures were used to measure antibody-dependent cellular cytotoxicity (ADCC).15-17 Although no ex vivo drug sensitivity approach has been applied to help inform clinical decisions to date, a wealth of treatment options make MM an ideal setting for its use.
To inform more effective treatment regimens, we developed a method to profile the independent drug actions using an ex vivo approach in patients with MM starting at diagnosis and continuing through multiple relapses. Our approach, which we have termed myeloma drug sensitivity testing (My-DST), is performed by culturing patient bone marrow aspirate MNCs with a panel of individual drugs, including IMiDs, PIs, dexamethasone (Dex), cyclophosphamide (Cy), and Dara as single agents, followed by high-throughput flow cytometry to measure the surviving MM cell population. The current article presents the results of using My-DST to profile the evolution of multi-drug resistance in a cohort of patients with MM spanning the disease course. We also discuss the relations between the ex vivo results using My-DST and the patients’ prior drug exposures and subsequent clinical outcomes.
Materials and methods
Patient sample processing
Extra bone marrow aspirate was collected from patients with MM and smoldering myeloma at the University of Colorado Anschutz Medical Campus after receipt of informed consent and protocol approval from the Institutional Review Board. MNCs were isolated by using SepMate Ficoll tubes (Stemcell Technologies). Normal donor samples were purchased from AllCells. For viability comparison with MM cells in MNC cultures, selection for CD138-positive cells was performed by using magnetic bead columns (Miltenyi Biotec). Samples were cryopreserved in Iscove modified Dulbecco medium containing 45% fetal bovine serum and 10% dimethyl sulfoxide.
Ex vivo drug sensitivity testing
MM samples were thawed, treated with 100 µg DNase I (MilliporeSigma), washed, and resuspended in RPMI 1640 with L-glutamine containing 10% fetal bovine serum, 100 U/mL penicillin, 100 µg/mL streptomycin (Thermo Fisher Scientific), and 2 ng/mL interleukin-6 (IL-6; PeproTech) and then transferred to 96-well plates (90 000 MNCs/well) at 37°C for 48 hours. The results were normalized by using the following equation: viable MM cells normalized (%) = (mean live MM treatment events/mean live MM control events) × 100. PIs, IMiDs, and Dex were purchased from Thermo Fisher Scientific, 4-hydroperoxy cyclophosphamide from Santa Cruz Biotechnology, Dara from University of Colorado Health Pharmacy, and clodronate-liposomes from Encapsula NanoSciences.
Flow cytometry
Samples were incubated in Brilliant Buffer (BD) and FcR blocker (Miltenyi Biotec), followed by staining with anti–CD19-BV786 (SJ25C1), anti–CD45-BV510 (HI30), anti–CD38-PerCP-Cy5.5 (HIT2) or multi-epitope anti–CD38-FITC (ALPCO), anti–CD138-BV421 (MI15), and anti–CD319-APC (235614) or anti-CD46 (E4.3) conjugated to Alexa Fluor 647 (Antibody Labeling Kit, Thermo Fisher Scientific). Intracellular staining with anti–κ-BV605 and anti–λ-phycoerythrin antibodies was performed after fixation and permeabilization. All antibodies were purchased from BD, unless noted. Stained samples were washed and re-suspended in LIVE/DEAD Fixable Near-IR Stain (Thermo Fisher Scientific). The data were analyzed by using a FACSCelesta (BD) with a high throughput sampler and FlowJo software (Tree Star). Validation of accurate volume-based acquisition was performed by using CountBright counting beads (Molecular Probes).
Statistical analysis
Figures were generated by using Prism 8 (GraphPad Software) or RStudio with means and standard deviations (SDs). Two-tailed Student t tests were used to compare 2 means; when comparing 3 or more means, analysis of variance and mixed effects models were used, applying Tukey’s correction for multiple comparisons. When normality assumptions were not met, the Mann-Whitney U test was used. Data were analyzed across lines of therapy by using mixed linear models to account for repeated measures by patient. Survival analysis was conducted by using SAS version 9.4 (SAS Institute, Inc.), with follow-up calculated by using a reverse Kaplan-Meier method and hazard ratios by Cox proportional hazards models. The date of the last follow-up visit was used as a censoring date for living patients. The stratification of patient characteristics based on drug sensitivity groups was compared by using Fisher’s exact test.
Results
Development of My-DST
The first challenge we faced when optimizing a culture assay using primary samples was to maximize untreated MM cell viability. Previous studies have shown the importance of the bone marrow microenvironment in supporting MM survival and drug sensitivity.18,19 Thus, we hypothesized that minimizing perturbation and preserving bone marrow composition would be beneficial. We compared cell viability after processing by Ficoll density gradient centrifugation vs after further CD138 selection. In all 4 samples tested, MM cell viability was significantly improved in unselected MNC cultures vs in the CD138-selected cultures; in some cases, the improvement was striking (Figure 1A). Based on these results, all of our subsequent studies used unselected MNCs.
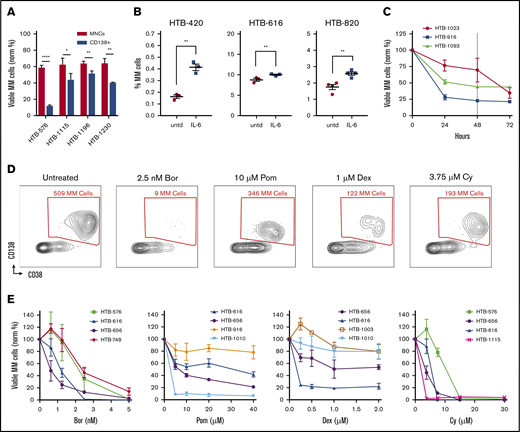
Optimizing flow cytometry–based measurements of drug sensitivity in MM patient samples ex vivo. (A) MM cell viability after 48 hours from 4 primary samples that were thawed and separated into fractions and cultured either without selection (MNCs) or with CD138 selection (normalized to time 0). (B) Ex vivo supplementation with IL-6 increased the MM cell populations for 3 of 5 samples tested. (C) The viability of MM cells decays ex vivo in the first 24 hours and then plateaus at 48 hours (dotted line) (n = 3). (D) Representative experiment with an MM patient sample treated with anti-myeloma drugs for 48 hours, followed by flow cytometry. Live cells are first gated by live/dead stain, followed by measuring the surviving MM cells, which are typically CD45–/CD19–/CD38+/CD138+ (CD19/CD45 gating not shown). Anti-myeloma drug treatment specifically reduces the number of MM cells at 48 hours. (E) Dose response for anti-myeloma drugs using this approach to measure drug sensitivity in cells from patients with MM. Data represent means ± SD, comparisons by 2-tailed Student t test. *P < .05; **P < .01; ****P < .0001. Bor, bortezomib; HTB, hematology tissue bank; Norm, normalized; Pom, pomalidomide; untd, untreated.
Optimizing flow cytometry–based measurements of drug sensitivity in MM patient samples ex vivo. (A) MM cell viability after 48 hours from 4 primary samples that were thawed and separated into fractions and cultured either without selection (MNCs) or with CD138 selection (normalized to time 0). (B) Ex vivo supplementation with IL-6 increased the MM cell populations for 3 of 5 samples tested. (C) The viability of MM cells decays ex vivo in the first 24 hours and then plateaus at 48 hours (dotted line) (n = 3). (D) Representative experiment with an MM patient sample treated with anti-myeloma drugs for 48 hours, followed by flow cytometry. Live cells are first gated by live/dead stain, followed by measuring the surviving MM cells, which are typically CD45–/CD19–/CD38+/CD138+ (CD19/CD45 gating not shown). Anti-myeloma drug treatment specifically reduces the number of MM cells at 48 hours. (E) Dose response for anti-myeloma drugs using this approach to measure drug sensitivity in cells from patients with MM. Data represent means ± SD, comparisons by 2-tailed Student t test. *P < .05; **P < .01; ****P < .0001. Bor, bortezomib; HTB, hematology tissue bank; Norm, normalized; Pom, pomalidomide; untd, untreated.
To further optimize MM cell viability and growth, we also examined the components of the culture medium. Consistent with the ability of IL-6 to promote myeloma survival and proliferation,20 supplementation of the medium with IL-6 resulted in improved MM viability for some of the samples (Figure 1B). To determine the optimal timing for measuring drug sensitivity, a time course analysis was performed. The viability of primary MM cells was variable during the first 24 hours but then stabilized for 1 to 2 days (Figure 1C). Thus, we chose 48 hours as the time point for further ex vivo drug sensitivity analyses.
To profile the different clinical agents, we started by screening MM samples using bortezomib, carfilzomib, lenalidomide, pomalidomide, Dex, and Cy (which was tested as the metabolite 4-hydroperoxy cyclophosphamide). MNCs were cultured separately with each individual agent for 48 hours, followed by flow cytometry to measure the surviving MM cell populations. To accurately measure the MM population in each sample, the cells were labeled by using antibodies that recognize CD138, CD38, CD45, CD19, CD319, and CD46 (supplemental Table 1; supplemental Figure 1A-B).21,22 Separately, intracellular flow cytometry for κ and λ was used to verify the MM populations (supplemental Figure 1C). Each drug specifically reduced MM viability (Figure 1D). Thus, My-DST identifies MM cells in each individual, similar to clinical flow cytometry, with the additional output of a drug sensitivity measurement.
To facilitate rapid screening, we identified single concentrations of each drug that resulted in benchmark decreases in MM viability, which were then used to compare sensitivity across samples. We thus established a dose–response relation for each drug. Samples were treated with graded drug concentrations, with each condition performed in triplicate and the results normalized to untreated control samples. The dose–response relations with patient samples were similar to published results using cell lines obtained after 48-hour incubations (Figure 1E; supplemental Figure 2A-B).23-26 In contrast, in our experiments, the viability of the nonplasma cells (normal MNCs in the cultures) was not affected, except by Cy treatment (supplemental Figure 2C). Notably, the viability of plasma cells from normal donors was not affected by anti-myeloma drugs tested at the same concentrations and time points, illustrating the preferential activity for malignant MM cells (supplemental Figure 2D). Several of the drugs we tested require solubilization in dimethyl sulfoxide, but 0.1% dimethyl sulfoxide control samples showed no significant effect on viability (supplemental Figure 2E). For high-throughput testing, the concentrations selected at the 48-hour time point were 2.5 nM for PIs, 10 µM for IMiDs, 1 µM for Dex, and 3.75 µM for Cy.
Comparing drug sensitivity in patient samples from diagnosis through multiple relapses
Using the individual drug concentrations identified earlier, we profiled drug sensitivity in 55 patient samples at diagnosis (n = 24), first relapse (n = 12), and after multiple relapses (n = 19) (Figure 2A; supplemental Tables 2-3). To differentiate between sensitivity and resistance, <80% MM survival (ie, 20% MM cell loss) was used as a working threshold, as statistically significant results started to be achieved at that point for each drug (supplemental Figure 3A-E). Variance was similar across the drugs tested, but there were correlations between lower SD at a higher number of MM cells per well and higher levels of bone marrow involvement (supplemental Figure 4A-D). In one sample with sufficient material, decreasing the number of MNCs per well from 90 000 to 5000 resulted in only minimal effects on drug sensitivities (supplemental Figure 4E). We also assessed the effect of the cryopreservation on drug sensitivity and found that it made little difference (supplemental Figure 4F). Moreover, the sensitivity to some commonly used drug combinations was explored. We found benefit for drug combinations over their individual components for IMiDs and Dex in 2 of 4 samples but not for the other combinations tested (supplemental Figure 5A-B). Notably, for the common PI/IMiD combinations, synergy is difficult to measure in vitro.27 Therefore, for this initial study, we focused the analyses on single drug effects.
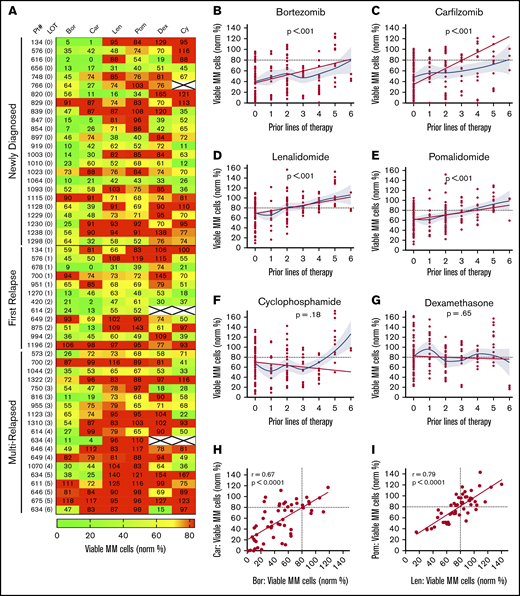
My-DST tracks drug resistance in MM patient primary samples from diagnosis through multiple relapses. (A) Heat map of single agent ex vivo drug testing in samples from patients with MM at single concentrations (PIs at 2.5 nM, IMiDs at 10 µM, Dex at 1 µM, and Cy at 3.75 µM). Samples with <80% of myeloma cells remaining after 48 hours of treatment were scored as sensitive to the drug (green), and samples with >80% of MM cells remaining after 48 hours of treatment were scored as resistant (red). Data represent the mean of 3 replicates. (B-C) Resistance to the PIs bortezomib and carfilzomib increased with prior LOT. (D-E) Resistance to the IMiDs lenalidomide and pomalidomide increased with prior LOT. (F-G) Cy and Dex sensitivity did not increase with prior LOT. (H-I) The ex vivo results among the PI and IMiD classes were highly correlated from sensitive to both (lower left) to resistant to both (upper right). However, differential results favoring one agent in each class (upper left and lower right) were observed. The straight lines and P values in panels B to G represent linear mixed model regression results, and the blue lines represent locally estimated scatterplot smoothing nonlinear curve fits, with gray borders indicating the 95% confidence intervals. The straight lines in panels H and I represent linear regression results, with the r and P values from Pearson’s correlations.
My-DST tracks drug resistance in MM patient primary samples from diagnosis through multiple relapses. (A) Heat map of single agent ex vivo drug testing in samples from patients with MM at single concentrations (PIs at 2.5 nM, IMiDs at 10 µM, Dex at 1 µM, and Cy at 3.75 µM). Samples with <80% of myeloma cells remaining after 48 hours of treatment were scored as sensitive to the drug (green), and samples with >80% of MM cells remaining after 48 hours of treatment were scored as resistant (red). Data represent the mean of 3 replicates. (B-C) Resistance to the PIs bortezomib and carfilzomib increased with prior LOT. (D-E) Resistance to the IMiDs lenalidomide and pomalidomide increased with prior LOT. (F-G) Cy and Dex sensitivity did not increase with prior LOT. (H-I) The ex vivo results among the PI and IMiD classes were highly correlated from sensitive to both (lower left) to resistant to both (upper right). However, differential results favoring one agent in each class (upper left and lower right) were observed. The straight lines and P values in panels B to G represent linear mixed model regression results, and the blue lines represent locally estimated scatterplot smoothing nonlinear curve fits, with gray borders indicating the 95% confidence intervals. The straight lines in panels H and I represent linear regression results, with the r and P values from Pearson’s correlations.
Similar to results in the clinic, My-DST showed a pattern of gradually increasing resistance to IMiDs and PIs based on the extent of prior treatment the patient had received. Using a mixed linear model to account for repeated measures in some patients, increasing prior LOT showed increasing resistance to bortezomib (P < .001), carfilzomib (P < .001), lenalidomide (P < .001), and pomalidomide (P < .001) (Figure 2B-E). However, increasing resistance with rising prior treatment was not seen for Cy (P = .24) or Dex (P = .65) (Figure 2F-G). Because the development of drug resistance may not be linear, we also used locally estimated scatterplot smoothing curves to show the best nonlinear fit for sensitivity to each drug across LOT. These curves showed that the PI and IMiD results could be grouped according to LOT; that is, a stepwise increase in PI and IMiD drug resistance occurred between 0 or 1, 2 to 3, and 4 to 6 LOT (supplemental Figure 6A). Simultaneously, the frequency of significant differences between untreated control samples vs the PIs or IMiDs decreased across these LOT groups (supplemental Figure 6B-C). Overall, drug sensitivity gradually decreased until multi-drug resistance predominated after 4 LOT (supplemental Figure 6C). The clinical significance of these observations is that PIs and IMiDs are major drivers of resistance in MM, and that My-DST captures the resistance trends for those agents.
Through review of the assay results across the cohort, remarkable consistency was also noted between agents in the same class. The ex vivo sensitivity to bortezomib and carfilzomib was highly correlated (r = 0.67; P < .0001), and although occasional differential results were observed (Figure 2H), they were rarely significant (supplemental Figure 3A). The results for sensitivity to IMiDs were even more highly correlated (r = 0.79; P < .0001), with even fewer samples showing differential sensitivity (Figure 2I; supplemental Figure 3A). From these findings, we concluded that the tight class effects measured by My-DST show the reproducibility of the method.
To further evaluate drug resistance identified ex vivo by using My-DST, we next considered prior drug exposures of the samples. The treatment histories of the relapsed patients were diverse, but the first-line treatment included PI treatment in 23 of 24 patients, IMiD treatment in 12 of 24 patients, and Cy treatment in 10 of 24 patients. Most subsequent lines of therapy also included IMiDs and/or PIs (supplemental Figure 7A-B). Drug sensitivity results were therefore categorized based on treatment history for the relevant agents. Importantly, sensitivity to both IMiDs and PIs was significantly lower in samples from patients who had previously received treatment with those classes (P = .0007 and P = .037, respectively) (Figure 3A-B). In contrast, ex vivo sensitivity to Dex and Cy was unchanged in samples with prior clinical exposure (Figure 3C-D). Thus, prior clinical treatment of the patients with PIs and IMiDs affected their ex vivo drug sensitivity, effectively capturing the clinical context.
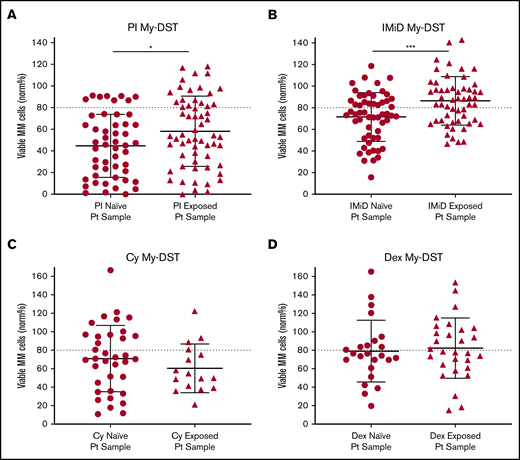
Prior clinical drug exposure results in decreased ex vivo myeloma drug sensitivity for PIs and IMiDs but no change in Dex or Cy sensitivity. (A) Ex vivo PI sensitivity measured by My-DST was significantly lower in bone marrow samples from patients who were relapsed or refractory to prior PI treatment. (B) IMiD sensitivity was also significantly lower in bone marrow samples from relapsed or refractory patients with a history of IMiD treatment. (C) No difference was observed in Cy sensitivity between samples from patients with prior clinical Cy exposure vs those who were Cy naive. (D) Dex sensitivity was also not different between samples from patients with prior clinical Dex exposure vs those who were Dex naive. Data points represent the means from each individual sample. Comparisons were made by using the Mann-Whitney U test (A) or 2-tailed Student t test (B-D). Pt, patient. *P < .05; ***P < .001.
Prior clinical drug exposure results in decreased ex vivo myeloma drug sensitivity for PIs and IMiDs but no change in Dex or Cy sensitivity. (A) Ex vivo PI sensitivity measured by My-DST was significantly lower in bone marrow samples from patients who were relapsed or refractory to prior PI treatment. (B) IMiD sensitivity was also significantly lower in bone marrow samples from relapsed or refractory patients with a history of IMiD treatment. (C) No difference was observed in Cy sensitivity between samples from patients with prior clinical Cy exposure vs those who were Cy naive. (D) Dex sensitivity was also not different between samples from patients with prior clinical Dex exposure vs those who were Dex naive. Data points represent the means from each individual sample. Comparisons were made by using the Mann-Whitney U test (A) or 2-tailed Student t test (B-D). Pt, patient. *P < .05; ***P < .001.
Ex vivo drug sensitivity of Dara
We next analyzed Dara by using My-DST. When IMiD and PI resistance develops, Dara is invaluable for salvage.3,4 Dara activity is due in part to ADCC, which is absent in CD138-selected cultures.15-17 Based on the ex vivo dose–response relations with Dara, a concentration of 20 nM was selected for further screening at a single concentration (Figure 4A). In Dara-exposed patient samples, polyclonal anti-CD38 antibody was used to prevent antigen masking (supplemental Figure 8A). In our cohort, Dara sensitivity was measured in 15 newly diagnosed, 21 relapsed/Dara-naive, and 5 Dara-exposed patient samples (Figure 4B). Similar activity occurred in newly diagnosed and relapsed samples from Dara-naive patients, but resistance was clear in Dara-exposed patients (P = .003) (Figure 4C). Resistance to Dara exhibited a significant correlation with LOT (P = .013), although there was a relatively low number of Dara-exposed samples (supplemental Figure 8B). Thus, Dara activity is measurable by using My-DST and is diminished in patients with clinical resistance.
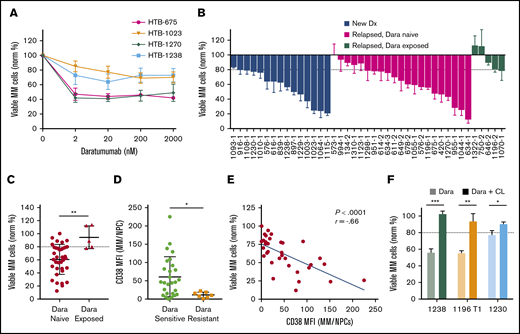
My-DST distinguishes between resistance and sensitivity to the monoclonal antibody Dara. (A) Primary MM cells exhibit a dose-dependent reduction in viable MM cells after 48 hours ex vivo culture in the presence of Dara. (B) Waterfall plot of the ex vivo response to 20 nM Dara among newly diagnosed samples (blue bars) is similar to relapsed, Dara-naive patients (magenta bars), but Dara-exposed patients exhibited much less response (green bars). (C) The ex vivo sensitivity in Dara-naive samples was significantly better than samples from patients with prior exposure. (D) The CD38 expression levels were significantly higher in MM cells from samples scored as Dara sensitive than in MM cells that were scored as Dara resistant. (E) Ex vivo reduction of primary MM cells exposed to Dara correlated with the level of CD38 expression by flow cytometry. (F) The ex vivo daratumumab reduction in primary MM cells was largely reversed by macrophage deactivation with clodronate-containing liposomes (CL). Data represent means ± SD, comparisons by 2-tailed Student t test. *P < .05; **P < .01; ***P < .001. The blue line in panel E represents linear regression results, with the r and P values from Pearson’s correlations. Dx, diagnosis; MFI, median fluorescence intensity; NPC, nonplasma cells.
My-DST distinguishes between resistance and sensitivity to the monoclonal antibody Dara. (A) Primary MM cells exhibit a dose-dependent reduction in viable MM cells after 48 hours ex vivo culture in the presence of Dara. (B) Waterfall plot of the ex vivo response to 20 nM Dara among newly diagnosed samples (blue bars) is similar to relapsed, Dara-naive patients (magenta bars), but Dara-exposed patients exhibited much less response (green bars). (C) The ex vivo sensitivity in Dara-naive samples was significantly better than samples from patients with prior exposure. (D) The CD38 expression levels were significantly higher in MM cells from samples scored as Dara sensitive than in MM cells that were scored as Dara resistant. (E) Ex vivo reduction of primary MM cells exposed to Dara correlated with the level of CD38 expression by flow cytometry. (F) The ex vivo daratumumab reduction in primary MM cells was largely reversed by macrophage deactivation with clodronate-containing liposomes (CL). Data represent means ± SD, comparisons by 2-tailed Student t test. *P < .05; **P < .01; ***P < .001. The blue line in panel E represents linear regression results, with the r and P values from Pearson’s correlations. Dx, diagnosis; MFI, median fluorescence intensity; NPC, nonplasma cells.
We next examined how ex vivo Dara activity measurements were related to its mode of action. Consistent with its distinct mechanism, Dara treatment effects did not correlate with those of the other drugs tested (supplemental Figure 8C). Clinical Dara response reportedly correlates with target CD38 expression.28 Consistent with this finding, Dara-resistant MM cells had lower CD38 levels (P = .02), and Dara sensitivity correlated with CD38 levels (Figure 4D-E). In 3 of 3 Dara-sensitive samples, its activity was partially reversed by treatment with clodronate-containing liposomes that block macrophage ADCC (Figure 4F). Interestingly, Dara had no effect on the nonplasma cells in MM samples, or in plasma cells from normal donors (supplemental Figure 8D-E), which is consistent with a lack of clinical hypogammaglobulinemia from this agent.3,4,29 In sum, the ex vivo activity of Dara was similar to its clinical activity and was related to its known biomarkers.
Clinical outcomes correlate with My-DST results
To assess the clinical impact of sensitivity to individual agents comprising the subsequent LOT, patient outcomes after My-DST were measured. Only patients who were subsequently treated exclusively with drugs tested in My-DST were included in these analyses (Table 1), and patients who received other drugs were excluded. First, we assessed how pretreatment My-DST results compared with depth of subsequent clinical response based on the change in MM-specific paraprotein using International Myeloma Working Group criteria after 4 treatment cycles. The cumulative proportional effect of the drugs received clinically was calculated by taking the product of the individual ex vivo drug effects. This My-DST combination effect correlated strongly with the depth of clinical response (r = 0.58; P = .0006) (Figure 5A). Using a clinical response cutoff of a 50% decrease in disease (partial response [PR]) or better, a combination effect cutoff of ≤50% was 96% sensitive (22 of 23 true positive) and 88% specific (6 of 7 true negative). Further evaluation of the false-negative and false-positive cases was instructive. Patient #1044 had a less deep-than-predicted response, which may have been related to an already low-level M-spike at the time My-DST was performed (0.8). On the other hand, patient #1238 achieved a complete response (CR) despite having a relatively low proportional ex vivo combination effect, which is likely explained by synergism between the bortezomib, lenalidomide, and Dex received. Thus, although drug synergy was not measured directly in the current design, My-DST was still sensitive and specific for the resulting clinical response.
Comparison of ex vivo results vs clinical outcomes for patients treated with agents tested in My-DST
| Patient # | HR | Prior treatment lines | My-DST of drugs in next LOT, Norm% | My-DST comb | Drugs sens | Clinical resp | |||||
|---|---|---|---|---|---|---|---|---|---|---|---|
| 134 | 1q+ | None | V 5 | D 129 | 6 | 1 | −71 | ||||
| 576-1 | None | None | V 35 | C 116 | D 70 | 28 | 2 | −72 | |||
| 616 | None | None | V 2 | C 88 | D 19 | 0.3 | 2 | −100 | |||
| 656 | 1q+ | None | V 13 | C 45 | D 51 | 3 | 3 | −100 | |||
| 748 | None | None | V 45 | C 67 | D 81 | 24 | 2 | −100 | |||
| 820 | 1q+ | None | V 56 | R 16 | D 165 | 15 | 2 | −100 | |||
| 829 | None | None | V 89 | R 74 | D 70 | 46 | 2 | −79 | |||
| 839 | None | None | V 47 | C 113 | D 70 | 37 | 2 | −100 | |||
| 847* | None | None | R 81 | V15 | D 39 | 5 | 1 | −100 | |||
| 854 | t(4;14) | None | V 7 | C 65 | D 42 | 2 | 3 | −99 | |||
| 897 | None | None | V 46 | C 72 | D 84 | 28 | 2 | −78 | |||
| 1003 | 1q+ | None | V 14 | C 63 | D 84 | 7 | 2 | −100 | |||
| 1023 | 1q+ | None | V 73 | R 76 | D 74 | 41 | 3 | −97 | |||
| 1064 | None | None | V 10 | C 26 | D 33 | 1 | 3 | −100 | |||
| 1093 | 1q+ | None | V 52 | C 103 | R 36 | D 85 | 16 | 2 | −80 | ||
| 1115 | None | None | V 90 | R 71 | D 74 | 47 | 2 | −72 | |||
| 1128 | None | None | V 64 | C 110 | D 90 | 63 | 1 | +15 | |||
| 1229 | None | None | V 48 | R 73 | D 95 | 33 | 2 | −100 | |||
| 1230 | 1q+ | None | V 25 | R 93 | D 70 | 16 | 2 | −94 | |||
| 1238 | None | None | V 56 | R 94 | D 138 | 72 | 2 | −100 | |||
| 700-1 | 1q+ | VCD/SCT | R 73 | D 145 | 105 | 1 | −15 | ||||
| 951 | None | VRD/Mul/tSCT/cRVD/mRD | Dar 78 | D 79 | 61 | 2 | −42 | ||||
| 1270 | 1q+ | KRD/SCT/mR | Dar 43 | V 13 | D 53 | 3 | 3 | −16 | |||
| 573 | 1q+ | VRD/Mul/SCT/mR, KRD | C 71 | P 68 | D 58 | 28 | 3 | −80 | |||
| 700-2 | 1q+ | VCD/SCT/Ob/RD | V 87 | D 81 | 70 | 0 | +38 | ||||
| 1044 | 1q+ | VRD/SCT/cVRD/mVD, EloRD/Obs | Dar 26 | P 67 | D 53 | 9 | 3 | −28.5 | |||
| 1322 | None | VRD, DarPD | Dar 114 | V 72 | P 88 | D 97 | 70 | 1 | +185 | ||
| 955 | 1q+ | Unk/Mul/SCT/mRD/Obs, RD, KRD | P 65 | D 71 | 46 | 2 | −50 | ||||
| 614-2 | 1q+ | VCD/Mul/KRD/SCT/cVRD, EloRD, PD | Dar 78 | V 27 | D 90 | 19 | 2 | −89 | |||
| 649-2 | None | VCD, KRD/SCT/mR, BiRD, PemPD | Dar 65 | V 82 | D 94 | 50 | 1 | −25 | |||
| 634-3 | None | VD/SCT, RD, VD, KD, ID, PemPD | Dar 76 | V 47 | D 15 | 5 | 3 | −73 | |||
My-DST of drugs in next LOT, ex vivo effects of the drugs subsequently received in clinical treatment (numbers represent the number of viable MM cells normalized as percentage of untreated control samples). My-DST comb, the proportional ex vivo effect calculated the product of the individual mean effects for the drugs received in clinical treatment. Drugs Sens, the number of drugs received in clinical treatment that were scored as sensitive in My-DST. Clinical resp, clinical response shown as the percent change in paraprotein after 4 cycles.
Bi, Biaxin; c, consolidation; C, cyclophosphamide; D, dexamethasone; Dar, daratumumab; I, ixazomib; K, carfilzomib; L, line; m, maintenance; Mul, multiple agent inpatient chemotherapy; Ob, observation; P, pomalidomide; Pan, panobinostat; Pem, pembrolizumab; R, Revlimid (lenalidomide); SCT, autologous stem cell transplant with melphalan; Unk, unknown; V, Velcade (bortezomib).
Patient #847 was treated with 2 cycles of RD, followed by switch to VD.
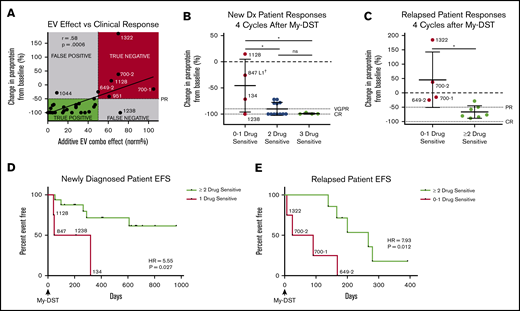
Pretreatment My-DST results before treatment correlate with the subsequent depth and duration of clinical response. (A) The proportional combination effect (“My-DST Comb” from Table 1) vs the depth of clinical response after 4 cycles of treatment. True positives were defined as when the combined ex vivo effect was <50% and the clinical response was at least a PR (50% decrease). True negatives were defined as when the combined ex vivo effect was >50% and a PR was not achieved. (B) Depth of clinical response in newly diagnosed patients relative to the goals of a very good PR (VGPR, 90% decrease) and a CR (dotted lines) after receiving 4 cycles† of induction treatment categorized by the number of ex vivo sensitive drugs in My-DST. (C) Depth of clinical response in relapsed patients relative to the clinical goals of PR and CR (dotted lines) after receiving 4 cycles of treatment in the next LOT categorized by the number of ex vivo sensitive drugs in My-DST. (D) EFS was significantly longer on post–My-DST treatment of newly diagnosed patients treated when they received at least 2 drugs classified as sensitive according to My-DST. (E) Similarly, EFS for patients who were treated after My-DST was significantly longer in the relapsed setting when patients received at least 2 drugs classified by My-DST as sensitive. Clinical responses were measured after 4 subsequent treatment cycles, except in patient #847, who was assessed after 2 cycles due to subsequently changing treatment regimens. EFS data represent time to progression or change in therapy due to inadequate response. Data points are labeled with sample numbers for patients with notably less ex vivo or clinical responses, whereas the others are removed for clarity. Data represent means ± SD; comparisons were made with analysis of variance (B), Student t test (C), and Cox proportional hazard models to determine HR (D-E). *P < .05; **P < .01. EV, ex vivo; ns, not significant.
Pretreatment My-DST results before treatment correlate with the subsequent depth and duration of clinical response. (A) The proportional combination effect (“My-DST Comb” from Table 1) vs the depth of clinical response after 4 cycles of treatment. True positives were defined as when the combined ex vivo effect was <50% and the clinical response was at least a PR (50% decrease). True negatives were defined as when the combined ex vivo effect was >50% and a PR was not achieved. (B) Depth of clinical response in newly diagnosed patients relative to the goals of a very good PR (VGPR, 90% decrease) and a CR (dotted lines) after receiving 4 cycles† of induction treatment categorized by the number of ex vivo sensitive drugs in My-DST. (C) Depth of clinical response in relapsed patients relative to the clinical goals of PR and CR (dotted lines) after receiving 4 cycles of treatment in the next LOT categorized by the number of ex vivo sensitive drugs in My-DST. (D) EFS was significantly longer on post–My-DST treatment of newly diagnosed patients treated when they received at least 2 drugs classified as sensitive according to My-DST. (E) Similarly, EFS for patients who were treated after My-DST was significantly longer in the relapsed setting when patients received at least 2 drugs classified by My-DST as sensitive. Clinical responses were measured after 4 subsequent treatment cycles, except in patient #847, who was assessed after 2 cycles due to subsequently changing treatment regimens. EFS data represent time to progression or change in therapy due to inadequate response. Data points are labeled with sample numbers for patients with notably less ex vivo or clinical responses, whereas the others are removed for clarity. Data represent means ± SD; comparisons were made with analysis of variance (B), Student t test (C), and Cox proportional hazard models to determine HR (D-E). *P < .05; **P < .01. EV, ex vivo; ns, not significant.
Based on our findings, we hypothesized that patients would exhibit a deeper response to treatment if they were subsequently treated with an increasing number of drugs classified as sensitive according to My-DST. Patients at diagnosis who were treated with 3 drugs that were classified as sensitive according to My-DST reached a CR (n = 3) or a very good PR (90% decrease in paraprotein, n = 1). Patients treated with 2 drugs classified as sensitive by using My-DST achieved a CR (n = 7) or a PR (n = 4). In contrast, patients treated with only 1 drug classified as sensitive by using My-DST had a significantly less deep response (P = .013 or .011 compared with treatment with 2 or 3 drugs classified as sensitive by using My-DST, respectively), with 3 of 4 patients achieving a PR or less (Figure 5B). Only patient #1238 exhibited a substantially deeper response than predicted by using My-DST; this finding perhaps occurred because of unmeasured synergism between the agents the patient received. Similarly, relapsed patients receiving ≤1 drug classified as sensitive according to My-DST exhibited a significantly less deep response than patients who received ≥2 drugs classified as sensitive (P = .013), and My-DST results predicted 4 of 5 patients who subsequently progressed or failed to achieve at least PR (Figure 5C). This finding is especially important for elderly or frail patients, who frequently receive 2-drug regimens with less margin for error.
We also compared how treatment with drugs classified as sensitive by My-DST influenced the subsequent event-free survival (EFS), defined as time to progression or change in therapy due to inadequate response. The median follow-up times for the newly diagnosed and relapsed patients were 624 days (95% confidence interval [CI], 210-708) and 168 days (95% CI, 25-280), respectively. Newly diagnosed patients who received only 1 drug classified as sensitive by My-DST had a significantly shorter EFS according to Cox regression than patients who received ≥2 drugs classified as sensitive (hazard ratio [HR], 5.55; 95% CI, 1.22-25.32; P = .027) (Figure 5D). A similar difference occurred in the relapsed setting, with a significantly shorter EFS for patients who received 0 or 1 drug classified as sensitive by My-DST than patients who received ≥2 drugs classified as sensitive (HR, 7.93; 95% CI, 1.39-45.24; P = .012) (Figure 5E). We have not yet observed a difference in overall survival among the patients whose samples were analyzed by using My-DST. In further studies, it will be important to repeat these analyses in a predetermined, uniform treatment protocol.
Because the patient groups we compared were not prestratified, we also examined whether known poor prognostic factors could have skewed our analyses of drug sensitivity and clinical outcomes. In both the newly diagnosed and relapsed patients, relevant characteristics were not significantly different between patients receiving 1 drug classified as sensitive by My-DST compared with those receiving ≥2 classified as sensitive (supplemental Tables 4-5), suggesting that drug sensitivity was an independent factor in patients with poorer outcomes. Thus, overall, My-DST identified a lack of sensitivity to the individual agents when poor responses were observed, independent of conventional high-risk factors, in both newly diagnosed and relapsed patients.
Discussion
Although MM remains largely incurable using standard approaches, patient quality of life and survival are substantially affected by treatment choices and sequences. However, little progress has been made in the development of assays or biomarkers useful for measuring drug resistance to available agents in a given patient. MM is an ideal setting to apply drug sensitivity testing because liquid biopsy specimens are readily obtained, and many similarly effective agents are clinically available. Herein, we describe our development of My-DST as an approach that can reproducibly measure the ex vivo response of a patient’s MM cells to available agents within 48 hours. By profiling patients at different points along the disease course, My-DST captured acquired resistance to PIs, IMiDs, and Dara, which has been clinically appreciated but challenging to quantify until now. Although our current analyses using My-DST do not include drug combinations, measurement of single drug effects was still sensitive and specific for predicting clinical response. Ultimately, the clinical predictiveness of My-DST will require further optimization, including validation using a prospective, stratified study design.
To optimize My-DST, bulk MNCs were used to preserve the microenvironment and to avoid the mechanical stress that accompanies immunoaffinity-based selection, and we observed substantially improved baseline MM cell viability. Although CD138 selection is well suited to perform MM gene sequencing and expression studies of myeloma, it damages the MM cells, hindering their capacity to be used in studies that measure drug effects. Due to the heterogeneity of MNC cultures, multiparameter flow cytometry was used to measure MM-specific cytotoxicity at the 48-hour time point when MM viability exhibited transient stabilization. This short-term culture approach has the advantages of rapid turnaround time, while still reproducibly measuring drug effects on primary MM cells across the drug panel tested.
In My-DST, ex vivo resistance to PIs and IMiDs increased gradually along with disease progression. Interestingly, acquired IMiD and PI resistance generally started after 2 to 3 LOT, and then worsened after 4 to 6 LOT, reflecting the frequent, repeated selective pressure we apply to our patients’ disease using these agents. In addition, prior IMiD and PI treatment influenced drug sensitivity measured by using My-DST, confirming the measurement of clinical resistance. Conversely, resistance to Dex and Cy was not observed with prior clinical treatment or with increasing LOT. This is surprising for Dex, as it is used in essentially all regimens and in each LOT. However, prior in vitro studies have indicated that MM cells may enter a state of transient steroid resistance that can be reversible, most commonly through altered expression of the glucocorticoid receptor.30-32 This transient resistance may explain the lack of relation between ex vivo Dex results and prior exposure or lines of therapy. For Cy, retained sensitivity in the multi-relapsed setting is less surprising because patients are much less exposed to this agent, and our cohort included only a small number of patients who were clinically refractory to Cy. Thus, we conclude from the ex vivo results of this cohort that the PIs and IMiDs were the major drivers of drug resistance in our patients.
Using My-DST, ex vivo Dara sensitivity was also measurable and showed a decrease after clinical exposure. The mechanisms of action for Dara are multifactorial, inducing ADCC, complement-dependent cytotoxicity, and induction of apoptosis, possibly from blockade of CD38 function.33-36 Thus, measuring Dara activity ex vivo requires the presence of immune cells.15-17 We found that ex vivo Dara activity was at least partially macrophage dependent. Dara has rapidly become an essential agent in the treatment of relapsed MM.37 In addition, the benefits of incorporating Dara into front-line therapy are emerging.5 Dara efficacy has been shown to correlate with CD38 levels, and Dara treatment results in CD38 downregulation.28 After the patient is off therapy for months, their MM cells then recover CD38. Thus, it will be important to determine whether and when Dara-exposed patients regain their sensitivity after being off therapy.
Having a functional assay for effectively monitoring drug resistance would complement currently available myeloma clinical tests. Fluorescence in situ hybridization is routinely used to stage disease in patients with high-risk genomic abnormalities and to monitor disease evolution.38,39 MM cell proliferation has been investigated as a marker of aggressiveness and can be measured by using Ki-67 staining or by the plasma cell labeling index.40,41 For quantifying deep responses, measurement of minimal residual disease by optimized flow cytometry or next-generation sequencing correlates with remission time.42,43 These tests all help risk-stratify the spectrum of patients with myeloma, but none directly informs treatment selection. For the first time, our study validates the intuitive notion that poor responders have drug resistance to most or all of the drugs they receive. Thus, the functional readout of drug sensitivity provided by My-DST would serve as a valuable addition to current clinical testing and would provide more utility in therapeutic decision-making than current approaches. Major benefits to patients could include decreased stress, cost, and complications, and increased length of survival.
Going forward, the prognostic impact and potential for personalized medicine with My-DST will need to be validated in a prospective clinical trial. Although this initial study focused on sensitivities to individual agents, My-DST may be further improved by testing for synergistic drug combinations, by adding additional drug concentrations, and by including drugs that improve combination activity, such as elotuzumab. These additional steps may further improve the correlation between the ex vivo responses measured by My-DST and the clinical responses. With the proof of concept in place, it will also be important to expand the panel of drugs tested to include additional agents such as melphalan, ixazomib, bendamustine, selinexor, and melflufen. In addition, the rapid development of new drugs for MM has continued, with multiple next-generation immunotherapies showing promise in clinical trials.44-46 The continued expansion of anti-myeloma therapies makes My-DST an increasingly important tool for determining which treatment(s) will be most effective for treating individual patients with MM.
For original data, please contact the corresponding author, Daniel W. Sherbenou (daniel.sherbenou@cuanschutz.edu).
Acknowledgments
The authors acknowledge the Hematology Clinical Trials Unit at the University of Colorado for tissue bank and regulatory support and Shelby Bearrows for technical assistance. The authors also thank Heidi Chial (BioMed Bridge, LLC) for scientific editing.
This work was supported by grants from the Colorado Clinical & Translational Sciences Institute (CO-PILOT grant) (D.W.S.), the National Comprehensive Cancer Network Foundation (2016 Young Investigator Award) (D.W.S.), and the National Institutes of Health, National Cancer Institute (K08CA222704) (D.W.S.).
The authors dedicate this article to the memory of David L. Kessenich, whose passion and support for their research program will inspire them in perpetuity.
Authorship
Contribution: D.W.S., Z.J.W., and M.J.V. designed experiments; Z.J.W. and M.J.V. performed experiments; B.M.S., C.L.-A., and B.E.P. assisted with methods development and data interpretation; D.A. and A.H. provided statistical input, and performed survival and linear mixed model analyses; D.W.S., T.M.M., P.A.F., and C.A.S. contributed patient samples and advised on clinical correlations; C.T.J. and B.E.P. advised on concept development; D.W.S. and Z.J.W. wrote the manuscript; D.W.S. supervised the research and finalized the manuscript; and all authors contributed to manuscript revision.
Conflict-of-interest disclosure: C.A.S. consults for AbbVie. The remaining authors declare no competing financial interests.
Correspondence: Daniel W. Sherbenou, Division of Hematology, Department of Medicine, University of Colorado Anschutz Medical Campus, 12700 E 19th Ave, Box B170, Aurora, CO 80045; e-mail: daniel.sherbenou@cuanschutz.edu.

