

Key Points
FDG PET contributes to accurate staging of BMI in FL.
Detection of BMI by PET carries significant and independent prognostic value.

Abstract
In follicular lymphoma (FL), detection of bone marrow (BM) involvement (BMI) by 18F-fluorodeoxyglucose (FDG) positron emission tomography (PET)/computed tomography (CT) improves the accuracy of staging vs BM biopsy (BMB) alone. Our objective was to determine the diagnostic utility of PET for BMI FL and the prognostic value of BMI by PET (positive PET result [PET+]). Records of patients (2002-2016) with PET and BMB at the time of initial treatment were reviewed. BMI was identified by positive BMB result (BMB+) and/or unifocal or multifocal BM FDG uptake on blindly reviewed PET scans with no corresponding CT abnormality (PET+). Among 261 patients, BMI was diagnosed in 78 patients (29.9%) by PET+, in 81 patients (31.0%) by BMB+, and in 113 patients (43.3%) by either PET+ or BMB+. PET+ upstaged 24 patients to stage IV, including 10 from stages I or II to stage IV. Median duration of follow-up was 6.0 years (range, 0-16.6 years). In univariate analysis, a high Follicular Lymphoma International Prognosis Index (FLIPI) score, PET+, and BMB+ correlated with shorter progression-free survival (PFS; all P ≤ .03), and high FLIPI, PET+, and combined PET+ and BMB+ with shorter overall survival (OS; all P ≤ .01). In multivariate analysis, PET+ was the only independent predictor of PFS, whereas high FLIPI score and PET+ predicted OS (P ≤ .03). Combined PET and BMB identify BMI more accurately than either BMB or PET alone, but BMB rarely adds critical information. For patients initiating treatment of FL, identification of BMI by PET is predictive of PFS and OS.
Introduction
Bone marrow (BM) involvement (BMI) commonly impacts prognosis and treatment of patients with lymphoma. BMI is an important factor in most clinical risk-stratification indices, including the International Prognostic Index (IPI) and its successors for aggressive non-Hodgkin lymphoma and diffuse large B-cell lymphoma (DLBCL),1-3 the Follicular Lymphoma International Prognostic Index (FLIPI) and new FLIPI-2 for follicular lymphoma (FL),4,5 and the International Prognostic Score (IPS) for advanced Hodgkin lymphoma (HL).6 Importantly, the presence of BMI may change the choice of treatment strategy, especially in patients who were thought to have early-stage disease before performing BM evaluation.
For many decades, BM biopsy (BMB) has been considered the gold standard for the evaluation of BMI in lymphomas. However, the major shortcoming of BMB as a tool to detect BMI is inadequate sampling of the entire BM. BMI defined by a positive BMB result (BMB+) has been reported in 4% to 16% of newly diagnosed HL patients,7 15% of newly diagnosed DLBCL patients, and 52% to 55% of newly diagnosed FL patients in 3 recent large prospective trials.8-11
Several recent studies have suggested that 18F-fluorodeoxyglucose (FDG)-positron emission tomography (PET)/computed tomography (CT) possesses adequate sensitivity for the detection of BMI in HL (range, 50% to 100%),12-15 and DLBCL (range, 70.8% to 95.8%).7,16-20 Consequently, the published recommendations for the initial evaluation, staging, and response assessment of HL and non-Hodgkin lymphoma state that focal skeletal FDG uptake is highly sensitive for lymphomatous BMI in aggressive lymphomas, including DLBCL, and may obviate the need for BMB.21,22 In contrast, several studies have reported that the detectability of BMI by PET for FL varies widely, with sensitivities ranging between 31% and 68% in several smaller studies20,23-25 ; in a larger retrospective study in 142 patients, it was 34.3%.26 Therefore, PET is not generally used to diagnose BMI in FL. However, the reported wide range of PET-detection rates for BMI raises questions about applied methodologies and possible selection bias. Whereas PET adds to baseline staging information for many patients with FL,7 it is essential for patients with early-stage disease in whom identification of advanced-stage disease (for instance by proving BMI) on PET may alter management. Therefore, we retrospectively analyzed our own database of patients with FL to evaluate the utility and clinical relevance of PET for detecting BMI in a large number of patients with sufficient follow-up.
Methods
Patient selection
This retrospective study was approved by the institutional review board, and the requirement for informed consent was waived. Patients were identified from our institutional database. We retrieved data from 2366 lymphoma patients who underwent both combined FDG-PET/CT and BMB at our institution between 2002 and 2016. Patients who underwent PET at outside facilities were excluded. Patients were included in the current analysis when meeting the following criteria: (a) aged 18 years or older and undergoing pretherapy staging for newly diagnosed lymphoma; (b) diagnosis of FL and histologic subtype confirmed by a staff hematopathologist at our institution; (c) both PET and BMB were performed as part of clinical staging (within 6 weeks of each other) at our institution; and (d) no malignancy other than lymphoma at the time of staging. The patients’ medical records were reviewed, and the following information was documented: age at diagnosis, sex, histology, grade, stage by Ann Arbor and (where applicable) modified Lugano staging system, assignment to 1 of the 3 risk groups defined by FLIPI and FLIPI-2 criteria, initial treatment plan, start date of treatment, and date and cause of death or documented date of last visit.
FDG-PET/CT
All patients fasted for at least 6 hours and had blood glucose levels of <200 mg/dL prior to IV injection of FDG (12-15 mCi; 444-555 MBq). During the subsequent 60- to 90-minute uptake period (median, 69 minutes; interquartile range, 52-104 minutes), patients drank oral contrast per institutional protocol. Scans were obtained on 1 of several Discovery PET/CT systems (GE Healthcare). Following initial scout view and low-dose CT (tube voltage, 120-140 kV; tube current, ∼80 mA), PET-emission data were acquired from the mid-skull to the mid-thigh with the patient in supine position. PET images were obtained for 3 minutes per bed position using a 128 × 128 matrix and a 70-cm axial field of view.
Scan interpretation
All PET/CT images were reviewed using the Hybrid Viewer display and analysis application (Hermes Medical Solutions). PET studies were reinterpreted independently by 2 nuclear medicine physicians (R.N. and L.M.) with 10 years of PET/CT experience. If the conclusions of the 2 reviewers differed, the findings were discussed, and a consensus was reached. At the time of image review, these investigators were blinded to findings on BMB and clinical follow-up. PET scans were assessed visually and rated positive for BMI if at least 1 site of focal BM FDG uptake was seen, with an intensity exceeding that in the normal liver (a criterion that is often used in several types of lymphoma16,20 ) and not attributable to any other cause (eg, benign osseous or cartilaginous lesions). BMI by PET was characterized as unifocal (a single BM PET lesion), bifocal (2 BM PET lesions), multifocal (3 or more BM PET lesions), or focal with diffuse uptake. Lesion location(s) were noted. Diffusely increased FDG uptake in the BM was visually categorized as pure diffuse uptake without focal lesions higher than normal liver (Figure 1). Pure diffuse FDG uptake was documented but not interpreted as BMI.
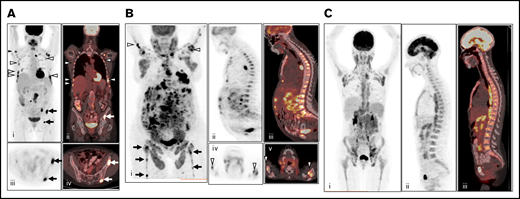
Patterns of FDG uptake in BM. (A) Example of multifocal BM FDG uptake (right humerus, multiple bilateral ribs, and iliac bone) on baseline PET/CT without diffuse FDG uptake, considered positive for BMI (i, maximum intensity projection; ii, coronal fused PET/CT; iii, axial PET; and iv, axial fused PET/CT). (B) Example of multifocal BM FDG uptake (bilateral humeri, femora, and iliac bone) with additional diffuse uptake greater than liver reference on baseline PET/CT, considered positive for BMI (i, maximum intensity projection; ii, sagittal PET; iii, fused PET/CT; iv, axial PET; and v, fused PET/CT). (C) Example of pure diffuse FDG uptake pattern, considered negative for BMI (i, maximum intensity projection; ii, sagittal PET; and iii, sagittal fused PET/CT).
Patterns of FDG uptake in BM. (A) Example of multifocal BM FDG uptake (right humerus, multiple bilateral ribs, and iliac bone) on baseline PET/CT without diffuse FDG uptake, considered positive for BMI (i, maximum intensity projection; ii, coronal fused PET/CT; iii, axial PET; and iv, axial fused PET/CT). (B) Example of multifocal BM FDG uptake (bilateral humeri, femora, and iliac bone) with additional diffuse uptake greater than liver reference on baseline PET/CT, considered positive for BMI (i, maximum intensity projection; ii, sagittal PET; iii, fused PET/CT; iv, axial PET; and v, fused PET/CT). (C) Example of pure diffuse FDG uptake pattern, considered negative for BMI (i, maximum intensity projection; ii, sagittal PET; and iii, sagittal fused PET/CT).
BMB
All cases had untargeted routine BM biopsy and aspirate. One hundred one patients underwent BMB at the right iliac crest, 111 at the left iliac crest, and 47 at bilateral iliac crests; the location of biopsy was not specified for 2. Analysis was carried out by experienced hematopathologists at our institution. BMB specimens were obtained within 6 weeks of staging PET. BMB involvement was assessed histologically and by immunohistochemistry for CD20.
Statistical analyses
Continuous variables were expressed as median and range, and categorical variables as numbers and percentages. The 2-sample Student t test was used for 2-group comparisons. Concordance between visual assessments of 2 observers was evaluated using κ statistics. In a first step, sensitivity, specificity, accuracy, positive predictive value (PPV), and negative predictive value (NPV) of PET for detecting BMI as well as the respective 95% exact binomial confidence intervals (CIs) were calculated using the BMB results as reference standard. In a second step, the diagnostic performance was assessed considering both PET findings and BMB as gold standard (either histologic lymphoma in the BMB or PET BMI irrespective of BMB). Moreover, as a secondary end point, survival was estimated using Kaplan-Meier methods. Progression-free survival (PFS) was obtained by calculating the time between the date of initial biopsy and diagnosis to disease progression, relapse, or death from any cause. Overall survival (OS) was defined as the time from initial biopsy to the date of death. Patients alive (or alive without progression for PFS) were censored at their date of last follow-up. The Cox proportional hazards model was used to compare survival according to clinical parameters (sex, histological grade, FLIPI, and FLIPI-2 score), and BMI as detected by PET or BMB. Variables with P < .20 on univariate analyses were selected to enter the multivariate analyses to identify independent predictors of PFS and OS. The estimated hazard ratios (HRs) are presented with 95% CI. P < .05 was considered statistically significant. The statistical analyses were performed using IBM SPSS for Windows software package, version 25.0 (Somers) and R version 3.5.0 (R Core Team, Vienna, Austria). Survival curves were drawn using the R package prodlim.27
Results
Patient characteristics
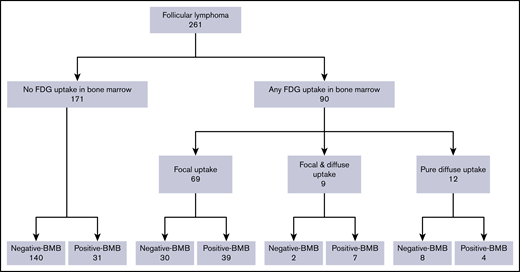
From the initial sample, we identified 261 patients with FL meeting our inclusion criteria (Figure 2). The clinical characteristics of these patients are summarized in Table 1. In brief, the cohort consisted of 135 men and 126 women with a median age of 58.1 years. One hundred twenty patients (46.0%) had stage IV disease, and 70 (26.8%) had stage I disease (based on combined BMB and PET/CT results). Most patients had grade 1-2 disease (78.5%) and had a low-risk FLIPI score (49.2%; Table 1). The most common first-line chemotherapy regimen for advanced-stage patients was rituximab with cyclophosphamide, doxorubicin, vincristine, and prednisone, whereas 56 of the 93 patients (60.2%) with early-stage disease underwent radiotherapy to involved sites only.

Clinical characteristics of enrolled FL patients (n = 261)
| Characteristic | Datum | Percentage |
|---|---|---|
| Age, median (range), y | 58.1 (19.7-90.5) | |
| Male:female ratio | 135:126 | |
| Stage at diagnosis | ||
| I/II/III/IV | 70/24/47/120 | 26.8/9.2/18.0/45.9 |
| FLIPI | ||
| Low/intermediate/high/missing data | 127/61/70/3 | 49.2/23.6/27.1* |
| FLIPI-2 | ||
| Low/intermediate/high/missing data | 20/34/25/182 | 25.3/43.0/31.6* |
| Grade | ||
| 1,2/3A/unknown | 197/54/10 | 78.5/21.5* |
| Treatment | ||
| Rituximab-CHOP | 89 | 34.1 |
| Radiation | 61 | 23.4 |
| Rituximab-bendamustine | 29 | 11.1 |
| Observation | 21 | 8.0 |
| Rituximab | 16 | 6.1 |
| Rituximab-CVP | 13 | 4.6 |
| Radiation, R-CHOP | 4 | 1.5 |
| Radiation, rituximab | 2 | 0.8 |
| CHOP | 2 | 0.8 |
| Rituximab-EPOCH | 2 | 0.8 |
| Biaxin/chlorambucil | 1/1 | 0.4/0.4 |
| Rituximab-CHEP/rituximab-CDOP/rituximab-GCVP/DA-EPOCH-rituximab | 1/1/1/1 | 0.4/0.4/0.4/0.4 |
| Rituximab, IFN a/rituximab, fludarabine/rituximab, Cytoxan,† prednisone/rituximab, fludarabine, mitoxantrone, Decadron†/methotrexate | 1/1/1/1/1 | 0.4/0.4/0.4/0.4/0.4 |
| Lost follow-up | 11 | 4.2 |
| Interval between initial biopsy and treatment, median (range), mo | 2.1 (0-244.5) 11 missing | |
| Follow-up duration of all patients, median (range), y | 5.9 (0-16.6) | |
| Progression/death | 69/30 | 26.4/11.5 |
CDOP, cyclophosphamide, pegylated liposomal doxorubicin, vincristine, and prednisone; CHEP, cyclophosphamide, doxorubicin, etoposide, and prednisone; CHOP, cyclophosphamide, doxorubicin, vincristine, and prednisone; CVP, cyclophosphamide, vincristine, and prednisone; DA-EPOCH, dose-adjusted etoposide, prednisone, vincristine, cyclophosphamide, doxorubicin; GCVP, gemcitabine, cyclophosphamide, vincristine, and prednisolone; IFN, interferon; R-CHOP, rituximab with CHOP.
Percentages pertain to patients with available data.
Brand (generic): Cytoxan (cyclophosphamide); Decadron (dexamethasone).
Detection of BMI by PET or BMB
There was almost perfect agreement between the 2 readers for diagnosing BMI on PET using our criteria (κ statistics = 0.87; 95% CI, 0.80-0.92). Thirty-two (12.2%) of the 261 patients were diagnosed with BMI by PET alone, 35 patients (13.4%) by BMB alone, and 113 patients (43.3%) by either PET or BMB (Table 2).
Correlation between PET findings and BMB results
| PET/CT-assessed staging results | Patients with negative BMB (n = 180), n (%) | Patients with positive BMB (n = 81), n (%) | P for difference between groups |
|---|---|---|---|
| PET/CT stage | <.001 | ||
| I | 70 (38.9) | 4 (4.9) | |
| II | 24 (13.3) | 2 (2.5) | |
| III | 47 (26.1) | 26 (32.1) | |
| IV | 39 (21.7) | 49 (60.5) | |
| Focal BM PET/CT lesions | <.001 | ||
| Unifocal | 8 (4.4) | 8 (9.9) | |
| Bifocal | 10 (5.6) | 6 (7.4) | |
| Multifocal | 12 (6.7) | 25 (30.9) | |
| With diffuse uptake (unifocal or multifocal uptake lesions) | 2 (1.1) | 7 (8.6) | |
| Pure diffuse FDG uptake | 8 (4.4) | 4 (4.9) | |
| No PET/CT lesions | 140 (77.8) | 31 (38.3) |
In total, abnormal BM FDG uptake was seen in 90 patients (34.4%). Of these, 69 patients (26.4%) had focal BM lesions (unifocal, 16; bifocal, 16; multifocal, 37), 9 (3.4%) had focal and diffuse uptake, and 12 (4.6%) had only diffuse uptake involving most of the axial skeleton. Per the aforementioned definition, BMI on PET was therefore identified in 78 patients. BMB failed to identify BMI in 32 of these subjects, whereas PET failed to identify BMI in 35 patients with positive BMB (Figure 3; Tables 2-4). The distribution of focal BM uptake is summarized in Figure 4. A total of 780 focal BM lesions, in 78 patients, were visualized on PET; the most frequently involved structures were the vertebrae (33.3%). Most PET BM lesions (91.2%) were localized outside of the iliac crests (example shown in supplemental Figure 1). Four of these 32 patients underwent targeted biopsy of a PET/CT-detected lesion (rib, scalp, right sacrum, and T9), which confirmed bone BMI, whereas routine iliac crest biopsy did not show BMI. In 25 of the 32 patients (78%), treatment was initiated after PET. Six of the 32 patients died; the cause of death was disease progression in 3, and it remained unknown in the other 3.
Diagnostic performance of PET/CT and BMB for detecting BMI
| PET/CT+ | PET/CT− | Total | |
|---|---|---|---|
| BMB+ | 46 | 35 | 81 |
| BMB− | 32 | 148 | 180 |
| Total | 78 | 183 | 261 |
| PET/CT+ | PET/CT− | Total | |
|---|---|---|---|
| BMB+ | 46 | 35 | 81 |
| BMB− | 32 | 148 | 180 |
| Total | 78 | 183 | 261 |
Detection of BMI
| Detection of BMI by PET/CT alone using BMB as reference standard* | Detection of BMI when using combined BMB and PET/CT as reference standard | |||||
|---|---|---|---|---|---|---|
| Absolute nos.† | Percentage (95% CI) | PET/CT† | Percentage (95% CI) | BMB† | Percentage (95% CI) | |
| Sensitivity | 46/81 | 57 (45-68) | 78/(78 + 35) | 69 (60-77) | 81/(81 + 32) | 72 (62-80) |
| Specificity | 148/180 | 82 (76-84) | N/A‡ | N/A‡ | N/A‡ | N/A‡ |
| PPV | 46/(46 + 32) | 59 (47-70) | N/A‡ | N/A‡ | N/A‡ | N/A‡ |
| NPV | 148/183 | 81 (74-86) | 148/183 | 81 (74-86) | 148/(148 + 32) | 82 (76-88) |
| Accuracy | (46 + 148)/261 | 74 (69-80) | (46 + 148 + 32)/261 | 87 (82-90) | (46 + 148 + 35)/261 | 88 (83-91) |
N/A, not applicable.
Note that this represents an unrealistic worst-case scenario, assuming that all focal FDG uptake outside of the location of BMB was false-positive. These data are only reported for completeness.
Values represent absolute numbers, and values in parentheses represent the sum of absolute numbers shown in Table 3 used for calculations as per standard formulas for sensitivity, specificity, PPV, NPV, and accuracy.
Missing reference for the false-positives.
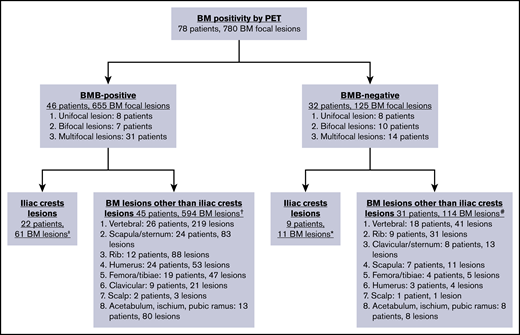
Distribution of focal BM uptake on PET/CT. Note that the same patient could have PET+ lesions at multiple sites. ‡ Unifocal lesion, 0 patients; bifocal lesions, 4 patients; multifocal lesions, 18 patients. †Unifocal lesion, 8 patients; bifocal lesions, 6 patients; multifocal lesions, 31 patients. *Unifocal lesion, 1 patient; bifocal lesions, 1 patient; multifocal lesions, 7 patients. #Unifocal lesion, 8 patients; bifocal lesions, 11 patients; multifocal lesions, 12 patients.
Distribution of focal BM uptake on PET/CT. Note that the same patient could have PET+ lesions at multiple sites. ‡ Unifocal lesion, 0 patients; bifocal lesions, 4 patients; multifocal lesions, 18 patients. †Unifocal lesion, 8 patients; bifocal lesions, 6 patients; multifocal lesions, 31 patients. *Unifocal lesion, 1 patient; bifocal lesions, 1 patient; multifocal lesions, 7 patients. #Unifocal lesion, 8 patients; bifocal lesions, 11 patients; multifocal lesions, 12 patients.
The detection rate of bilateral and unilateral BMB was 21% (95% CI, 11% to 36%) and 33% (95% CI, 27% to 40%), respectively (P = not significant). Regarding BMB histologic findings, 76 of the 81 patients with positive BMB (93.8%) had lymphoid infiltrates composed of a prominent component of FL and concordant cytological aspects both in the BM and in the tissue sample used to diagnose FL (concordant BMI). The remaining 5 patients (6.2%) had lymphoid infiltrates composed of other/combined histologies, such as FL and B-cell lymphoproliferative disorder or FL and marginal zone lymphoma.
Detection of BMI affects stage
Overall, 120 patients (46.0%) were diagnosed with stage IV disease. Because of positive PET result (PET+)/negative BMB result (BMB−) findings, 24 patients were upstaged to stage IV: 4 of these 24 patients were previously in stage I, 6 were in stage II, and 14 were in stage III. In contrast, because of negative PET result (PET−)/BMB+ findings, 32 patients were upstaged to stage IV; based on clinical and imaging findings alone, 4 of these patients were previously considered to be in stage I, 2 in stage II, and 26 in stage III (Table 5). Three of the 6 patients upstaged from stage I or II to stage IV due to PET+ findings underwent chemotherapy, 2 received rituximab, and 1 was observed. Their median PFS was 4.9 years (range, 2.9-9.9 years), with an OS of 100% (supplemental Table 1). The distribution of extranodal disease sites in the 120 patients with stage IV disease is shown in Table 6.
BMI and clinical stage using BMB or PET/CT as reference standard
| CT and BMB stage combined | FDG-PET/CT alone | |||
|---|---|---|---|---|
| Stage I | Stage II | Stage III | Stage IV | |
| Stage I | 70 | 0 | 0 | 4* |
| Stage II | 0 | 24 | 0 | 6* |
| Stage III | 0 | 0 | 47 | 14* |
| Stage IV | 4† | 2† | 26† | 64 |
| CT and BMB stage combined | FDG-PET/CT alone | |||
|---|---|---|---|---|
| Stage I | Stage II | Stage III | Stage IV | |
| Stage I | 70 | 0 | 0 | 4* |
| Stage II | 0 | 24 | 0 | 6* |
| Stage III | 0 | 0 | 47 | 14* |
| Stage IV | 4† | 2† | 26† | 64 |
Number of patients in each stage.
Twenty-four patients: BMB alone would have missed BMI.
Thirty-two patients: PET alone would have missed BMI.
Distribution of extranodal disease on PET/CT in stage IV patients (N = 120)
| Extranodal sites | Total | Extranodal organ involvement | |
|---|---|---|---|
| Single | ≥2 | ||
| BMI only | 95 | 95 | 0 |
| Soft tissue (non-BMI) only | 7 | 4 | 3 |
| Soft tissue and BMI | 18 | 0 | 18 |
| Total | 120 | 99 | 21 |
| Extranodal sites | Total | Extranodal organ involvement | |
|---|---|---|---|
| Single | ≥2 | ||
| BMI only | 95 | 95 | 0 |
| Soft tissue (non-BMI) only | 7 | 4 | 3 |
| Soft tissue and BMI | 18 | 0 | 18 |
| Total | 120 | 99 | 21 |
Number of patients shown for each category.
BMI, PFS, and OS
At the time of data cutoff, there were 231 survivors, of whom 134 (51%) were followed for >5 years; 43 (16.5%) were followed for >10 years. The median duration of follow-up for all patients was 5.9 years (range, 0-16.6 years). At the time of data cutoff, 69 patients showed disease progression, had relapsed, or had died. The estimated PFS at 5 years was 76.3% (95% CI, 70.6% to 82.1%). In total, 30 patients died. The estimated OS at 5 years was 92.1% (95% CI, 88.3% to 95.9%).
Univariate analysis investigated the association between clinical parameters, BMI positivity by PET, and positive BMB, and PFS and OS. These results are shown in Table 7. Univariate analysis of PFS suggested that FLIPI score (>2), BMI positivity by PET, and positive BMB were associated with significantly lower PFS rates (Figure 5A-C). However, separation by stage based on BMB alone or by combined PET and BMB results was not associated with PFS (P > .05; Figure 5D-E). For OS, high FLIPI score (>2), FLIPI-2 score (>2), BMI positivity by PET, combined PET and BMB results, and separation by stage either by BMB result alone or by combined PET and BMB were associated with significantly lower OS rates (Figure 6). Sex and grade were not associated with PFS or OS (P > .05). In addition, in the subset of patients who were BMI− by PET but BMB+, the biopsy finding per se was not associated with either PFS or OS (supplemental Figure 2). In the multivariate analysis using the Cox regression method, BMI positivity by PET was the only independent predictor of PFS (P < .001; HR, 2.30; 95% CI, 1.42-3.71). For OS, BMI positivity by PET and high FLIPI score were the independent predictors (P = .002; HR, 3.31; 95% CI, 1.57-6.98, and P = .03; HR, 2.24; 95% CI, 1.07-4.70, respectively) (Table 7). FLIPI-2 score was not entered in the multivariate model due to the high percentage of missing values (70%), and the combination of (PET+BMB) was not entered because of its high correlation with both PET-alone and BMB-alone results. The 5-year PFS rates for patients with BMI positivity and BMI negativity by PET were 62.3% and 82.0%, respectively. The 5-year OS rates for patients with BMI positivity and BMI negativity by PET were 81.3% and 96.0%, and for high vs low FLIPI score were 80.4% and 96%, respectively.
Univariate and multivariate analysis of clinicopathological and imaging parameters for PFS and OS in FL patients (Cox proportional hazards model, n = 261)
| Univariate analysis | Multivariate analysis | |||||
|---|---|---|---|---|---|---|
| PFS P | OS P | PFS P | HR (95% CI) | OS P | HR (95% CI) | |
| Sex | ||||||
| Male vs female | .92 | .10 | N/A | N/A | .18 | N/A |
| Grade | ||||||
| 1,2 vs 3A | .74 | .25 | N/A | N/A | N/A | N/A |
| Score, >2 vs ≤2 | ||||||
| FLIPI | .03 | .005 | .18 | N/A | .03 | 2.24 (1.07-4.70) |
| FLIPI-2 (79 patients) | .58 | .02 | Not entered | Not entered | Not entered | Not entered |
| Result, positive vs negative | ||||||
| Focal BM FDG uptake | .001 | <.001 | <.001 | 2.30 (1.42-3.71) | .002 | 3.31 (1.57-6.98) |
| BMB | .025 | .07 | .21 | N/A | .61 | N/A |
| Combined focal BM FDG uptake and BMB | .05 | .01 | Not entered | Not entered | Not entered | Not entered |
Final PFS and OS model contains focal BM FDG uptake result only. The other P values show the results of other variables added one-by-one to the final model. FLIPI-2 was not entered in the multivariate model due to the high percentage of missing values (70%); the combined focal BM FDG uptake result and the BMB result were not entered due to high correlation with FDG uptake and BMB results.
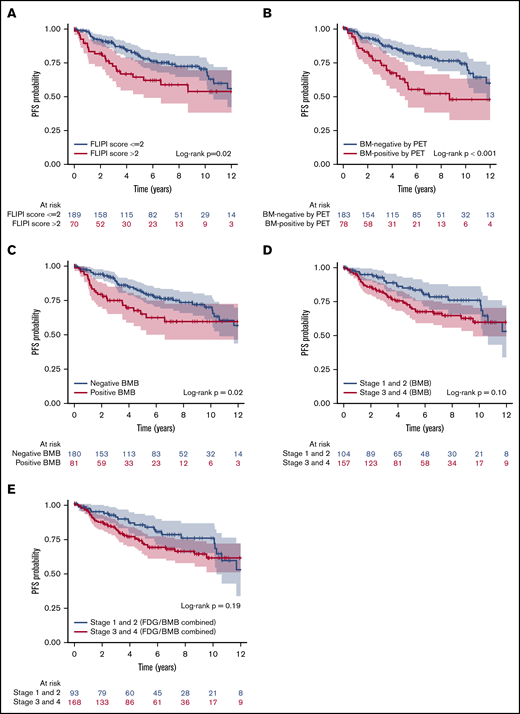
Kaplan-Meier analysis showing PFS curves. According to FLIPI score (A), BMI positivity by PET (B), BMB result (C), separation by low and high stage based on BMB result (D), and separation by stage based on combined FDG and BMB result (E). Color bands indicate 95% CI. FLIPI score (>2), BMI positivity by PET, and positive BMB were associated with lower PFS rates (P = .02, <.001, and .02, respectively).
Kaplan-Meier analysis showing PFS curves. According to FLIPI score (A), BMI positivity by PET (B), BMB result (C), separation by low and high stage based on BMB result (D), and separation by stage based on combined FDG and BMB result (E). Color bands indicate 95% CI. FLIPI score (>2), BMI positivity by PET, and positive BMB were associated with lower PFS rates (P = .02, <.001, and .02, respectively).
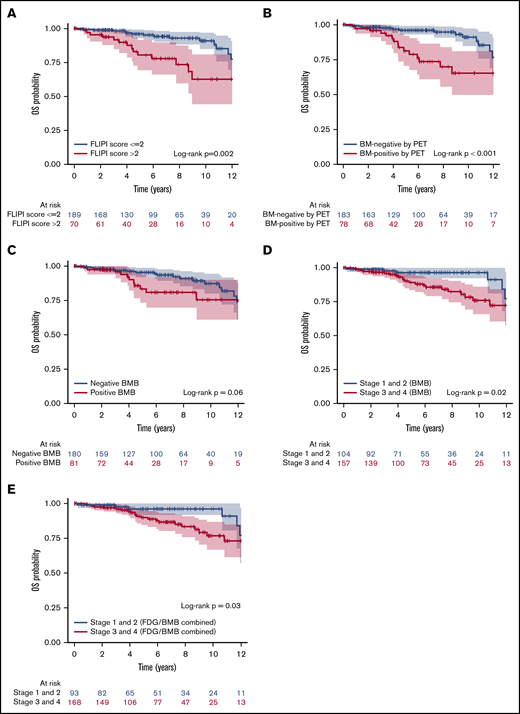
Kaplan-Meier analysis showing OS curves. According to FLIPI score (A), BMI positivity by PET (B), BMB result (C), separation by low and high stage based on BMB result (D), and separation by stage based on combined FDG and BMB result (E). Color bands indicate 95% CI. FLIPI score (>2), BMI positivity by PET, and high stage based on either BMB or combined results were associated with lower OS rates (P = .002, <.001, .02, and .03, respectively).
Kaplan-Meier analysis showing OS curves. According to FLIPI score (A), BMI positivity by PET (B), BMB result (C), separation by low and high stage based on BMB result (D), and separation by stage based on combined FDG and BMB result (E). Color bands indicate 95% CI. FLIPI score (>2), BMI positivity by PET, and high stage based on either BMB or combined results were associated with lower OS rates (P = .002, <.001, .02, and .03, respectively).
Discussion
In DLBCL and HL, FDG-PET/CT has almost completely replaced the need for BMB.21 In contrast, in patients with FL, BMB is still routinely performed in patients initiating therapy with the aim of accurate staging. Against this background, our results show that combined PET and BMB had greater accuracy for identifying BMI than BMB alone. Moreover, however, in patients already considered to have advanced-stage disease by PET, BMB may not appear necessary because BMB results did not affect outcome in advanced-stage FL in our study; only BMI by PET (but not BMB) was identified as a prognostic factor in this study. Of course, if warranted for the evaluation of possible discordant histology or if there is suspicion for transformation, BMB could be considered after PET is performed to ensure appropriate treatment.
One other key group of patients in whom accurate staging with both PET and BMI is needed is those with clinical stage I or II FL for whom radiotherapy is planned.28 In this setting, both tests are usually considered important for ruling out occult disease and/or BMI, which would preclude the use of definitive radiotherapy. However, without BMB, BMI would have been missed in only 6 patients with PET stages I or II in our study population.
Prior studies investigating the utility of PET for BMI in FL reported sensitivities of 31% to 68%.20,23-26 The largest study, in 142 patients,26 reported a sensitivity of 34.3% when considering BMB as the gold standard (supplemental Table 2). This variation in reported sensitivities is likely a reflection of varying standards of reference. Often, PET findings were not confirmed by biopsy. Nevertheless, in the era of PET/CT, it is now straightforward to review the CT images of the combined PET/CT scan and determine potential reasons for bone or BM uptake. Uptake related to benign (eg, fibrous dysplasia, eosinophilic granuloma) or malignant (eg, lytic or blastic metastases, primary bone tumors) entities can thus be excluded readily. Therefore, if FDG uptake is focal, centered in the BM, and the combined PET/CT shows no other potential reason for such uptake, then BMI by FL is indeed the most likely explanation. This was the approach chosen in our study. Verification of focal FDG uptake in BM in this setting is often not practical or feasible for technical reasons: if no corresponding abnormality in marrow is seen on the CT, any such biopsies would have to be done under PET/CT guidance. Although this can be done in specialized centers (as was the case for 4 of our patients), PET-guided biopsies are probably not feasible in the broader community and obtaining biopsies from each site of focal FDG uptake is not feasible either. The fact that BMI on PET provided independent prognostic information supports the notion that the focal FDG uptake seen on staging scans did indeed represent BMI.
Our analysis showed that detection of BMI by PET was independently prognostic for both PFS and OS. Interestingly, detection of BMI by PET remained prognostic by multivariate analysis whereas involvement detected by BMB alone lost significance. One potential explanation may be the ability of PET to detect abnormalities throughout the entire skeleton, whereas BMB can only assess <1% of the entire BM. BM lesions located outside of the iliac crests will be missed by BMB, potentially leading to understaging and limiting its prognostic utility. In fact, in the present study, most of the FDG+ sites of BMI were found outside of the iliac crest. Moreover, it should be noted that detection of a positive PET signal requires a critical tumor cell mass/volume. This contrasts with BMB, in which BMI may be diagnosed when only a few tumor cells are found in the specimen. It is thus unlikely that BMB+/PET− patients had a larger volume of BM disease outside of the biopsy site. In addition, patients who were BMB−/PET+ showed on average 4 sites of BMI by PET. In contrast, although the exact extent of BMI in patients who are BMB+/PET− is unknowable, any sites of disease outside of the iliac crest biopsy would have been microscopic, explaining the lack of detection by PET. It is thus conceivable that patients who were BMB−/PET+ had a greater burden of BMI than those who were BMB+/PET−, explaining the greater prognostic value of PET. The lack of association between BMB positivity and prognosis in the subset of patients who were BMI− on PET also appears to support this hypothesis.
Only 1 prior study evaluated the prognostic implications of BMI detected on PET.24 In this retrospective study of 60 patients, the authors concluded that the FDG mean standardized uptake value (SUV) >2.7 had a PPV for BMI of 100%, whereas the NPV was 100% for excluding BMI in those with mean SUV <1.7. In view of the many technical factors influencing SUV measurements (eg, uptake time, equipment, reconstruction algorithms), it is rather unlikely that these values will be reproducible. To the best of our knowledge, the current study includes the largest number of patients with sufficient follow-up.
Several prognostic indices have been proposed for FL over the years, starting with FLIPI in 2004,5 then FLIPI-2 in 2009,4 followed by a simplified system based on lactate dehydrogenase and β2 microglobulin (B2M) in 2013,29 and, more recently, the PRIMA–Prognostic Index (PRIMA-PI), which only relies on B2M and the presence of BMI by BMB.30 The PRIMA-PI showed higher specificity than FLIPI or FLIPI-2 scores and offered improved risk stratification in patients over the age of 60 years.31 We could not calculate PRIMA scores due to lack of B2M levels in most of our patients. Of note, BMB also has limitations, as it only assesses a very small fraction of the overall BM. Interestingly, our results clearly show that noninvasive PET imaging provides independent prognostic information. Although we cannot compare the prognostic utility of PET to that of PRIMA-PI, it is conceivable that a new prognostic index, using information from staging PET and selected laboratory parameters, such as B2M, may emerge in the future. This can be the subject of future studies.
Our study had some limitations, related to its retrospective nature. More importantly, there is no practical method for defining the true incidence of BMI. Many sites of BMB noted on PET may not be biopsied, and verification by other imaging tests, such as spinal or whole-body magnetic resonance imaging, may also be suboptimal. We restricted the patient population to those who underwent BMB and PET scan within 6 weeks to ensure comparability of the data sets. In addition, data concerning FLIPI-2 score at diagnosis were not available for all patients because some had undergone pretherapy staging in earlier years when B2M was not routinely captured. Finally, our patients received a variety of treatment regimens, which may have affected patient outcome.
In summary, although combined PET and BMB have greater accuracy for identifying FL-BMI than either test alone, BMB rarely adds critical information for the selection of appropriate therapy after PET is performed. Importantly, BMI positivity by PET (but not BMB) is an independent prognostic marker, emphasizing the crucial role of PET in the pretreatment assessment of FL.
For original data, please contact the senior author, Heiko Schöder, at schoderh@mskcc.org.
Acknowledgments
Leah Bassity, an editor supported by Memorial Sloan Kettering Cancer Center, provided editorial assistance to the authors during preparation of this manuscript.
This work was supported, in part, through National Institutes of Health, National Cancer Institute Cancer Center support grant P30 CA008748.
Authorship
Contribution: R.N. and L.M. collected and analyzed data, drafted the manuscript, and approved the final manuscript; A.J.M., C.L.B., and A.D. reviewed data, edited the manuscript, and approved the final manuscript; A.M. analyzed statistical data, edited the manuscript, and approved the final manuscript; and H.S. conceived and designed the study, analyzed and reviewed data, edited the manuscript, and approved the final manuscript.
Conflict-of-interest disclosure: C.L.B. receives or has received research funding from Janssen, Novartis, Epizyme, Xynomics, and Bayer, and honorarium from Dava Oncology; and serves as a consultant or an advisory board member for Life Sci, GLG, Juno/Celgene, Seattle Genetics, and Kite. A.M. receives or has received research support from Seattle Genetics, Bristol-Myers Squibb, Merck, and Incyte, and has served as a consultant for Seattle Genetics, Bristol-Myers Squibb, and Miragen Therapeutics. The remaining authors declare no competing financial interests.
Correspondence: Heiko Schöder, Molecular Imaging and Therapy Service, Memorial Sloan Kettering Cancer Center, 1275 York Ave, Box 77, New York, NY 10065; e-mail: schoderh@mskcc.org.

