

Key Points
Low-dose IL-2 and rapamycin robustly increase persistence of autologous, ex vivo–expanded Tregs after adoptive transfer in NHP.
Critical transcriptional changes are associated with transferred Tregs over time.

Abstract
As regulatory T cell (Treg) adoptive therapy continues to develop clinically, there is a need to determine which immunomodulatory agents pair most compatibly with Tregs to enable persistence and stabilize suppressor function. Prior work has shown that mechanistic target of rapamycin inhibition can increase the stability of thymic Tregs. In this study, we investigated the transcriptomic signatures of ex vivo–expanded Tregs after adoptive transfer in the setting of clinically relevant immunosuppression using a nonhuman primate (NHP) model as a prelude to future transplant studies. Here, we found that adding interleukin-2 (IL-2) to rapamycin in vivo supported a logarithmic increase in the half-life of adoptively transferred carboxyfluorescein diacetate succinimidyl ester–labeled, autologous NHP Tregs, effectively doubling the number of cells in the peripheral blood Treg compartment compared with Treg infusion when rapamycin was given alone. Using single-cell transcriptomics, we found that transferred ex vivo–expanded Tregs initially exhibit a gene expression signature consistent with an activated state. Moreover, those cells with the highest levels of activation also expressed genes associated with p53-mediated apoptosis. In contrast, transferred Tregs interrogated at day +20 posttransfer demonstrated a gene signature more similar to published profiles of resting Tregs. Together, these preclinical data further support combining IL-2 and rapamycin in vivo as adjunctive therapy for ex vivo–expanded adoptively transferred Tregs and suggest that the activation status of ex vivo–expanded Tregs is critical to their persistence.
Introduction
There is a growing clinical need for an efficacious, suppressive cellular therapy for autoimmune diseases and transplantation. However, current globally immunosuppressive regimens are often associated with undesired off-target toxicities and can be antithetical to immune tolerance, with calcineurin inhibitors being key examples of this paradox.1 In contrast, suppressive cell-based therapies, including CD4+/CD25hi/FOXP3+ regulatory T cells (Tregs), promise fewer off-target effects and have been shown to induce immune tolerance in animal models.2,3 Substantial efforts are being made to establish the optimal strategy to sustain adoptively transferred polyclonal, CD4+/CD25hi/CD127lo thymically derived Tregs in clinical trials.4-16 Long-term and feasible clinical strategies will require that Tregs be paired with drug-based immunosuppressive agents already being used in the targeted patients, as even temporary cessation of these agents may put patients at risk for disease progression or recurrence.
A formidable challenge of ex vivo–expanded Treg therapy is ensuring their long-term persistence.4,5,14,15,17,18 The mechanistic target of rapamycin inhibitor rapamycin (rapa) has been associated with increasing frequency of endogenous murine thymic Tregs (tTregs)19,20 and peripheral Tregs (pTregs).21,22 Using a nonhuman primate (NHP) model of adoptively transferred ex vivo–expanded Tregs, we previously showed that systemic rapa affords a modest prolongation in Treg persistence compared with the calcineurin inhibitor tacrolimus (half-life for rapa = 67.7 hours vs 47.4 hours for tacrolimus),15 likely explained by Treg’s requirements for calcineurin-dependent IL-2 production by non-Tregs as previously shown in rodent models.1 Rapa also stabilizes the functional phenotype and gene expression profile of endogenous16,19,20,23 and adoptively transferred Tregs.15 However, as monotherapy, rapa failed to promote long-term persistence of adoptively transferred, ex vivo–expanded, autologous Tregs.15
Interleukin-2 (IL-2) is an attractive adjunctive therapy for a suppressive cellular therapy, as it has a number of beneficial effects on both endogenous (nontransferred) tTregs and pTregs. Low-dose IL-2 supports pTreg expansion in culture24 and the persistence of adoptively transferred tTregs used to reverse established chronic graft-versus-host disease (GVHD) in mice.25 At low doses in patients with chronic GVHD, IL-2 expands the endogenous Treg compartment and has been shown to be therapeutically beneficial.26,27 When given as an immune complex with an anti–IL-2 monoclonal antibody, IL-2 half-life is prolonged, similarly increasing the Treg compartment in mice.28,29 IL-2 complexes also stabilize the expression of the Treg-lineage master transcription factor FOXP3 in transforming growth factor-β–induced pTregs.30 We hypothesized that exposure of ex vivo–expanded Tregs to high IL-2 concentrations may render them particularly sensitive to cytokine withdrawal–induced death31 (CWID) after adoptive transfer, a sensitivity that could be ameliorated with systemic IL-2 therapy. Given the proven advantages of IL-2 and rapa (IL-2+rapa) in supporting Treg expansion in small animal models32-34 and patients,35,36 we tested IL-2+rapa for its capacity to prolong the half-life of autologously derived, ex vivo–expanded Tregs after adoptive transfer in an outbred, NHP model and performed flow cytometry and single-cell transcriptomics to explore underlying mechanisms and correlations with lifespan and Treg subset dynamics after transfer.
Materials and methods
For full details of the materials and methods used in this study, see supplemental Materials and methods.
Isolation and ex vivo expansion of Tregs
CD4+/CD25hi/CD127lo putative Tregs from autologous donors were flow-sorted from peripheral blood mononuclear cells and expanded as previously described.15 The same cohort of animals from our prior study15 was used in this study to minimize donor differences in drug metabolism. Thus, every animal in this study that received rapa+IL-2 and Tregs was previously evaluated after receiving rapa alone and Tregs. This has permitted a rigorous analysis of the impact of the addition of IL-2 to rapa on individual animals that had previously received rapa alone. A full description of isolation and ex vivo expansion methodology can be found in supplemental Materials and methods.
Infusion and tracking of CFSE-labeled Tregs
Expanded Tregs recovered after cryopreservation were labeled with carboxyfluorescein diacetate succinimidyl ester (CFSE) and infused as previously described.16 A full description of infusion and tracking methodology can be found in supplemental Materials and methods.
Immunosuppression and IL-2
Animals were treated with rapa daily by intramuscular injection, which began 2 weeks before Treg infusion, to ensure a steady-state level had been achieved when Tregs were infused. The dose of rapa was adjusted to achieve a target trough level of 5 to 15 ng/mL. Aldesleukin (IL-2) injections given at 1 million U/m2 were started 5 days before adoptive transfer until day 60 posttransfer. The rationale for the day −5 start was to evaluate effect of IL-2 on the endogenous Treg compartment prior to infusion of expanded Tregs.
Single-cell RNA sequencing (RNA-seq) library prep
Single-cell libraries from sorted populations of Tregs and controls were generated using a unique molecular identifier–based, droplet-partitioning platform (10X Genomics), processed in 1 batch and sequenced using a NextSeq 500 (Illumina). Details of the bioinformatic pipeline and data sets used in this work can be found in supplemental Materials and methods.
Results
Subcutaneous low-dose IL-2 prolongs adoptively transferred Treg half-life and increases endogenous Treg numbers
Given the precedent for both rapa and IL-2 supporting endogenous Tregs19-22,24-28,32,33,35 and our prior studies of rapa administration on adoptively transferred Tregs in NHPs,15 we tested whether adding daily subcutaneous low-dose IL-2 (1 × 10⁶ IU/m2, as given to treat chronic GVHD patients) to rapa15 would prolong the half-life of expanded Tregs (labeled with CFSE to distinguish transferred from endogenous cells). Generation, cryopreservation, thawing, labeling, and administration of Tregs is schematized in Figure 1A and described in detail in supplemental Materials and methods. The animals received Treg infusions ranging in cell number from 3 to 30 × 106/kg recipient bodyweight (see supplemental Figure 1 for details of cell doses and recipient animals), doses that have been tested to prevent acute GVHD in patients. Detectible peripheral blood CFSE+ Tregs were significantly higher in IL-2+rapa experiments compared with historical rapa-only or no-rapa experiments (n = 3 each group, using the same animals analyzed previously with rapa only).15 Compared with rapa only, IL-2+rapa increased transferred Treg half-life from 2.7 to 19.0 days, with an α decay of 2.0 (rapa) vs 10.3 (IL-2+rapa) days and a β decay of 6.9 (rapa) vs 83.7 (IL-2+rapa) days (Figure 1B).
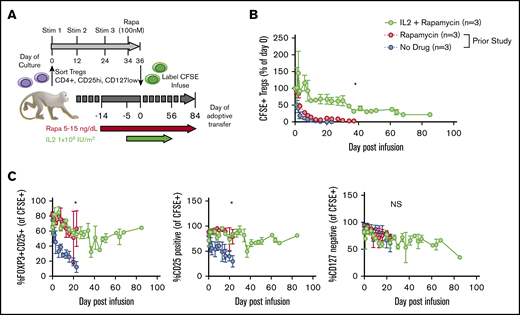
IL-2 affords additional prolongation of the half-life of adoptively transferred Tregs compared with rapa alone. (A) Experimental schema. (B) Longitudinal frequency of CFSE+ Tregs expressed as a percentage of the 1-hour postinfusion measurement. Tregs were defined as CD3+, CD4+, CD2+, and FOXP3+. *P < .05, percentage of CFSE+ Tregs IL-2+rapa vs rapa using repeated-measures analysis of variance (ANOVA). (C) Percentage of all CFSE+ cells that are positive for both CD25 and FOXP3 (left), CD25 only (middle), and negative for CD127 (right). *P < .05, IL-2+rapa vs rapa using repeated-measures ANOVA. NS, not significant.
IL-2 affords additional prolongation of the half-life of adoptively transferred Tregs compared with rapa alone. (A) Experimental schema. (B) Longitudinal frequency of CFSE+ Tregs expressed as a percentage of the 1-hour postinfusion measurement. Tregs were defined as CD3+, CD4+, CD2+, and FOXP3+. *P < .05, percentage of CFSE+ Tregs IL-2+rapa vs rapa using repeated-measures analysis of variance (ANOVA). (C) Percentage of all CFSE+ cells that are positive for both CD25 and FOXP3 (left), CD25 only (middle), and negative for CD127 (right). *P < .05, IL-2+rapa vs rapa using repeated-measures ANOVA. NS, not significant.
To ascertain the phenotypic characteristics of Tregs after IL-2+rapa, levels of CD25, CD127, and FOXP3 expression in all CFSE+ cells were assessed flow cytometrically in longitudinal fashion and compared with the rapa-only cohort. The relevance of this comparison was optimized by the fact that the same individual animals received both rapa only and IL-2+rapa, thus enabling intra-animal comparisons. During IL-2+rapa therapy, transferred Tregs retained expression of the canonical Treg phenotype (CD25hi/CD127lo/FOXP3+) to the same extent as previously observed with rapa alone (Figure 1C). Prior work has shown IL-2 and/or rapa can influence the numbers of circulating Tregs.32-36 We also find that the combination of IL-2+rapa resulted in a higher percent and absolute numbers of endogenous (nontransferred, CFSE−) Tregs during IL-2 administration in a time-dependent fashion (Figure 2A-C; see supplemental Table 1 for absolute counts of CFSE+ cells and supplemental Figure 2A for a representative flow gating strategy). Thus, when considering total cells in the Treg compartment, the combination of ex vivo–expanded Tregs with IL-2+rapa achieved a mean of 292 Tregs/μL blood, nearly tripling the mean counts of endogenous Tregs/μL blood (113 Tregs/μL) prior to Treg infusion. Longitudinal flow cytometric analysis of CFSE peaks did not show multiple peaks of fluorescence, as has been shown previously in NHP studies16 of actively dividing Tregs, nor did RNA-seq data (discussed later) reveal ongoing proliferation as evidenced by MKI67 or CCNB2 expression in the CFSE+ Tregs (supplemental Figure 3).
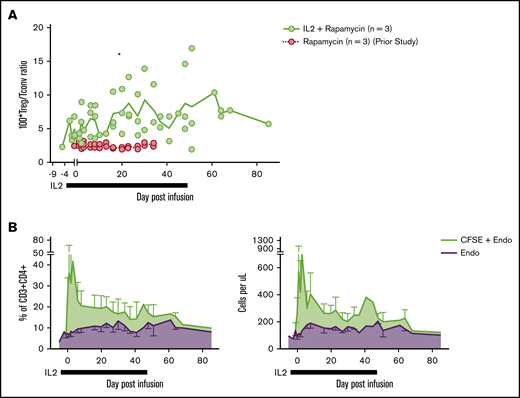
Subcutaneous low-dose IL-2 increases the number of circulating endogenous Tregs. (A) Treg/Tconv ratio × 100 in animals treated with IL-2+rapa and rapa alone. *P < .05, repeated-measures ANOVA. (B) Percentages (left panel) of circulating Tregs defined as a total percentage of CFSE+ cells (of CD3+CD4+) plus endogenous cells as gated in panel A (green) and endogenous cells as gated in panel A alone (purple). Absolute numbers (right panel) of circulating Tregs defined as an absolute number of CFSE+ cells (CD3+CD4+) per microliter peripheral blood plus absolute endogenous cells as calculated in panel A (green) and endogenous cells as calculated in panel B alone (purple).
Subcutaneous low-dose IL-2 increases the number of circulating endogenous Tregs. (A) Treg/Tconv ratio × 100 in animals treated with IL-2+rapa and rapa alone. *P < .05, repeated-measures ANOVA. (B) Percentages (left panel) of circulating Tregs defined as a total percentage of CFSE+ cells (of CD3+CD4+) plus endogenous cells as gated in panel A (green) and endogenous cells as gated in panel A alone (purple). Absolute numbers (right panel) of circulating Tregs defined as an absolute number of CFSE+ cells (CD3+CD4+) per microliter peripheral blood plus absolute endogenous cells as calculated in panel A (green) and endogenous cells as calculated in panel B alone (purple).
Single-cell RNA-seq of endogenous and transferred Treg subsets
To identify both cellular heterogeneity in transferred Tregs and gene expression patterns that might be associated with the persistence (or lack thereof) of transferred Tregs, we used single-cell Treg transcriptome profiling. To identify molecular events associated with the initial decline in transferred Tregs, cells were profiled at day +3. To define those events associated with the prolonged persistence afforded by IL-2+rapa, we profiled again at day +20. Importantly, studies to search for transcriptomic correlates with persistence were not technically feasible in prior experiments with rapa only due to the short half-life of transferred Tregs, and as such, the improved half-life of Tregs with IL-2+rapa allowed us to interrogate different phases of persistence of the adoptively transferred cells for the first time in our model system. To separately examine transferred Tregs, endogenous Treg, and non-Treg control populations, we employed a flow cytometric sorting strategy that separated peripheral blood mononuclear cells into (1) transferred Tregs (CD3+/CD4+/CFSE+), (2) endogenous Tregs (CFSE−/CD3+/CD4+/CD25hi/CD127lo), and (3) 2 control non-Treg populations of CFSE−/CD3+/CD4+/CD25hi/CD127hi or CFSE−/CD3+/CD4+/CD25lo/CD127hi cells (see supplemental Figure 2B for sorting strategy). Sorting and single-cell RNA-seq analysis were performed on animal R.401, and sufficient and comparable numbers of cells from each population were obtained when sorting of peripheral blood mononuclear cells obtained at days +3 and +20. Moreover, sorting ensured that single-cell transcriptional profiles were generated from Tregs with validated Treg surface immunophenotypes. We recovered 25 037 single-cell expression profiles from all time points that met quality-control thresholds (see supplemental Materials and methods) with a range of 1157 to 4751 cells per sorted cell type per time point.
We first performed analysis aimed at broadly visualizing clusters of gene expression profiles in specific sorted cell populations. Visualization used t-distributed stochastic neighbor embedding (tSNE)37 dimensionality reduction followed by DensityPeak38 clustering, an unsupervised clustering method used to define point density within a graph (Figure 3A-B). Together, these 2 methods effectively identify clusters of transcriptionally similar cells. Distinct aggregates of sorted transferred and endogenous Tregs (upper left, blue and light blue) and non-Tregs (upper right and lower middle, red and pink) were observed (Figure 3B). Most clusters exhibited specific enrichment in sorted populations, supporting the notion that specific transcriptional differences underlie their canonical surface immunophenotype. In agreement with flow cytometric data, we identified canonical transcript expression levels associated with Tregs (high FOXP3, high IL-2RA, low IL-7R) in transferred cells (C1 and C2) and sorted endogenous Treg samples (C3 and C4, Figure 3C).
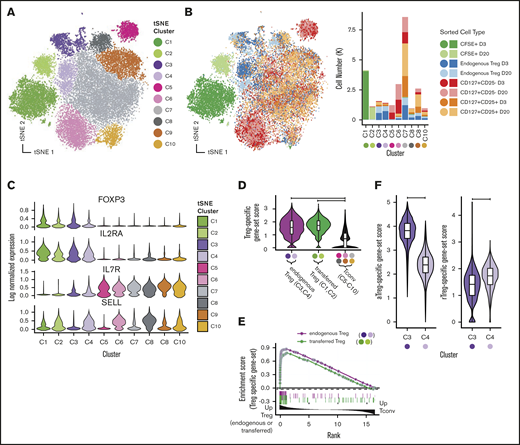
Single-cell RNA-seq reveals Treg subsets and shows that expression profiles of transferred Tregs maintain expression of Treg signatures after adoptive transfer. Visualization of single-cell expression profiles of all sorted cells after tSNE dimensionality reduction colored by unsupervised clustering analysis (A) and sort gate (B, left panel) with yields of sorted cell types in each tSNE cluster (B, right panel). (C) Expression of canonical Treg transcripts and SELL by tSNE cluster. (D) Single-cell scores of a Treg-specific gene-set signature taken from published profiles GSE90600 of human Tregs. (E) GSEA enrichment plot of gene set from panel D among differentially expressed genes between (1) endogenous Tregs and Tconvs (tSNE clusters C5-C10) (green line) and (2) transferred Tregs and Tconv (purple line). (F) C3 and C4 tSNE clusters scored by human aTregs (left) and rTregs (right) gene sets (GSE90600).
Single-cell RNA-seq reveals Treg subsets and shows that expression profiles of transferred Tregs maintain expression of Treg signatures after adoptive transfer. Visualization of single-cell expression profiles of all sorted cells after tSNE dimensionality reduction colored by unsupervised clustering analysis (A) and sort gate (B, left panel) with yields of sorted cell types in each tSNE cluster (B, right panel). (C) Expression of canonical Treg transcripts and SELL by tSNE cluster. (D) Single-cell scores of a Treg-specific gene-set signature taken from published profiles GSE90600 of human Tregs. (E) GSEA enrichment plot of gene set from panel D among differentially expressed genes between (1) endogenous Tregs and Tconvs (tSNE clusters C5-C10) (green line) and (2) transferred Tregs and Tconv (purple line). (F) C3 and C4 tSNE clusters scored by human aTregs (left) and rTregs (right) gene sets (GSE90600).
In addition to the clear clusters with the highest levels of FOXP3 expression (C1-C4), we observed that expression of CD62L+ (SELL) differentially marked clusters of both FOXP3-expressing and FOXP3-nonexpressing cells (Figure 3C). Furthermore, we were able to note higher expression genes associated with T-cell memory39 (CD58, CD63, LGALS3, and S100A4) in most of the clusters cells that did not express SELL (supplemental Figure 4), suggesting that naive and memory T-cell states, combined with the identity of a cell as either a Treg or not, are critical drivers of the gene expression programs in CD4 T cells. This paradigm is reminiscent of prior work describing five subgroups of cells in the CD4+ compartment,40 namely: (1) fraction I (aka “naive” or “resting” Tregs [herein rTregs]), distinguished by low levels of FOXP3 protein that are CD45RA+; (2) fraction II cells (aka “activated” or “effector” Tregs [herein aTregs]), distinguished by high levels of FOXP3 protein and that are CD45RA−; (3) fraction III cells, commonly thought to be activated conventional T cells (Tconvs), which exhibit low FOXP3 protein and are CD45RA− (herein fraction III cells); (4) CD45RA− non-Tregs (aka “memory” Tconvs [mTconvs]); and (5) CD45RA+ non-Tregs (aka naive T cells [herein nTconvs]). Although CD45RA was not used in our sorting strategy, we hypothesized that the clustering patterns of our single-cell expression data may be characterized by these previously described subtypes. Using previously published bulk transcriptomic profiles41 generated from flow-sorted populations of these 5 cell types, we set out to confirm the identity of our single-cell cluster profiles.
As the cells in clusters C1 and C2 (transferred Tregs) and the cells in clusters C3 and C4 (endogenous Tregs) expressed the highest levels of FOXP3, we first sought to confirm that these cells exhibited a gene expression profile similar to both rTregs and aTregs as sorted Tregs in the aforementioned41 bulk transcriptomic data set (GSE90600).41 To accomplish this using genes expressed in both resting and activated Tregs, we identified the intersect of the genes in the human GSE90600 data set that were enriched in both rTregs compared with nTconvs and aTregs compared with mTconvs. We then used this “Treg-specific” gene set to score each of our NHP single-cell profiles (see supplemental Materials and methods for details of gene-set score calculation). Not surprisingly, clusters putatively identified as endogenous Tregs (C3 and C4) exhibited high expression for this gene set (Figure 3D). Importantly, transferred Tregs (C1 and C2) also exhibited high expression of this gene set to a level equivalent to that of endogenous Tregs (Figure 3D). To confirm these findings using another computational approach, one that strives to overcome the bias associated with cutoff-based analyses, we employed gene set enrichment analysis42 (GSEA) to show enrichment of Treg-specific genes in both endogenous and transferred Tregs relative to Tconvs (Figure 3E). As expected, the canonical Treg markers FOXP3, IL-2RA, TNFRSF18, ENTPD1, and CTLA4 were found in the leading edge of this genes enriched in both endogenous and transferred Tregs (supplemental Table 2, GSEA leading edge genes). To classify cells in the C3 and C4 clusters, we used a similar approach of using gene-set scores (Figure 3F), which clearly identified the C3 cells as aTregs and the C4 cells as rTregs.
Although we identified that cells in C3 and C4 clusters were primarily cells from the flow-sorted “CD25hi/CD127lo” population, many cells in this flow-sorted population did not cluster as bona fide Tregs (Figure 3B), as is suggested by studies of CD25hi CD4 compartment heterogeneity.40,41 To further resolve all CD4+/CD25hi/CD127lo cells subsets using single-cell RNA-seq, we then clustered only those cells sorted as endogenous Tregs (CFSE−/CD4+/CD25hi/CD127lo). From these 5690 cells, we identified 5 populations after dimensionality reduction and unsupervised clustering (supplemental Figure 5A). Two clusters were easily identifiable as aTregs and rTregs being composed chiefly of cells from cluster C3 and C4, respectively, and having gene-set scores for published profiles41 consistent with their identity as such (supplemental Figure 5B). Another cluster, composed of cells chiefly from C8 and C9 original embedding, exhibited high gene-set scores for fraction III cells (relative to aTregs) using published profiles,41 while another cluster (Tconvs) exhibited increased IL-7R expression and decreased expression of IL-2RA with absent FOXP3 and were derived from the original C7 cluster, supporting their identify as Tconvs (supplemental Figure 5A-C). Finally, another cluster (herein referred to as “other”) expressed FOXP3, IL-2RA, and high levels of the STAT1 targets ISG15 and MX1 (supplemental Figure 5D). Consistent with this finding, these cells and the other C10 cells expressed high levels of a previously curated list of interferon-γ–responsive genes43 (Figure 4E). While it is not immediately clear what this cluster of cells signifies, we interrogated an existing data set of single-cell RNA-seq profiles in murine Tregs44 to evaluate whether these genes were observed in Tregs in other species. We obtained count data (GSE109742)45 and performed standard dimensionality reduction using tSNE (supplemental Figure 6). We were able to clearly identify a small cluster of Tregs that express high Foxp3, Il2ra, Mx1, and Isg15 levels, arguing that this Treg subset is neither an artifact nor specific to the NHP. Further studies are ongoing toward a more complete characterization of the Tregs that exhibit downstream gene expression profiles consistent with STAT1-driven T-cell activation.
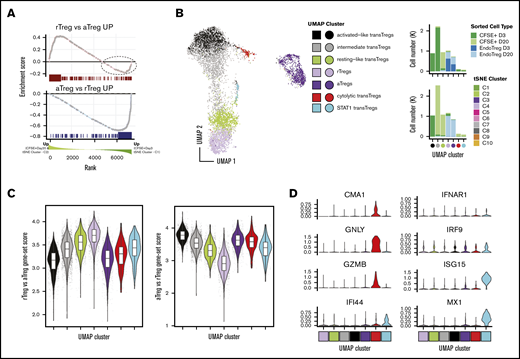
Transferred Tregs exhibit cellular heterogeneity and express a continuum of rTreg- and aTreg-related genes early after transfer but are more “resting-like” by day +20. (A) GSEA enrichment plot of NHP rTreg-specific genes in the ranked list of DE genes between Tregs at day +3 (tSNE cluster C1) compared with transferred Tregs at day +20 (tSNE cluster C2) (top). Dotted circle corresponds to those genes up in rTregs whose expression was higher in day 2 transferred cells compared with day +20. (A) GSEA enrichment plot as in panel A (top), but using NHP aTreg-specific genes (bottom). (B) UMAP dimensionality reduction and clustering of all CFSE+ cells and cells from C3 and C4 tSNE clusters that were sorted as endogenous Tregs (left). (B) Cell percentages of sorted cell type (top) and tSNE cluster (bottom) in UMAP clusters from panel A (right). (C) Gene-set scores from panel A plotted in UMAP clusters (left) and UMAP embedding (right). (D) Genes exhibiting high specificity scores for red and cyan clusters.
Transferred Tregs exhibit cellular heterogeneity and express a continuum of rTreg- and aTreg-related genes early after transfer but are more “resting-like” by day +20. (A) GSEA enrichment plot of NHP rTreg-specific genes in the ranked list of DE genes between Tregs at day +3 (tSNE cluster C1) compared with transferred Tregs at day +20 (tSNE cluster C2) (top). Dotted circle corresponds to those genes up in rTregs whose expression was higher in day 2 transferred cells compared with day +20. (A) GSEA enrichment plot as in panel A (top), but using NHP aTreg-specific genes (bottom). (B) UMAP dimensionality reduction and clustering of all CFSE+ cells and cells from C3 and C4 tSNE clusters that were sorted as endogenous Tregs (left). (B) Cell percentages of sorted cell type (top) and tSNE cluster (bottom) in UMAP clusters from panel A (right). (C) Gene-set scores from panel A plotted in UMAP clusters (left) and UMAP embedding (right). (D) Genes exhibiting high specificity scores for red and cyan clusters.
Taken together, these results validate an approach that uses surface immunophenotype and single-cell RNA-seq to identify circulating resting and activated Treg and non-Treg CD4 T cell populations. These data further build on prior work detailing human CD25hiCD4+ compartment heterogeneity40,41 by confirming their existence in NHP Tregs and show that NHP resting and activated Tregs have distinct expression profiles resolvable by single-cell RNA-seq.
Adoptively transferred Tregs gain transcriptomic similarity to endogenous resting Tregs with increasing time after transfer
Having rigorously characterized the cellular heterogeneity in the CD4+ compartment, we next set out to more precisely define the state of the transferred Tregs (clusters C1 and C2). As previously shown, these cells express a gene signature that is convincingly Treg in nature (Figure 3D-E). While there was a suggestion (based on expression of SELL) that the transferred cells at day +20 (cluster C2) may have a more “resting-like” profile than those at day +3, to evaluate this more definitively, we performed GSEA on C1 vs C2 cells using gene sets derived from the endogenous NHP rTregs and aTregs as a reference (see supplemental Materials and methods for details on derivation of gene sets). As shown in Figure 4A (bottom), genes with increased expression in endogenous aTregs (C3) relative to their resting C4 counterparts exhibited clear enrichment in day +3 transferred cells, while those with increased expression in endogenous rTregs (C4) exhibited a significant but less complete enrichment at day +20 (Figure 4A, top). As such, several transcripts enriched in C4 Tregs were more highly expressed in day +3 cells (Figure 4A, dashed ellipse), suggesting that cells at day +3 could be heterogeneous in rTreg and aTreg gene expression. To interrogate this possibility further, we used Uniform Manifold Approximation and Projection46 (UMAP), a manifold learning algorithm that optimally preserves global relationships in high dimensional data and thus allows for more meaningful understanding of relationships between cell clusters. Using UMAP enabled us to visualize the interrelatedness of transferred cells with cells from only the bona fide rTreg and aTreg clusters (C3 and C4) and revealed that day +3 transferred cells exhibited a far greater degree of transcriptional heterogeneity than day +20 transferred cells. Unsupervised clustering revealed 5 self-aggregating clusters of transferred cells (Figure 4B). As suggested by the GSEA analysis, day +20 transferred cells had high rTreg gene expression levels and clustered intimately with endogenous rTregs (Figure 4B-C). Day 3 cells separated into an “activated-like cluster” that expressed the highest aTreg gene levels relative to all other transferred cells and an “intermediate” cluster that contained cells spanning UMAP space between the activated-like cluster and the more resting-like day +20 transferred cells. A small number of cells from both day +3 and day +20 comprised 2 other clusters (Figure 4D): (1) a cluster expressing high levels of the STAT1 target genes ISG15 and MX1 (similar to the STAT1-target expressing endogenous Treg cluster discussed previously) and (2) a cluster of cells expressing high transcripts levels for cytolytic proteins (GNLY, CGA1, and GZMB). Together, these data reveal heterogeneity in expression of rTreg and aTreg genes in transferred cells early after adoptive transfer and highlight a more homogeneous expression of resting Treg genes seen by day +20.
Activated-like transferred Tregs exhibit profound p53-target gene enrichment and express high apoptotic gene levels
While the gene expression profile of day +3 transferred cells was more activated than the day +20 cells, the nonunion of the highly activated day +3 cells with endogenous aTregs suggested there were significant underlying differences between day +3 activated cells and endogenous aTregs (Figure 4B). To identify the gene expression changes that set these 2 groups apart, we performed differential expression (DE) on the activated-like transferred Tregs and endogenous aTregs (black vs purple cells, Figure 4F). Enrichment analysis revealed that a significant number of genes overexpressed in activated-like transferred Tregs compared with endogenous aTregs were p53 pathway members (Figure 5A-B). Only 3 genes from this analysis were found to have prominently decreased expression in activated-like transferred Tregs (RPL36, S100A4, and RPS12). Each of these has been associated with a proliferative effect. Inhibition of RPS12 has previously been shown to function in concert with S100A4 to limit cell proliferation in cell lines,47 and RPL36 has been associated with glioma cell proliferation.48 Decreased expression of these proliferative genes in activated-like transferred Tregs suggest one possible mechanism for their disappearance over time. To confirm that p53 target genes, in addition to p53 pathway members, were increased in the activated-like transferred T cells, we used a consensus gene list from a recent meta-analysis49 of p53 target studies to calculate a “p53 target” gene-set score for each cell. Scores were highest in day +3 activated-like transferred Tregs relative to all other groups of transferred or endogenous cells. Because p53 has a diverse array of biologic functions, we sought to characterize the predominant p53 function in these cells by examining the top differentially expressed p53 targets (vs endogenous aTregs) and annotated them as apoptotic, antiapoptotic, antiproliferative, proliferative, or other. At a twofold change cutoff, no genes overrepresented in activated-like transferred Tregs were either proliferative or antiapoptotic, while 6 of the 11 genes favored apoptosis or were antiproliferative (Figure 5C).
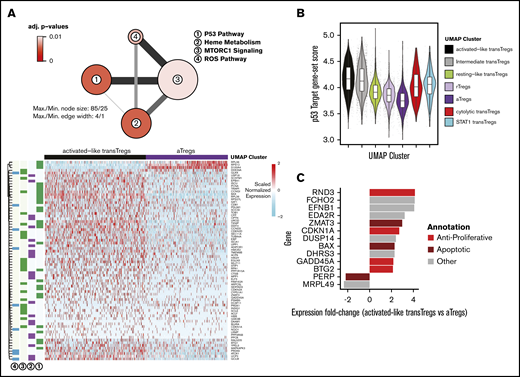
Highly activated transferred Tregs express high levels antiproliferative and apoptotic genes. (A) Network diagram of pathway terms from the Hallmark gene set43 enriched in DE gene list up in activated-like transferred Tregs vs aTregs (top). Expression values of genes from pathways in panel A (top) in activated-like transferred Tregs and aTregs (bottom). (B) p53 target49 gene-set scores by UMAP clusters from Figure 4B. (C) Top p53 target genes DE between activated-like transferred Tregs and aTregs manually annotated as antiproliferative, apoptotic, proliferative, antiapoptotic, or other.
Highly activated transferred Tregs express high levels antiproliferative and apoptotic genes. (A) Network diagram of pathway terms from the Hallmark gene set43 enriched in DE gene list up in activated-like transferred Tregs vs aTregs (top). Expression values of genes from pathways in panel A (top) in activated-like transferred Tregs and aTregs (bottom). (B) p53 target49 gene-set scores by UMAP clusters from Figure 4B. (C) Top p53 target genes DE between activated-like transferred Tregs and aTregs manually annotated as antiproliferative, apoptotic, proliferative, antiapoptotic, or other.
To further understand the relationships between transferred Tregs and endogenous Tregs, we set out define the genes that defined the UMAP trajectory between rTregs, resting-like transferred Tregs and activated-like transferred Tregs. Trajectory inference in single-cell RNA-seq data aims to model the changes that occur between ≥2 biologic states by ordering single-cell expression profiles in “pseudotime,” a measure of the progression from one biologic state to another.50 In agreement with the above DE tests between activated-like transferred Tregs and aTregs, we found genes related to the p53 pathway enriched among the list of pseudotime-dependent genes (supplemental Figure 7A-B). We attribute the increase in an “inflammatory” signature among the pseudotime-dependent genes (as evidenced by genes in the “inflammatory response” pathways), and the lack of this signature in the DE results above, as further evidence of the lack of “effector” signature in both rTregs and transferred Tregs at day +20. The enrichment of genes in “IL-2 STAT5 signaling” and “MTORC1 signaling” is likely a result of the high levels of IL-2RA expression, which also exhibit an increase in expression in a pseudotime-dependent manner (supplemental Figure 7C). Taken together, these results suggest that early after adoptive transfer, transferred Tregs express a spectrum of activation states, the more activated of which is associated with an apoptotic gene expression profile, while the less activated (and less apoptotic) is likely associated with persistence.
Transferred Tregs at day +20 differ in expression of Myc target genes relative to rTregs
Although the transferred Tregs at day +20 were transcriptionally quite similar to rTregs, their incomplete imbrication with rTregs after dimensionality reduction (tSNE and UMAP) suggests some degree of transcriptional dissimilarity. To formally assess differences between these 2 groups of cells, we performed enrichment analysis (using the Hallmark geneset43 ) in a manner similar to that used to above. Echoing the transcriptional similarity between these 2 groups of cells, only 1 term (Myc targets) met significance threshold cutoffs in this analysis (supplemental Figure 8A). Collectively, these Myc target genes were found to be expressed at a lower level compared with both rTregs and all other endogenous T cells studied in this work (supplemental Figure 8B-C). Together, these data suggest that Myc target gene expression, being chief among the differences between resting-like transferred Tregs and rTregs, may reflect alternative metabolic programming of transferred Tregs after adoptive transfer, although further work is clearly needed to confirm these findings using direct methods of metabolite utilization.
Discussion
In this study, we demonstrated that in NHPs, the combination of rapa with low-dose IL-2 significantly improves persistence of transferred Tregs compared with rapa alone, effectively increasing adoptively transferred Treg half-life from 2.7 to 19 days across a large Treg dose range. We then used single-cell transcriptomics to show that FOXP3-expressing, endogenous Tregs self-aggregate into 2 predominant groups of cells that exhibited gene expression patterns consistent with either rTregs or aTregs. We further show that early after transfer, circulating ex vivo–expanded Tregs display heterogeneity with respect to rTreg and aTreg gene expression. Most importantly, we found that cells with the highest activated-related Treg gene expression levels also expressed high p53 target gene levels, including those predominantly associated with apoptosis. By day +20, detectible circulating Tregs became uniform in rTreg-related gene expression and exhibited far lower levels of p53 target gene expression.
While these data provide rationale for employing IL-2+rapa as supportive therapy for adoptively transferred Tregs, they also raise important questions. Although we found that many activated-like Tregs express apoptotic genes after adoptive transfer, it is not yet clear if a subset of transferred activated Tregs has the capacity to transition to longer-lived cells associated with a resting-like gene expression profile. One study of expanded activated CD8 cells derived from central memory (but not effector memory) CD8 cells found that some of the transferred T effectors reacquired central memory markers, including CD62L, as late as 56 days after transfer.51,52 Although it is controversial whether Tregs have differentiation states that parallel Tconvs,53 if Tregs also have this capacity for central memory differentiation, it is possible that some or all of the resting-like transferred cells were, at one point, aTregs. Furthermore, the absence of findings of CFSE peaks or cell-cycle–related gene expression in transferred Tregs suggests that the source of longer-lived cells is not related to Treg proliferation.
Regardless of the origin of these resting-like transferred cells, these cells clearly persist in the setting of IL-2+rapa. It has been shown previously that expanded human activated memory (CD62L-CD45RO+) CD8 subsets exhibit higher sensitivity to CWID (IL-2) compared with their central memory (CD62L+CD45RO+) counterparts.31 As high IL-2 levels are required to expand primate Tregs ex vivo, it is likely that such Tregs would be particularly susceptible to IL-2-CWID. In support of this hypothesis, a study found that the proapoptotic protein BAX was upregulated after IL-2 withdrawal in cultured murine Tregs, and Treg apoptosis could be mitigated by a p53 inhibitor and enhanced in transgenic BAX-expressing Tregs.54 Our findings of specific and near-uniform upregulation of BAX in activated-like transferred Tregs and high levels p53 target gene expression are consistent with these findings. Placing our data in the context of both prior studies, it is likely that adjunctive, low-dose IL-2, in the presence of rapa, supports the persistence of cells with a more resting-like gene expression profile. Importantly, multiple studies have shown the immunosuppressive benefit of CD62L+ Tregs over CD62L(−) Tregs,13,53,55-58 further pointing to the use of IL-2+rapa as an adjunctive strategy to favor or enhance CD62L+ Tregs for clinical benefit.
Throughout this work, we also identified a small number of previously undescribed Treg cells expressing high messenger RNA levels for STAT1. Moreover, we found evidence for these cells in prior single-cell RNA-seq studies of murine nonlymphoid44 Tregs, confirming their existence across species. These STAT1-Tregs cluster with other STAT1 expressing CD4 T cells, and although it is not yet clear what expression of STAT1 targets may functionally represent in Tregs, it has been shown that both the abundance and absence of STAT1 signals are critical to Treg function. Mice with Tregs deficient in STAT1 exhibit an increase in development of experimental autoimmune encephalitis,59 while increased STAT1 signaling in Tregs has been associated with aberrant Treg homeostasis in patients with systemic lupus erythematosis.60 Furthermore, dominant gain-of-function STAT1 mutations have been described in patients with an immune dysregulation polyendocrinopathy enteropathy X-linked-like syndrome but with wild-type FOXP3.61 Finally, in mice, autocrine signaling of interferon-γ in Tregs has been shown to augment the tolerance to allograft.62 Further clarification on the role of STAT1 and STAT1 target genes in Tregs is clearly needed.
There are a number of important caveats in this study. First, while, these data are an important extension of preclinical work in rodents supporting IL-2+rapa as adjunctive therapy for Treg therapeutics34 and early-phase clinical trials supporting IL-2+rapa after hematopoietic cell transplant,36 future single-cell RNA-seq studies of adoptively transferred Tregs should aim to study persistence and transcriptional programming in the setting of autoimmunity or alloimmunity. Second, cryopreserved cells were used in the transcriptomic assays throughout this work and may be subject to loss of certain cell types; thus, there is a possibility that all salient differences between the adoptively transferred and endogenous Treg populations were not identified herein. Third, it should be emphasized that these Tregs have been massively expanded, and while they express many genes similar to highly suppressive rTregs, they also express a number of genes that are different, chief among them being targets of MYC. Fourth, while we expect gene expression to mirror functionality, is was not possible to obtain sufficient Tregs to directly test Treg suppression using a suppression assay. Fifth, while this study was able to discern the differences in the single-cell RNA-seq profile of endogenous versus transferred Tregs in the presence of both rapa and IL-2, we did not perform analyses with either agent alone. Thus, these data cannot discern the individual contributions of rapa and IL-2 to the transcriptome but rather identify the combinatorial impact. Finally, systemic IL-2 administration was stopped at day 60 to observe the impact of this change on the numbers of endogenous and transferred Tregs. It is not known whether continuation of IL-2 would result in longer persistence of transferred cells. We also did not perform single-cell RNA-seq on cell populations after day +20; it is possible that further evolution of transcriptional state of the transferred Tregs occurred after this time point, as we were able to observe increases in CD127 expression by flow cytometry toward the end of the experiment.
This study fits within a larger body of work aiming to identify the most ideal adjunctive treatment strategy to pair with ex vivo–expanded, adoptively transferred Tregs. Choosing the appropriate adjunctive immunosuppressant is especially critical given that previous studies have suggested that it is likely that cellular strategies may not be able to sufficiently control inflammation alone and adjunctive agents will be an important pillar of disease control, tolerance induction, or allograft acceptance.3 Many patients who could theoretically benefit from ex vivo–expanded Tregs will be receiving immunosuppressants and would likely need to continue these interventions at the time of cell infusion. Choosing the preferred immunosuppressant to synergize with and not mitigate the suppressive function is important in optimizing adoptively transferred Treg efficacy. Studies comparing adjunctive therapies for ex vivo–expanded Tregs have been particularly challenging, because historically, such transferred cells have limited persistence, and circulating cells have been insufficient for functional analyses. Here, we provide a technical framework for evaluating adjunctive immunosuppression for ex vivo–expanded, adoptively transferred Tregs that uses a combination of multiparameter flow cytometry and single-cell transcriptional profiling to study the cells longitudinally after adoptive transfer.
In summary, we show that IL-2+rapa prolongs adoptively transferred Treg persistence and results in stable expression of transcripts associated with Treg identity and function. Lastly, these data are the first to employ a single-cell transcriptomic study of adoptively transferred Tregs in a large animal model and highlight the power of this technology to more precisely inform adoptive Treg immunotherapy.
See supplemental Materials and methods for data sharing details.
Acknowledgments
S.N.F. is supported by an American Cancer Society Mentored Scholar Award. This work was funded by the National Institutes of Health (NIH), National Heart, Lung, and Blood Institute (R01 HL11879 [B.R.B.]; and R01 HL095791 and U19 HL129902 [L.S.K.]), the NIH, National Institute of Allergy and Infectious Diseases (R01 AI 34495) (B.R.B.), and the NIH, National Cancer Institute (2PO1 CA065493) (B.R.B.).
Authorship
Contribution: S.N.F. and L.S.K. designed this study with input from B.R.B.; S.N.F., C.L., V.T., D.J.H., and K.M.B. performed experiments; S.N.F. performed analysis of data with input from all authors; and S.N.F., L.S.K., and B.R.B. wrote manuscript with input from all authors.
Conflict-of-interest disclosure: B.R.B. receives remuneration as an advisor to Kamon Pharmaceuticals, Five Prime Therapeutics Regeneron Pharmaceuticals, Magenta Therapeutics, and BlueRock Therapeutics; research support from Fate Therapeutics, RXi Pharmaceuticals, Alpine Immune Sciences, AbbVie, the Leukemia and Lymphoma Society, the Children’s Cancer Research Fund, and KidsFirst Fund and is a cofounder of Tmunity. The remaining authors declare no competing financial interests.
Correspondence: Leslie S. Kean, Dana-Farber/Boston Children’s Cancer and Blood Disorders Center, 1 Blackfan Cir, Karp Research Building 08215, Boston, MA 02115; e-mail: leslie.kean@childrens.harvard.edu.

