

Key Points
EPAG is well tolerated and resulted in clinically meaningful responses in 50% of patients with MAA or UC.
The rate of cytogenetic progression was low, and EPAG treatment had no clear impact on somatic mutation clone size.

Abstract
There is no standard or widely effective treatment of patients with moderate aplastic anemia (MAA) or hypo-productive uni-lineage cytopenias (UC). Eltrombopag (EPAG), a small molecule thrombopoietin mimetic, has previously been shown to result in durable multi-lineage hematologic responses with low toxicity in patients with refractory severe aplastic anemia (SAA). Its safety and efficacy in MAA are unknown. This prospective phase 2 study enrolled previously untreated and treated MAA and UC patients with clinically relevant cytopenias. EPAG was administered at doses escalating from 50 to 300 mg/d. Hematologic responses were assessed at 16 to 20 weeks. Responding patients were continued on EPAG until reaching defined robust or stable blood counts. EPAG was reinstituted for relapse. Thirty-four patients were enrolled between 2012 and 2017, including 31 with MAA and 3 with UC. Seventeen patients responded in at least 1 eligible lineage by the primary end point. A striking improvement in anemia was observed in a patient with Diamond-Blackfan anemia. EPAG was well tolerated, and it was discontinued for robust or stable blood counts in 12 of 17 patients after a median of 8 months. A majority required re-initiation of EPAG for declining counts, and all regained response. Two of 34 patients developed non–chromosome 7 bone marrow cytogenetic abnormalities while taking EPAG, without dysplasia or increased blasts. Somatic mutation allele frequencies in cancer genes did not increase overall on EPAG. EPAG is a well-tolerated oral treatment of cytopenias in patients with MAA/UC. This trial was registered at www.clinicaltrials.gov as #NCT01328587.
Introduction
There is no standard treatment of patients with moderate aplastic anemia (MAA) or hypo-productive uni-lineage cytopenias (UC). Therapy is generally considered if a patient progresses to meet the criteria for severe aplastic anemia (SAA) or requires frequent transfusions.1,2 However, most prospective clinical trials in aplastic anemia have enrolled solely those patients already fulfilling criteria for SAA. Several small prospective studies in MAA have reported variable responses to assorted forms of immunosuppressive therapy (IST), including daclizumab,3 or cyclosporine (CSA) and levamisole.4 A single randomized controlled trial in MAA reported a higher response rate to antithymocyte globulin (ATG) and CSA compared with CSA alone.5 However, ATG/CSA requires hospitalization and has many potential toxicities. Furthermore, MAA may have an indolent and even remitting course.6,7 UC due to bone marrow hypoproduction are even less well studied, with no standard therapies other than transfusions. Compared with acquired acute SAA,8 which manifests many features clearly suggesting T cell–mediated immune destruction of hematopoietic stem cells,8,9 the causes underlying MAA/UC, especially those not progressing rapidly to SAA, remain less certain.
Eltrombopag (EPAG) is a small molecule, nonpeptide, oral thrombopoietin receptor agonist. We have reported that EPAG can result in durable hematologic responses and low toxicity in patients with IST-refractory SAA10-12 and increased response rates when added to ATG/CSA in treatment-naive SAA patients compared with historical control subjects treated with ATG/CSA alone,13 resulting in regulatory approval for these indications. Here we report a phase 2, dose-escalation trial of the safety and efficacy of EPAG in patients with MAA/UC.
Methods
Study design
We conducted a prospective phase 2 study of EPAG at escalating doses from 50 to 300 mg/d (25-150 mg/d for East Asian subjects) for patients with MAA or UC (#NCT01328587) (supplemental Figure 1). The protocol was approved by the National Heart, Lung, and Blood Institute Institutional Review Board and was monitored by a Data and Safety Monitoring Board. For MAA, inclusion required at least 2 of the following: hemoglobin <8.5 g/dL or red blood cell (RBC) transfusion dependence, platelets <70 × 109/L or transfusion dependence, and/or absolute neutrophil count (ANC) <1.2 × 10⁹/L but not reaching SAA severity criteria (<0.5 × 10⁹/L). For UC, inclusion required either platelets <30 × 109/L or platelet transfusion dependence, or hemoglobin <8.5 g/dL or RBC transfusion dependence. Patients with a diagnosis of Fanconi anemia or a history of SAA were excluded (all inclusion and exclusion criteria are given in supplemental Table 1). An inherited bone marrow failure sequencing panel (University of Chicago Genetic Services Laboratory) (supplemental Table 3) was performed on all patients, but patients were not excluded for the presence of non-Fanconi germline pathogenic mutations. Both previously treated and untreated patients were eligible. At least 6 months must have elapsed since previous ATG and all other treatments discontinued at least 1 month in advance, other than CSA if the drug had resulted in prior improvement in a lineage but no further improvement for several months.
EPAG was administered at doses from 50 to 300 mg/d, increased by 50 mg every 2 weeks until primary response assessment at 16 to 20 weeks. Dose escalation was halted if a response was reached in all eligible lineages, if the platelet count increased to >400 × 109/L or hemoglobin to >15 mg/dL, or for nonhematologic toxicities; details regarding dose adjustments are given in supplemental Table 2. Response in patients eligible for a platelet response was defined as an increase in platelets of >20 × 109/L from baseline platelet nadirs and transfusion independence; for patients eligible for a RBC response, an increase in hemoglobin of >1.5 g/dL from baseline for those not transfusion dependent, or a reduction of RBC transfusions by >50% over an 8-week period compared with the 8 weeks before study entry for transfusion-dependent patients. Because all patients had an ANC >0.5 × 10⁹/L at study entry and were therefore not at risk for serious infections related to neutropenia, increases in ANC were not considered for response assessment.
Responding patients were offered continued EPAG on an extension phase of the protocol. EPAG was discontinued if patients obtained either a “robust” response (defined as hemoglobin >10 mg/dL without RBC transfusions, platelets >50 × 109/L without platelet transfusions, and ANC >1 × 10⁹/L), all maintained for at least 8 weeks, or a “stable” response (defined as a continued response not reaching robust criteria but sustained for at least 6 months). Patients on the extension study could have EPAG reinstituted at the most recent dose level for relapse, then tapered every 8 to 12 weeks in 50-mg increments to identify a dose that maintained counts. Patients in the extension study were followed up every 6 months while on EPAG and for 3 years after the last dose of EPAG if they went off drug for a robust/stable response.
Bone marrow aspiration and biopsy with cytogenetics were performed within 1 month of EPAG initiation, at the primary end point, and then every 6 months while on EPAG for responding patients on the extension study, or yearly on the extension study if off EPAG for a robust/stable response. Telomere length in blood cells was quantitated via polymerase chain reaction as previously described.14
Targeted deep sequencing for acquired somatic mutations
Targeted next-generation sequencing on bone marrow mononuclear cell DNA was performed for the following myeloid cancer/aplastic anemia genes: ABL1, ASXL1, ATRX, BCOR, BCORL1, BRAF, CALR, CBL, CBLB, CBLC, CDKN2A, CEBPA, CREBBP, CSF3R, CTCF, CUX1, DNMT3A, EP300, ETV6, EZH2, FBXW7, FLT3, GATA1, GATA2, GNAS, HRAS, IDH1, IDH2, IKZF1, IKZF3, JAK1, JAK2, JAK3, KDM6A, KIT, KMT2A, KRAS, MPL, MYD88, NF1, NOTCH1, NPM1, NRAS, PHF6, PPM1D, PTEN, PTPN11, RAD21, RUNX1, SETBP1, SETD2, SF3B1, SMC1A, SMC3, SRSF2, STAG2, SUZ12, TET2, TP53, U2AF1, U2AF2, WT1, and ZRSR2.
Single Primer Extension library preparation (Qiagen, Germantown, MD) was performed via genomic DNA fragmentation, end-repair, and A-tailing in a single, multienzyme reaction followed by addition of a unique molecular identifier. The library was then amplified and platform-specific adapter sequences and sample indices added, followed by sequencing on an Illumina NextSeq 550 (Illumina Inc., San Diego, CA). Reads were paired-end aligned to the human genome (version GRCh37 p13). Aligned reads were written to a Binary Alignment Map format from the DRAGEN aligner (Illumina, Inc.). The DRAGEN somatic analysis pipeline was used to identify single nucleotide variants and indels. A sequence coverage ≥100× was required. Somatic mutations at a >2.5% frequency were reported.
Statistics
The sample size was determined based on Simon’s 2-stage minimax design, testing the null hypothesis that the 16- to 20-week response rate would be 20% or lower vs the alternative hypothesis that the response rate would be 40% or higher, at a significance level of 0.05 and 80% power. Response rate was analyzed by using the intention-to-treat principle; any patients dropping out before 16 to 20 weeks were considered nonresponders. The first stage of the trial involved the accrual of 18 patients and stipulated that the trial be terminated if ≤4 subjects responded within 16 to 20 weeks. The second stage involved the accrual of an additional 15 patients. To account for potential early withdrawals and loss to follow-up while maintaining statistical power, an additional 5 patients could be accrued, bringing the upper limit of the number of patients to 38.
Summary statistics were calculated for patient baseline characteristics and laboratory parameters using medians and ranges for continuous variables and counts and proportions for categorical variables. Univariable and multivariable logistic regression analyses were used to model the effect of covariates. Coefficients are presented in addition to their corresponding standard error and P value. Data analysis was performed by using R 3.5.0 (R Foundation for Statistical Computing, Vienna, Austria) and SAS 9.4 (SAS Institute, Inc., Cary, NC).
Results
Patient characteristics
Thirty-four patients were enrolled between February 2012 and March 2017, thirty-one with MAA and 3 with UC. On germline testing for predicted pathogenic mutations in known bone marrow failure genes, unique patient number 10 (UPN10) with clinical Diamond-Blackfan anemia (DBA) had a heterozygous mutation in the RPS19 gene, UPN30 had a heterozygous TERT mutation, and UPN34 had compound heterozygous MPL mutations (supplemental Table 3). No other patients were found to have mutations in known germline bone marrow failure genes.
Patient clinical characteristics are summarized in Table 1. The median age was 32.5 years (range, 10-69 years). Five patients failed to respond to previous treatment with ATG/CSA and 2 failed CSA; others had failed to respond to androgens, corticosteroids, and other agents (Table 1; supplemental Table 4). However, the majority (18 of 34) had received no previous treatment other than transfusions. Sixteen patients were transfusion dependent for RBCs and 3 for platelets. Twenty-three of 34 patients were eligible for response assessment in the erythroid lineage (hemoglobin <8.5 g/dL if untransfused or RBC transfusion dependent), 24 of 34 in the platelet lineage (platelets <30 × 109/L or platelet transfusion dependent), and 13 in both lineages. Per definition of MAA or UC, no patient had an ANC <0.5 × 10⁹/L, and the median ANC at baseline was >1 × 10⁹/L.
Patient characteristics at baseline
| Patient characteristics | Values |
|---|---|
| Age, y | |
| Median | 32.5 |
| Range | 10-69 |
| Age, n (%) | |
| <18 y | 2 (6) |
| 18-64 y | 30 (88) |
| ≥65 y | 2 (6) |
| Sex, n (%) | |
| Female | 17 (50) |
| Male | 17 (50) |
| Race/ethnicity, n(%) | |
| Asian | 4 (12) |
| African American | 5 (15) |
| Hispanic | 2 (6) |
| White | 23 (68) |
| Other | 0 (0) |
| Diagnosis, n (%) | |
| MAA | 31 (91) |
| UC-erythroid (including 1 DBA) | 3 (9) |
| No. of previous treatments (%) | |
| 0 | 19 (56) |
| 1 | 9 (26) |
| >2 | 6 (18) |
| Previous treatments, n (%) | |
| Immunosuppressive therapy with ATG, ATG/CSA, or CSA | 7 (21) |
| Androgens | 6 (18) |
| Other* | 11 (32) |
| Time since first diagnosis, median (range), mo | 11 (1-354) |
| Laboratory parameters | |
| Neutrophil count, median (range), ×10−9/L | 1.1 (0.5-5.3) |
| Reticulocyte count, median (range), ×10−9/L | 62.9 (3.1-92.2) |
| Platelet count, median (range), ×109/L | 26.0 (10.0-311.0) |
| Hemoglobin, median (range), g/dL | 8.7 (6.6-15.7) |
| Erythroid response eligible (transfusion-dependent or hemoglobin <8.5 g/dL), n (%) | 23 (68) |
| Platelet response eligible (transfusion-dependent or platelets <30 × 109/L), n (%) | 24 (71) |
| Erythroid and platelet response eligible, n (%) | 13 (38) |
| PNH clone >1%, n (%) | 11 (32.) |
Includes daclizumab, methotrexate, rituximab, intravenous immunoglobulin, mycophenolate, sirolimus, erythropoietin, corticosteroids, and central venal pressure.
Clinical outcomes and toxicities
Of the 34 patients enrolled, 32 tolerated EPAG well. One patient withdrew from the study at 10 weeks because of grade 2 nausea and vomiting, and a second stopped dose escalation because of grade 2 nausea; the frequency of adverse events attributed to EPAG, however, was low (supplemental Table 5). Twenty-six patients reached the maximal dose; 5 patients stopped initial dose escalation due to reaching a response at a lower dose (2 for nausea and/or vomiting, and 1 for platelets >400 × 109/L) (supplemental Table 4). Overall, the rate of adverse events was not higher than previously reported in bone marrow failure patients receiving a maximum dose of 150 mg/d, other than possibly nausea.10-12 One noncompliant patient was withdrawn from the protocol.
Seventeen (50%) of 34 patients met criteria for response at the primary end point (16-20 weeks) in at least 1 eligible lineage (Figures 1 and 2; supplemental Table 4). Of the 23 patients eligible for an erythroid lineage response, 12 responded, including UPN10 with DBA. Of the 24 patients eligible for a platelet response, 7 responded, including UPN30 with a TERT mutation. Of the 13 patients eligible for responses in both erythroid and platelet lineages, 2 had bi-lineage responses by the primary end point, with an additional 6 reaching bi-lineage responses during the extension period, for a total of 8 of 13 overall. All responders became transfusion independent in the eligible lineage(s). ANC did not significantly increase at the primary end point compared with baseline regardless of whether the patient had a platelet or erythroid response, but a change in ANC was not a response criterion, and no patient had clinically significant neutropenia at study entry. Four patients without a response to EPAG (including 3 who later met criteria for SAA) were treated with ATG/CSA, and 3 responded.

Summary of EPAG responses. (A) Bar charts show the absolute numbers and percentage of responders (green shaded) and nonresponders (light blue shaded) for all patients, patients with and without previous IST, and patients with and without germline mutations. (B) Bar charts show the absolute numbers and percentage of responders (color shaded) for patients eligible for an erythroid response, patients eligible for a myeloid response, and patients eligible for bi-lineage responses, both at the primary end point and at best response during the extension study.
Summary of EPAG responses. (A) Bar charts show the absolute numbers and percentage of responders (green shaded) and nonresponders (light blue shaded) for all patients, patients with and without previous IST, and patients with and without germline mutations. (B) Bar charts show the absolute numbers and percentage of responders (color shaded) for patients eligible for an erythroid response, patients eligible for a myeloid response, and patients eligible for bi-lineage responses, both at the primary end point and at best response during the extension study.

Longitudinal mapping of responses, relapses, and cytogenetic progression. All enrolled patients are shown, grouped into responders and nonresponders at the primary end point of 16 to 20 weeks. From baseline until the primary end point or early discontinuation due to intolerance (UPN27), all patients were taking EPAG, designated by gray bars. Seventeen patients met hematologic response criteria at the primary end point and were continued on EPAG on the extension arm of the study, designated by solid green bars. Twelve of 17 patients reached robust or stable response criteria (see the Methods section) and were taken off EPAG (hatched green bars). Seven of these patients relapsed after EPAG was discontinued; EPAG was restarted, and all of them again responded (solid yellow bars). Four patients again reached a robust response and came off EPAG a second time (hatched yellow bars). The 2 patients with cytogenetic progression are shown with the specific chromosomal change and the number of abnormal metaphases. The 3 patients with germline mutations are indicated (TERT, RPS19, and MPL).
Longitudinal mapping of responses, relapses, and cytogenetic progression. All enrolled patients are shown, grouped into responders and nonresponders at the primary end point of 16 to 20 weeks. From baseline until the primary end point or early discontinuation due to intolerance (UPN27), all patients were taking EPAG, designated by gray bars. Seventeen patients met hematologic response criteria at the primary end point and were continued on EPAG on the extension arm of the study, designated by solid green bars. Twelve of 17 patients reached robust or stable response criteria (see the Methods section) and were taken off EPAG (hatched green bars). Seven of these patients relapsed after EPAG was discontinued; EPAG was restarted, and all of them again responded (solid yellow bars). Four patients again reached a robust response and came off EPAG a second time (hatched yellow bars). The 2 patients with cytogenetic progression are shown with the specific chromosomal change and the number of abnormal metaphases. The 3 patients with germline mutations are indicated (TERT, RPS19, and MPL).
Univariate and multivariate analyses of baseline patient characteristics were performed to identify predictors of response. We included age, absolute reticulocyte count, absolute immature platelet count, RBC transfusion dependence, presence of a detectable PNH clone (>1%), time from first diagnosis, any previous treatment, previous IST, and age-adjusted telomere length. None of these parameters was predictive of response at the primary end point, either in the entire cohort or when grouped according to eligible erythroid or platelet lineages (supplemental Table 6).
The median duration of follow-up for all patients was 16 (range, 4-62) months and 27 (range, 6-62) months for responding patients. EPAG was discontinued during the extension phase for achievement of robust (11 of 17) or stable (1 of 17) responses after a median duration of EPAG administration of 8 (range, 2-14) months. Seven (78%) of 9 patients followed up on protocol after EPAG discontinuation required re-initiation of EPAG for declining counts a median of 6 (range, 2-38) months after EPAG was stopped, including UPN10 with DBA. All 7 regained responses, and 4 patients were able to discontinue EPAG for a second robust or stable response (Figure 1).
Cytogenetic or clinical evolution
Two (6%) of 34 patients developed bone marrow cytogenetic abnormalities while receiving EPAG (Table 2); both were adults with MAA and a response to EPAG on the extension trial. In neither case was there dysplasia or increased blasts in the bone marrow. UPN5 had +8 in 7 of 20 metaphases detected on a protocol-specified bone marrow sample from 22 months. EPAG was discontinued, and the patient’s blood counts relapsed several months later. EPAG was restarted off-protocol, and repeat cytogenetic analyses were normal. UPN20 had del(13q) in 5 of 20 metaphases at 9.5 months. EPAG was stopped, and repeat cytogenetic analyses were normal. Robust responder UPN12 had not received EPAG for 25 months when his counts declined, and bone marrow evaluation revealed mild dysplastic changes, with no increase in blasts and normal cytogenetics. The patient underwent allogeneic transplantation.
Cytogenetic evolution in patients with MAA/UC on EPAG
| UPN | Response to EPAG | Baseline | Cytogenetic evolution | Time on EPAG, mo | Dysplasia | Follow-up |
|---|---|---|---|---|---|---|
| 5 | Yes | 46,XX[20] | 47, XY, +8 [7]/[20] | 22 | No | 46, XY |
| 20 | Yes | 46,XY[20] | 46, XY, del(13)(q12q14)[5]/[20] | 9.5 | No | 46, XY |
| UPN | Response to EPAG | Baseline | Cytogenetic evolution | Time on EPAG, mo | Dysplasia | Follow-up |
|---|---|---|---|---|---|---|
| 5 | Yes | 46,XX[20] | 47, XY, +8 [7]/[20] | 22 | No | 46, XY |
| 20 | Yes | 46,XY[20] | 46, XY, del(13)(q12q14)[5]/[20] | 9.5 | No | 46, XY |
UPN, unique patient number.
Somatic mutations
We performed targeted next-generation exome sequencing of 63 genes associated with myeloid malignancies and/or aplastic anemia (supplemental Table 7) at baseline and at the primary response end point. At baseline, 4 patients had a total of 6 somatic mutations detected (1 patient each with SETBP1, TP53, SF3B1 and PPMID, and 2 with DNMT3A mutations) (Figure 3A). These mutations were also detected at the primary end point; there was no significant difference in variant allele frequency (VAF) of somatic mutations between paired samples at baseline vs the primary end point (P = .678) (Figure 3B). Three patients had mutations detected at the primary end point at low VAF, which were not detected at baseline (2 in BCOR and 1 in DNMT3A). Somatic mutations were detected in both responding and nonresponding patients.
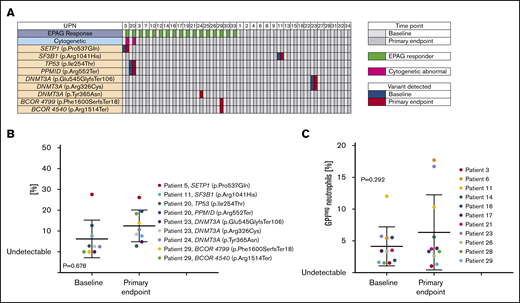
Acquired somatic mutations in relation to EPAG treatment. (A) Targeted deep sequencing for a panel of genes previously reported as associated with myeloid cancers (MC) or aplastic anemia (AA) was performed on bone marrow cells from all patients at baseline and at the primary end point. Each row indicates a specific MC/AA gene found mutated in at least 1 patient, and each column represents each patient’s samples at baseline and at the primary end point. The panel of MC/AA genes is given in the supplemental Methods, and the mutations detected are listed in supplemental Table 4. Patients are grouped according to response (green at primary end point designates response) and the presence of abnormal cytogenetics (pink box). (B) The percentage of variant alleles is shown on the y-axis at baseline and the primary end point for the 9 individual mutations detected in 6 patients, with a P value (paired Student t test) comparing VAF at baseline and primary end point. (C) The percentage of glycosylphosphatidylinositol-negative (GPIneg) PNH granulocytes in 11 patients with detectable clones at baseline and/or the primary end point are plotted, with a P value (paired Student t test) comparing baseline and primary end point. The 3 patients with germline mutations (UPN10, UPN30, and UPN34) had no somatic mutations detected.
Acquired somatic mutations in relation to EPAG treatment. (A) Targeted deep sequencing for a panel of genes previously reported as associated with myeloid cancers (MC) or aplastic anemia (AA) was performed on bone marrow cells from all patients at baseline and at the primary end point. Each row indicates a specific MC/AA gene found mutated in at least 1 patient, and each column represents each patient’s samples at baseline and at the primary end point. The panel of MC/AA genes is given in the supplemental Methods, and the mutations detected are listed in supplemental Table 4. Patients are grouped according to response (green at primary end point designates response) and the presence of abnormal cytogenetics (pink box). (B) The percentage of variant alleles is shown on the y-axis at baseline and the primary end point for the 9 individual mutations detected in 6 patients, with a P value (paired Student t test) comparing VAF at baseline and primary end point. (C) The percentage of glycosylphosphatidylinositol-negative (GPIneg) PNH granulocytes in 11 patients with detectable clones at baseline and/or the primary end point are plotted, with a P value (paired Student t test) comparing baseline and primary end point. The 3 patients with germline mutations (UPN10, UPN30, and UPN34) had no somatic mutations detected.
We also tested samples at the longest follow-up for responders still followed up on study and in nonresponders who continued to be seen at our National Institutes of Health clinic. Eight mutations were newly detected in 5 responders during long-term follow-up, but 3 of 8 were transient and were at the assay sensitivity threshold (Figure 4; supplemental Table 7). The 2 patients (UPN5 and UPN20) with transient cytogenetic abnormalities had stable mutation VAFs.
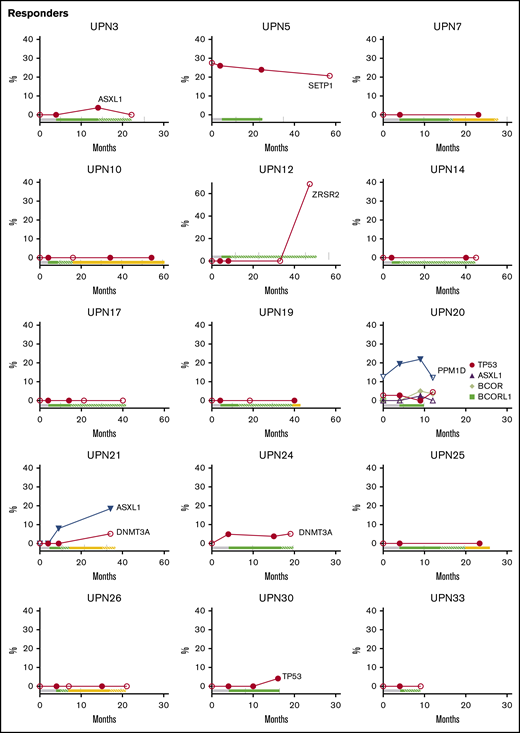

Longitudinal follow-up of mutated clone size on and off EPAG. Candidate gene mutations were analyzed at baseline, primary end point, and the latest time point available on and off EPAG. Each panel shows the results in a single patient, with mutated clone size off EPAG (at baseline and long-term follow up) designated by open symbols and clone size on EPAG (at primary end point or during long-term follow-up) designated by closed symbols. Timeline bars designating time on and off EPAG are shown for each patient, with the same color key as used in Figure 2. Specific somatic mutations are listed in supplemental Table 7.
Longitudinal follow-up of mutated clone size on and off EPAG. Candidate gene mutations were analyzed at baseline, primary end point, and the latest time point available on and off EPAG. Each panel shows the results in a single patient, with mutated clone size off EPAG (at baseline and long-term follow up) designated by open symbols and clone size on EPAG (at primary end point or during long-term follow-up) designated by closed symbols. Timeline bars designating time on and off EPAG are shown for each patient, with the same color key as used in Figure 2. Specific somatic mutations are listed in supplemental Table 7.
Although the majority of patients did not develop new clones or had stable small clones over long-term follow-up, several patients had mutated clones that did increase in contribution over time, whether on or off EPAG (Figure 4; supplemental Table 7). Nonresponding patient UPN23 had two DNMT3A mutations first detected at the primary end point, and these were unchanged 6 months later. Responding patient UPN21 was found to have an ASXL1 clone during the extension period that increased over the next 2 years, and a DNMT3A mutation was detected at 36 months, after study drug had stopped. UPN12 had an early robust response and did not receive study drug for over 2 years with stable counts when he was found to have a large ZRSR2 clone. As noted earlier, this patient had a decrease in blood counts and mild bone marrow dysplasia several months later.
Eleven patients had a PNH clone >1% at baseline, including 7 responders. There was no obvious PNH clone expansion in these patients by the primary end point (P = .292) (Figure 3C). One responding patient had a gradual increase in PNH clone size to >80% over 4 years of follow-up (supplemental Figure 2).
Bone marrow hematopoietic stem and progenitor cells
We measured the frequency of CD34+ hematopoietic stem and progenitor cells (HSPCs) as well as subpopulations of more primitive CD34+CD38– HSPCs and more mature CD34+CD38+ HSPCs for all patients with available baseline and primary end point bone marrow aspirates of sufficient quality. In responders, there was no difference in the frequency of CD34+CD38– cells at baseline vs the primary end point. The frequency of CD34+CD38+ HSPCs significantly increased in responders by the primary end point. In nonresponders, there was no change in any of the subsets (Figure 5).

Impact of EPAG on HSPC frequency. The frequencies of CD34+/CD38– primitive HSPCs, CD34+/CD38+ maturing HSPCs, and total CD34+ HSPCs within bone marrow mononuclear cells is shown for 12 responding (A) and 10 nonresponding (B) patients. P values for paired Student t tests comparing baseline (Pre) and primary end point (Post) are given. *P < .05.
Impact of EPAG on HSPC frequency. The frequencies of CD34+/CD38– primitive HSPCs, CD34+/CD38+ maturing HSPCs, and total CD34+ HSPCs within bone marrow mononuclear cells is shown for 12 responding (A) and 10 nonresponding (B) patients. P values for paired Student t tests comparing baseline (Pre) and primary end point (Post) are given. *P < .05.
Discussion
The current study found that oral administration of EPAG at doses up to 300 mg/d was generally well tolerated and resulted in clinically meaningful responses in 50% of patients with MAA/UC, regardless of previous treatments. Erythroid responses occurred more frequently than platelet responses at the primary end point, although on the extension phase of the protocol, platelet response rates became similar to erythroid response rates. It is possible that this discrepancy in kinetics could result from differential sensitivity and responsiveness of human hematopoietic stem cells or multipotent progenitors primed or committed to each lineage, based on single-cell studies suggesting early lineage bias or commitment of HSPCs.15,16 Several recent studies have also reported clinical activity of EPAG in MAA. Eight of 11 elderly patients with MAA responded to EPAG in an English retrospective study.17 Results in 30 patients with MAA treated with EPAG were reported in a retrospective European study that also included patients with SAA.18 Response rates for MAA were not provided separately from the entire 180-patient cohort (overall, 62%); however, disease severity did not predict response, and many patients received simultaneous IST. A Japanese prospective study included both MAA (n = 15) and SAA (n = 6) patients and reported a 28% response rate; separate response information was not provided for the 2 severity groups.19
In the current trial, responses were clinically meaningful, with the majority of responders achieving robust multi-lineage responses, and all becoming transfusion independent. However, in contrast to patients with refractory SAA who generally continued to respond after discontinuation of EPAG,12 most patients with MAA/UC required chronic EPAG administration to maintain blood counts. The durability of responses off EPAG did not have any obvious relation with previous IST, suggesting that an ongoing immune response is less likely to be responsible for relapses in MAA patients than in SAA patients, and conversely, that MAA patients may more frequently have an underlying intrinsic HSPC abnormality; larger cohorts, however, would be needed to further investigate this observation.
Pretreatment factors such as absolute reticulocyte count, ANC, age, and telomere length have been linked to likelihood of response, relapse, and/or clonal evolution in SAA.12,20-22 In the current MAA/UC trial, we detected no impact on response rate of age, absolute reticulocyte count, ANC, or telomere length. These and other differences such as the requirement for ongoing treatment with EPAG in most patients with MAA/UC may reflect different biological characteristics between MAA and SAA or may simply reflect small sample size. The majority of responding patients reached the maximal dose of 300 mg/d (or the equivalent for Asian patients and children) before response. However, results from our recent SAA trial of treatment with 150 mg/d without dose escalation showed that clinical responses are often not detected for 3 to 6 months,12 suggesting that the impact of EPAG on hematopoiesis is a slow process. Thus, it is unclear whether very high doses were necessary for response. We believe that future trials in MAA should start at 150 mg/d and increase beyond that dose only after 4 to 6 months in nonresponding patients.
Two responding patients had underlying germline bone marrow failure syndromes (telomeropathy and DBA), and we speculate that a significant fraction of patients with MAA/UC may have germline mutations in genes not yet linked to MAA/UC or acquired genetic disruption of hematopoiesis, rather than an autoimmune pathophysiology for bone marrow failure. Of note, patient UPN30 with compound heterozygote MPL mutations did not respond, suggesting that signaling in HSPCs via MPL is required for at least some EPAG responses, despite the recent suggestion that some activities of EPAG may be independent of MPL signaling.23 Patients with Fanconi anemia were excluded from the MAA trial, given their very different risk profile for clonal progression; however, data suggesting that thrombopoietin and EPAG can promote DNA repair have led to an ongoing trial (#NCT03206086) of EPAG for patients with this disorder.24,25
The remarkable erythroid lineage EPAG-dependent response of the DBA patient (UPN10) merits comment. This patient was steroid unresponsive and transfusion dependent at study entry. Primitive HSPCs have been found to be depleted in DBA, particularly with increasing patient age, accompanied by bone marrow hypocellularity and occasional progression to pancytopenia26 ; thus, one potential mechanism for response is stimulation of MPL-expressing primitive HSPC. Although UPN10 had platelet counts and ANC within the normal range at study entry, her bone marrow was moderately hypocellular. The recently elucidated potent intracellular iron chelation activity of EPAG is another potential route for improvement of RBC production in DBA.20,23,27 An imbalance between globin chain and heme production in DBA has been documented to result from ribosomal dysfunction, leading to increased iron-mediated cellular stress and death of erythroid progenitors. EPAG may overcome this toxicity by a mechanism of intracellular iron chelation.21 A transfusion-dependent adult patient with clinical DBA and no germline mutational testing reported developed severe thrombocytopenia with a hypocellular bone marrow showing megakaryocytic dysplasia. He did not respond to low dose EPAG (75 mg/d) but seemed to have disease progression before EPAG initiation. We have opened a prospective clinical trial (#NCT04269889) to further explore the potential of this drug for patients with DBA.
Clonal evolution and disease progression to myelodysplastic syndrome/acute myeloid leukemia are a concern in bone marrow failure, especially events involving chromosome 7.22,28 In the current trial, cytogenetic evolution was infrequent (2 of 34 [5.8%]); neither case involved chromosome 7 or dysplasia, and both had normal karyotypes after EPAG was discontinued. This rate seems low compared with our 2 trials treating refractory SAA with EPAG12 ; cytogenetic evolution occurred in 16 (19%) of 83 patients and involved complete or partial loss of chromosome 7 in seven patients, all occurring by the primary end point of 3 to 6 months. The rate of progression to high-risk chromosome 7 abnormalities seems lower in MAA; however, the sample size limits confidence in conclusions regarding the risk of evolution. Cytogenetic evolution in aplastic anemia can occur 10 or more years after diagnosis; much longer follow-up will therefore be necessary to assess whether EPAG treatment affects clonal progression.
Clonal hematopoiesis marked by myeloid candidate gene–acquired somatic mutations occurs in immune aplastic anemia, with certain mutations linked to clinical outcomes.29,30 In this trial, the incidence of baseline myeloid candidate gene mutations detected was lower in patients with MAA than previously reported in patients with refractory SAA (P = .013).12 In the current trial, EPAG treatment had no consistent impact on clone size, but several patients exhibited expansion of clones in the absence of a clear relation to response or ongoing study drug administration. The significance of these changes remains unclear and should be the focus of long-term studies in patients with bone marrow failure treated with EPAG.
We previously reported that responding treatment-naive patients with SAA who were treated with EPAG in combination with IST exhibited increased CD34+CD38– primitive HSPCs at 3 to 6 months compared with baseline.13 In MAA, the frequency of CD34+CD38– HSPCs did not change between baseline and the primary end point, even in responders. The frequency of these cells at baseline was higher than we have observed in new-onset SAA. Perhaps the defect in at least some patients with MAA is more related to differentiation of HSPCs rather than to loss of the most primitive population of HSPCs.
In conclusion, administration of EPAG at escalating doses up to of 300 mg/d in patients with MAA/UC was well tolerated and resulted in clinically meaningful responses in ∼50% of cases, including those not previously treated with IST. These response rates were similar to those reported with standard ATG/CSA. Responses were durable and often robust, although continued EPAG was often necessary. Clonal cytogenetic evolution was rare, with no instances of chromosome 7 abnormalities, and there was no consistent expansion of myeloid candidate gene somatically mutated clone size during EPAG treatment. Close follow-up of bone marrow characteristics in patients more generally and those currently or previously on EPAG specifically is important to monitor for disease progression. A role for EPAG in MAA, which may have a different pathophysiology than in SAA, should be explored in larger trials, particularly in direct comparison with IST.
De-identified individual participant data will be made available to others upon request to dunbarc@nhlbi.nih.gov, along with the study protocol and informed consent form, upon completion of a data access agreement.
Acknowledgments
The authors thank the National Heart, Lung, and Blood Institute research nurses, clinical protocol navigators, and all other clinical research and clinical care staff at the NIH Clinical Center for their support of this trial. The authors are grateful to the patients and their families for participation in this study.
This work was supported by the intramural research program of the National Institutes of Health, National Heart, Lung, and Blood Institute, project number HL006186. In addition, first GlaxoSmithKline then Novartis supplied EPAG for patients enrolled in this clinical protocol as well as research funding to support ancillary studies including genomics and flow cytometric analyses.
Authorship
Contribution: R.D., T.W., B.D., X.F., N.S.Y., and C.E.D. designed studies; X.F., R.D., T.W., D.J.Y., B.D., F.G.-R., S.E.S., and M.A. performed laboratory studies and clinical analyses; T.W., R.D., D.J.Y., B.D., D.M.T., M.E.B., J.V., J.L., N.S.Y., and C.E.D. provided clinical care; K.R.C. provided pathologic interpretations; R.N.S., X.F., and C.O.W. performed statistical analyses; and X.F., T.W., D.J.Y., N.S.Y., and C.E.D. wrote and edited the manuscript.
Conflict-of-interest disclosure: The authors declare no competing financial interests.
Correspondence: Cynthia E. Dunbar, National Heart, Lung and Blood Institute, National Institutes of Health, Building 10-CRC, Room 5E-3332, 10 Center Dr, Bethesda, MD 20892; e-mail: dunbarc@nhlbi.nih.gov; and Neal S. Young, National Heart, Lung and Blood Institute, National Institutes of Health, Building 10-CRC, Room 3E-5232, 10 Center Dr, Bethesda, MD 20892; e-mail: youngn@nhlbi.nih.gov.

