

Key Points
Terminal differentiation of MEDEP cells, but not of MEL and G1ER cells, is very similar to that of primary murine erythroid cells.
Erythroid cell proteomes have limited correlation with transcriptomes due to differences in translation efficiency and protein stability.

Abstract
Murine-based cellular models have provided and continue to provide many useful insights into the fundamental mechanisms of erythropoiesis, as well as insights into the pathophysiology of inherited and acquired red cell disorders. Although detailed information on many aspects of these cell models is available, comprehensive proteomic data are lacking. This is a critical knowledge gap, as proteins are effectors of most biologic processes. To address this critical unmet need, proteomes of the murine cell lines Friend erythroleukemia (MEL), GATA1 erythroid (G1ER), and embryonic stem cell–derived erythroid progenitor (MEDEP) and proteomes of cultured murine marrow–derived erythroblasts at different stages of terminal erythroid differentiation were analyzed. The proteomes of MEDEP cells and primary murine erythroid cells were most similar, whereas those of MEL and G1ER cells were more distantly related. We demonstrated that the overall cellular content of histones does not decrease during terminal differentiation, despite strong chromatin condensation. Comparison of murine and human proteomes throughout terminal erythroid differentiation revealed that many noted transcriptomic changes were significantly dampened at the proteome level, especially at the end of the terminal differentiation process. Analysis of the early events associated with induction of terminal differentiation in MEDEP cells revealed divergent alterations in associated transcriptomes and proteomes. These proteomic data are powerful and valuable tools for the study of fundamental mechanisms of normal and disordered erythropoiesis and will be of broad interest to a wide range of investigators for making the appropriate choice of various cell lines to study inherited and acquired diseases of the erythrocyte.
Introduction
Model organisms have been critical tools used for understanding normal and perturbed erythropoiesis in humans. Murine-based cellular models have been particularly useful, providing many critical insights into fundamental mechanisms of erythropoiesis, including gene regulation, cytokine signaling, globin synthesis, cellular metabolism, membrane structure and function, iron homeostasis, and other critical cellular activities. These models have enabled improved understanding of many inherited and acquired diseases of the erythrocyte including the hemoglobinopathies, abnormalities of erythrocyte shape and metabolism, iron homeostasis, porphyria, and many other disorders.
These murine models include Friend murine erythroleukemia (MEL) cells,1 GATA1 erythroid (G1ER) cells,2 mouse embryonic stem cell–derived erythroid progenitor (MEDEP) cells,3 and cultured primary erythroid cells isolated from bone marrow, spleen, and fetal liver. MEL cells, blocked at the proerythroblast stage by the Friend retrovirus complex, can be induced to terminal differentiation by chemical compounds.1,4 G1ER cells, established from Gata1− embryonic stem (ES) cells, express an estrogen-inducible, Gata1-estrogen receptor fusion protein, which, when activated, induces the differentiation process. MEDEP cells, derived from wild-type ES cells after induction of hematopoietic differentiation can be induced to terminally differentiate after stimulation by erythropoietin (Epo). These models have many advantages including ease of genetic manipulation and unlimited amplification potential. As a result, these cell lines have been used in many recent studies of erythropoiesis.5-13 Murine cellular models have been particularly informative in studies of terminal erythroid differentiation (TED). This process begins with differentiation of proerythroblasts into basophilic erythroblasts, then polychromatic erythroblasts, and then orthochromatic erythroblasts that enucleate to become reticulocytes. Characteristics of TED include gradual decrease in cell size, condensation of nuclear chromatin, production of large amounts of hemoglobin, membrane reorganization, and finally, enucleation.14,15 These changes are associated with differentiation stage–specific changes in gene expression, chromatin accessibility, and DNA methylation.16
A critical unmet need in the use of murine cellular models of erythropoiesis has been the lack of comprehensive proteomic data for comparative analyses. To address this need, the proteomes of MEL and G1ER cells, as well as MEDEP and cultured primary murine erythroblasts obtained from bone marrow, were obtained at different stages of TED. Proteomes of murine cellular models were compared, showing that, despite marked hemoglobinization, MEL and G1ER cells did not reach the end of TED and arrested at the basophilic erythroblast stage.
Comparison of murine and human proteomes throughout TED yielded conserved and divergent features and revealed proteome buffering to reduce the impact of interspecies transcriptome changes. Significant differences between transcriptomes and proteomes were observed at baseline and after differentiation. Proteomic analyses of these models demonstrated their utility in addressing controversies in erythropoiesis, such as purported loss of histones in the late stages of differentiation, and in understanding early induction events in TED. These studies highlight the importance of proteomic results for obtaining important physiological insights into erythropoiesis. These data are a resource for deciphering fundamental mechanisms of erythropoiesis and obtaining insight into regulatory networks involved in inherited and acquired disordered erythropoiesis.
Methods
The design of the whole study is presented in supplemental Figure 1.
Cell cultures
Methods for cell cultures and differentiation features are detailed in the supplemental Data and supplemental Figure 2.
Erythroid cell lines.
Cell differentiation analysis.
Cellular characteristics of TED were determined as described18 by benzidine staining of hemoglobinized cells, analysis of erythroblast morphology by May-Grünwald-Giemsa staining of cytocentrifuged cells, determination of total cellular heme,19 and flow cytometry analysis with the following antibodies (all from BD Biosciences): anti-Kit-APC (cat number 553356), anti-Ter119-PE (553673), anti-CD44-PE-Cy7 (560569), and anti-CD71-FITC (553266).
Proteomic analyses
Samples for mass spectrometry (MS) were prepared from 3 independent cultures of MEL, G1ER, and MEDEP cells and 4 independent cultures of primary cells at various differentiation times. Peptides were prepared from erythroid cells, as previously described,18 and separated into 5 fractions by strong cationic exchange StageTips20 before analysis on a Q-Exactive Plus mass spectrometer (Thermos Scientific). The MS data were analyzed using Maxquant,21 with a false discovery rate <1% on both peptides and proteins. Statistical analyses and data comparisons were performed with Perseus software.22 Protein copy number per cell was calculated according to Wiśniewski et al.23,24 A detailed description of the proteomic analysis methods is provided in the supplemental Data.
Transcriptome analyses
RNA was prepared from 3 independent cultures of MEDEP cells by using Trizol reagent (Ambion). Strand-specific RNA sequencing libraries were created and sequenced on an Illumina Hiseq 4000 system to generate paired-end 100-bp reads. Transcript abundance was quantified with Kallisto pseudoalignment software, using Gencode release 16-GRCm38.p5 transcript and genome information.25 The DESEQ2 package was used to obtain transcripts-per-million reads and regularized log expression values and to identify differentially expressed genes.
Results
Proteomic analyses show that the cellular histone content does not decrease during TED
Proteomic analyses yielded 435 raw MS files, which were analyzed together by the match-between-run function of Maxquant. Match between run improves the detection of proteins expressed at low levels but only marginally affected the accuracy of protein quantification.18,26 Overall, label-free quantification (LFQ) values were obtained for 7234 proteins, with nearly the same number of quantified proteins in each cellular model (supplemental Table 1; Figure 1A). Recent developments of proteomic analyses have shown that high-throughput absolute quantification of proteins can be achieved starting from LFQ values. The total protein approach (TPA), as described by Mann’s team,23 requires the independent absolute quantification of a reference protein or a set of proteins to derive the quantification of other proteins with an LFQ value (supplemental Data). We used this quantification method to determine whether the cellular histone content decreases during the chromatin condensation that occurs during TED. Indeed, although it has been reported that histones migrate from the nucleus to the cytoplasm during TED, it is unclear whether this migration leads to a net decrease of the cellular histone content. To address this question, we used both primary cells and MEDEP cells, because MEDEP cell TED is very similar to physiological differentiation (see "Comparison of cellular models") and these cells enucleate as efficiently as primary cells in cell culture after major reduction in nuclear size (supplemental Figure 2). First, we observed that simultaneous determination of DNA and histone cellular content23 did not reveal any significant decrease in the histone content per cell during the TED of MEDEP cells (Figure 1B). We also used the TPA approach with different reference proteins. The total amount of protein per cell was determined by a colorimetric assay (bicinchoninic acid [BCA] values). As expected, the total amount of cellular proteins decreased strongly during TED, both in primary and MEDEP cells (Figure 1C). Absolute quantifications of proteins identified by MS were very similar when using either these experimental BCA values or the theoretical 5.5 pg of histone per cell as the reference (Figure 1D). Histone quantifications retrieved from the MS absolute quantifications using the BCA values as a reference, remained constant throughout TED (Figure 1C), and close to the 5.5 pg theoretical value. As further validation, heme and globin were used to quantify cellular proteins, including histones, at the end of terminal differentiation. At this stage, most heme molecules are associated with globins with the cellular content of heme providing an accurate quantification of the amount of cellular globins. Starting from heme quantification (supplemental Figure 2G), the globin content of MEDEP and primary cells at the 2 last differentiation times was calculated, and this value was used as a standard for absolute quantification of other cellular proteins from the MS data. Protein quantifications using globins as the standard were very similar to those obtained using histones as the standard (Figure 1D). The total histone content was retrieved from these quantifications using globins as the internal standard, yielding values of 5.6 pg for MEDEP cells and 8.7 pg for primary cells at the end of the terminal differentiation process. These values are similar to or slightly higher than the theoretical 5.5 pg of histones per murine diploid cell. Taken together, these independent analyses indicate that there is not a significant decrease in overall cellular histone content at the end of erythroid differentiation. In the subsequent analyses, histones will be used as the reference for protein quantification to suppress variability linked to cell counting and protein or heme quantification.
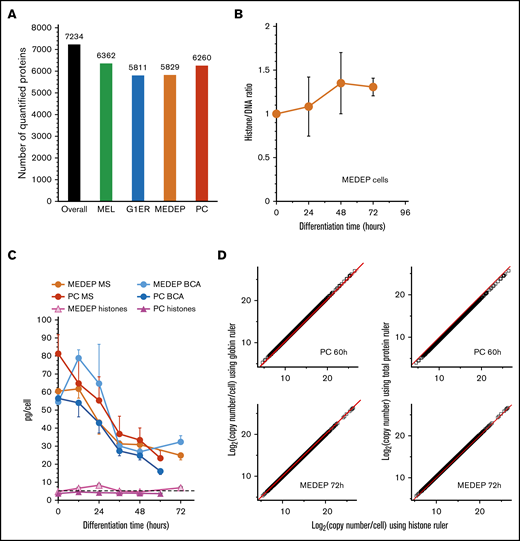
Proteomic analysis shows that the overall cellular histone content does not decrease during TED. (A) The number of quantified proteins in the different cellular models; the number of proteins with a LFQ value in at least 1 differentiation stage is indicated. (B) Evolution of the histone/DNA ratio in MEDEP cells during TED. Arbitrary histone quantification values were obtained by summing the LFQ values for all histone proteins. DNA values were obtained from optical density 260 (OD260) of deoxynucleotides after DNase digestion of DNA, as previously described23 and as set forth in the supplemental Methods. At each time, the ratio (arbitrary histone LFQ quantification/DNA OD260) was calculated and ratios at each differentiation time were expressed relative to this ratio at T0. (C) Protein quantification using either histones or total cellular protein content as the reference. Total cellular protein content was calculated using the BCA colorimetric assay from 1 million cells (BCA curves) or using the MS LFQ values and a standard histone value of 5.5 pg per cell as reference (MS curves). The histone curves were calculated by using the MS LFQ values and the total cellular protein content determined using the BCA colorimetric assays as the reference. The standard deviation labels of histones curves are smaller than the symbols at each point. (D) Protein quantification at the end of TED using MS LFQ values and either total cellular protein amounts determined by BCA assay (panel C; BCA curves), histones or globins as the reference. A standard histone value of 5.5 pg per cell was used for protein quantification with histones as the reference. Cellular globin contents for MEDEP and primary cells (PCs) were calculated using the heme quantification values presented in supplemental Figure 2G. Red lines display theoretical perfect correlation. Error bars represent the standard deviation of 3 (MEL, G1ER, or MEDEP cells) or 4 independent experiments (PCs, panel D; and MEDEP cells, panel B).
Proteomic analysis shows that the overall cellular histone content does not decrease during TED. (A) The number of quantified proteins in the different cellular models; the number of proteins with a LFQ value in at least 1 differentiation stage is indicated. (B) Evolution of the histone/DNA ratio in MEDEP cells during TED. Arbitrary histone quantification values were obtained by summing the LFQ values for all histone proteins. DNA values were obtained from optical density 260 (OD260) of deoxynucleotides after DNase digestion of DNA, as previously described23 and as set forth in the supplemental Methods. At each time, the ratio (arbitrary histone LFQ quantification/DNA OD260) was calculated and ratios at each differentiation time were expressed relative to this ratio at T0. (C) Protein quantification using either histones or total cellular protein content as the reference. Total cellular protein content was calculated using the BCA colorimetric assay from 1 million cells (BCA curves) or using the MS LFQ values and a standard histone value of 5.5 pg per cell as reference (MS curves). The histone curves were calculated by using the MS LFQ values and the total cellular protein content determined using the BCA colorimetric assays as the reference. The standard deviation labels of histones curves are smaller than the symbols at each point. (D) Protein quantification at the end of TED using MS LFQ values and either total cellular protein amounts determined by BCA assay (panel C; BCA curves), histones or globins as the reference. A standard histone value of 5.5 pg per cell was used for protein quantification with histones as the reference. Cellular globin contents for MEDEP and primary cells (PCs) were calculated using the heme quantification values presented in supplemental Figure 2G. Red lines display theoretical perfect correlation. Error bars represent the standard deviation of 3 (MEL, G1ER, or MEDEP cells) or 4 independent experiments (PCs, panel D; and MEDEP cells, panel B).
Absolute quantification of proteins during TED
Absolute protein quantification measurements demonstrated good reproducibility with mean coefficients of variation of 23% to 44% for the different cell types. The clustering analysis presented in Figure 2A shows an example of this reproducibility in the 4 independent primary cell cultures. Four major clusters of proteins with similar patterns of expression during TED were identified (supplemental Figure 3) in a clustering pattern similar to that observed during human erythropoiesis.18 The most abundant cluster (A) contained 4700 proteins with expression that gradually decreased during TED, mimicking the decrease in overall protein content. Most erythroid-specific proteins, such as the globins and Band3, were contained in the second cluster (B), where proteins gradually accumulated during the differentiation process. Proteins with more transient expression (ie, increased early and subsequently decreased), such as enzymes of the heme biosynthetic pathway, were contained in the third cluster (C). The fourth cluster (D) contained proteins with increased expression in the early stages of terminal differentiation.
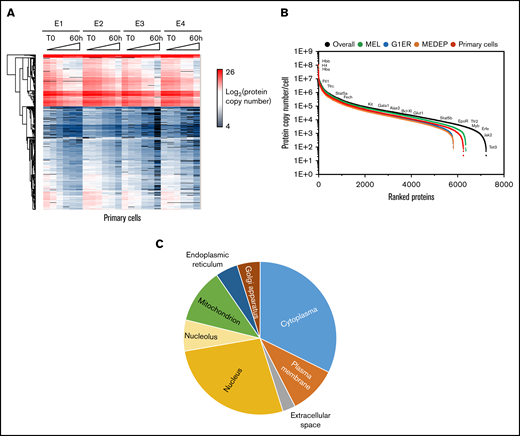
Overall proteomic results. (A) Hierarchical clustering analysis of the proteins quantified in the 4 experiments (E1-E4) with primary cells (log2 of copy numbers). (B) Range of protein expression in the different cellular models. For each cellular model, the mean expression value at each differentiation time was calculated, and the highest mean was used for this figure. (C) Subcellular distribution of the quantified proteins, according to Gene Ontology cellular component annotations. Absolute quantifications were determined using histones as the reference.
Overall proteomic results. (A) Hierarchical clustering analysis of the proteins quantified in the 4 experiments (E1-E4) with primary cells (log2 of copy numbers). (B) Range of protein expression in the different cellular models. For each cellular model, the mean expression value at each differentiation time was calculated, and the highest mean was used for this figure. (C) Subcellular distribution of the quantified proteins, according to Gene Ontology cellular component annotations. Absolute quantifications were determined using histones as the reference.
Comparison of cellular models
Cellular characteristics of TED were confirmed by benzidine staining, analysis of erythroblast morphology, determination of total cellular heme, and flow cytometry analysis (supplemental Data; supplemental Figure 2). The pattern of expression of CD44, CD71, Gypa, and Kit, determined by MS for primary cells (supplemental Figure 4), was very similar to their cell surface expression, determined by fluorescence-activated cell sorting (supplemental Figure 2A). The expression patterns of differentiation markers were similar in MEDEP and cultured primary cells. In contrast, Gypa and Band3 accumulation was reduced in MEL and G1ER cells, and Kit was not detectable in MEL cells (supplemental Figure 4).
Total protein content of MEDEP and cultured primary erythroblasts decreased similarly during terminal differentiation, whereas MEL and G1ER cells demonstrated a less dramatic decrease (Figure 3A). Comparing the proteomes of the different cell lines with the proteome of primary cells during differentiation revealed that the TED of MEDEP and primary cells were very similar, whereas the proteomes of MEL and G1ER cells were different from that of the primary cells, especially at the end of differentiation (Figure 3B). The expression pattern of each protein quantified in the differentiation models was compared to its expression pattern in primary cells (Figure 3C-D). The poor correlation of proteome modifications between MEL and G1ER and primary cells was mainly due to the absence of a decrease in protein content during TED in G1ER and MEL cells. An enrichment term analysis revealed links between proteins with an abnormal expression pattern during TED of MEL and G1ER cells with overrepresentation of proteins associated with hydrogen ion transport, lysosome, endocytosis, and lipoproteins for both cell lines. In contrast, this enrichment analysis did not reveal any link for the few proteins with poor correlation of expression patterns in MEDEP cells compared with primary cells (Figure 3D). These analyses confirmed that the TED of MEDEP cells was close to the physiological process, whereas that of MEL and G1ER cells was more distantly related, especially during the late stages of TED (Figure 3C-D).
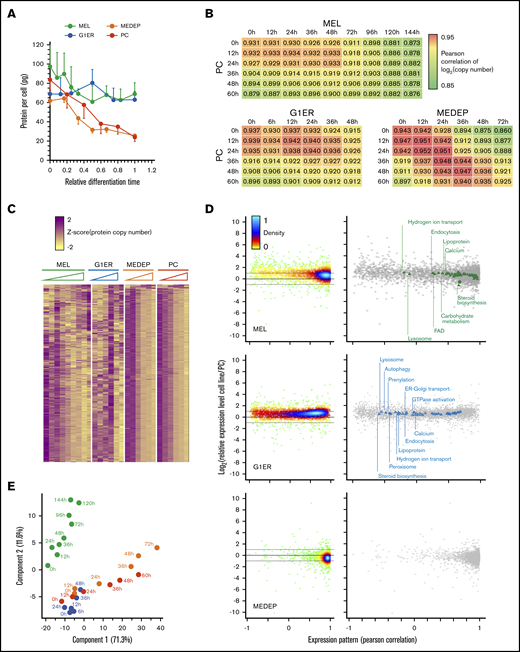
Comparison of primary cell differentiation with that of MEL, G1ER, and MEDEP cells. (A) Evolution of the total protein content throughout the differentiation process. The total protein content was calculated by summing the amounts of each protein quantified by MS analysis. (B) Comparison of the primary cell (PC) proteome throughout the differentiation process with the proteomes of MEDEP, MEL, and G1ER cells. Values correspond to Pearson correlation coefficients. (C) Hierarchical clustering analysis of protein expression during TED of MEL, G1ER, MEDEP, and PCs. Protein expression values were z-score transformed before clustering analysis. (D) Comparison of the expression pattern and the absolute protein expression in PCs and cells from cellular models. Each point corresponds to one of the proteins quantified in both PCs and the cell line. The Pearson correlation coefficient of the expression pattern (x-axis) was calculated after z-score transformation of the quantification values. The ratio of the median expression value in the cell line to the median expression value in PCs is indicated (y-axis). Right: Gene Ontology cellular component term enrichment analysis. Annotations (triangles) are superimposed on individual protein data. The coordinates of the crosses correspond to the median values of all proteins carrying the concerned annotation. (E) PCA of the proteome evolution in the different cellular models. Log2 of the expression values were used for this analysis: green dots, MEL cells; blue dots, G1ER cells; orange dots, MEDEP cells; red dots, PCs.
Comparison of primary cell differentiation with that of MEL, G1ER, and MEDEP cells. (A) Evolution of the total protein content throughout the differentiation process. The total protein content was calculated by summing the amounts of each protein quantified by MS analysis. (B) Comparison of the primary cell (PC) proteome throughout the differentiation process with the proteomes of MEDEP, MEL, and G1ER cells. Values correspond to Pearson correlation coefficients. (C) Hierarchical clustering analysis of protein expression during TED of MEL, G1ER, MEDEP, and PCs. Protein expression values were z-score transformed before clustering analysis. (D) Comparison of the expression pattern and the absolute protein expression in PCs and cells from cellular models. Each point corresponds to one of the proteins quantified in both PCs and the cell line. The Pearson correlation coefficient of the expression pattern (x-axis) was calculated after z-score transformation of the quantification values. The ratio of the median expression value in the cell line to the median expression value in PCs is indicated (y-axis). Right: Gene Ontology cellular component term enrichment analysis. Annotations (triangles) are superimposed on individual protein data. The coordinates of the crosses correspond to the median values of all proteins carrying the concerned annotation. (E) PCA of the proteome evolution in the different cellular models. Log2 of the expression values were used for this analysis: green dots, MEL cells; blue dots, G1ER cells; orange dots, MEDEP cells; red dots, PCs.
A principal component analysis (PCA) confirmed these observations by showing that the proteome of MEL and G1ER cells clustered with MEDEP and primary erythroblast cells, only up to the differentiation times that correspond to the basophilic erythroblast stage for the primary cells, whereas the proteomes of MEDEP and primary cells clustered throughout the TED (Figure 3E). G1ER cell proteomic expression data agree with transcriptome data, which also demonstrate that differentiated G1ER cells correlate with the basophilic erythroblast stage.27 Thus, G1ER cells constitute an acceptable model for the studies of the early stages of TED, especially for the study of the role and mechanisms of Gata1 function, but their relevance for the study of later differentiation stages is unclear.
We refined the relationship between TED of MEDEP and primary cells. A PCA of the MEDEP and primary cell proteomes showed a high correlation between the patterns of protein expression at each differentiation stage (Figure 4A). We carefully analyzed the expression of proteins specifically involved in erythroid differentiation, such as erythroid transcription factors and proteins involved in iron metabolism. These data provide interesting general insights regarding the TED process. Before the onset of TED, erythroid cells already express submaximum levels of many proteins that will subsequently play specific roles during the TED. This is especially the case for most proteins involved in iron metabolism and heme synthesis (Figure 4B-C), except for Alas2, Mitoferrin1 (Slc25a37), and HRI (Eif2ak1), with expression that is induced at the onset of TED. Ferritin H and L were expressed at very high levels before the onset of TED in primary and MEDEP cells, demonstrating the potential capacity of late erythroid progenitors to store very high amounts of iron before the beginning of the TED process. Alas2 was not detected in MEDEP cells before the onset of TED or in primary cells at the first time of differentiation. In both cases, it was induced very rapidly when cells enter the TED process with the simultaneous increase of heme synthesis (supplemental Figure 2G). At each differentiation stage, Ppox, Fech, and 2 putative protoporphyrinogen IX importers into the mitochondrial matrix, Abcb10 and Tmem14c, were expressed at the same levels, in agreement with the hypothesis that these proteins could form a complex inside the mitochondria.28
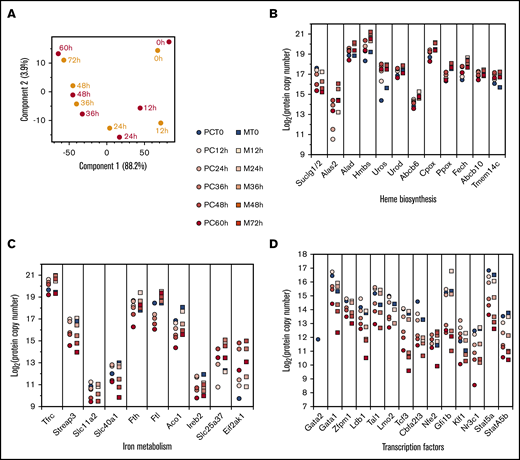
Comparison of MEDEP and primary cell differentiation. (A) PCA of the proteome evolution in primary cells (red dots) and MEDEP cells (orange dots) at different differentiation stages. Z-score transformation values were used for this analysis. (B-C) Absolute quantification of proteins involved in heme biosynthesis (B) and in iron metabolism (C) in primary erythroid precursors (PC, circles) and MEDEP cells (M, squares) during the differentiation process. (D) Absolute quantification of transcription factors involved in erythroid differentiation during primary cell and MEDEP cell differentiation (same symbols as in panels B and C).
Comparison of MEDEP and primary cell differentiation. (A) PCA of the proteome evolution in primary cells (red dots) and MEDEP cells (orange dots) at different differentiation stages. Z-score transformation values were used for this analysis. (B-C) Absolute quantification of proteins involved in heme biosynthesis (B) and in iron metabolism (C) in primary erythroid precursors (PC, circles) and MEDEP cells (M, squares) during the differentiation process. (D) Absolute quantification of transcription factors involved in erythroid differentiation during primary cell and MEDEP cell differentiation (same symbols as in panels B and C).
Except for Gata2, detected in primary cells at the onset of TED but not in undifferentiated MEDEP cells, erythroid transcription factors were expressed at similar levels throughout TED in primary and MEDEP cells (Figure 4D). Interestingly, undifferentiated MEDEP cells already expressed a high level of Gata1, and Gata1 expression increased only slightly after induction of differentiation and subsequently decreased. This decrease is consistent with the decrease in open chromatin GATA1 occupancy seen in human late TED.29,30
Transcriptome-proteome relationship during terminal differentiation
RNA sequencing of MEDEP cells was performed at each stage of TED (supplemental Table 2). PCA analyses illustrated both the reproducibility of the TED process and the continuous modification of gene expression (Figure 5A). Quantitative analyses of messenger RNA (mRNA) and protein expression at each stage of differentiation showed that, although there were marked changes in transcriptome during TED, these changes were dampened at the proteome level (Figure 5B-C). The quantitative relationships between mRNA and protein expression was low, especially at the end of TED (Figure 5D). Translation efficiency (TE) changes during TED.31 Correcting the mRNA expression values by the reported TE partly improved the relationship between mRNA and protein expression (Figure 5D). However, this improvement was rather limited and did not prevent the strong decrease in correlation at the end of TED (Figure 5F). To our knowledge, the stability of proteins during murine TED was not reported. We used protein half-life values determined in mouse fibroblasts to evaluate the contribution of differences in protein stability to the discrepancy between transcriptome and proteome.32 The modifications of protein expression during TED were strongly connected to the stability of each protein (Figure 5E). Correcting protein expression by protein half-life reduced the discrepancy between the cellular proteome and transcriptome (Figure 5D,F). Altogether, our analyses showed that variabilities regarding both TE and protein stability explain some of the poor correlation between the transcriptome and the proteome during TED, especially at the end of the differentiation process.
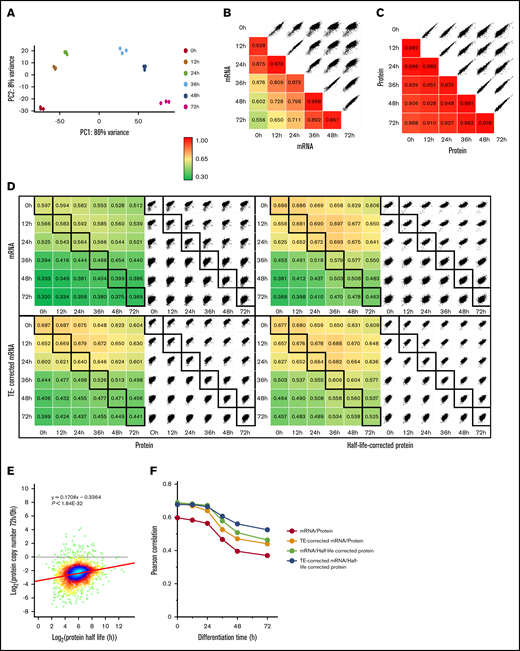
Relationship between the transcriptome and the proteome during MEDEP differentiation. (A) PCA of the mRNA expression in the 3 independent differentiation experiments using MEDEP cells (rlog: regularized log2 of read count values for the 500 most variable genes). (B-C) Pearson correlation analysis of the mRNA (B) and protein (C) expression during MEDEP differentiation. Log2 values of the expression values in transcripts per million reads (mRNA) or copy number per cell (proteins) were used for calculation. (D) Relationship between mRNA and protein expression, determined by Pearson correlation analysis, using the same expression values as in panels B and C. TE-corrected RNA values were obtained by multiplying RNA expression values by their TE factor obtained from Alvarez-Dominguez et al.31 Half-life–corrected protein values were obtained by dividing protein expression values by their half-life obtained from Schwanhäusser et al.32 (E) Correlation between the modification of protein expression during TED and protein stability. (F) Both TE and protein stability contribute to the poor correlation between the MEDEP cell transcriptome and proteome during TED.
Relationship between the transcriptome and the proteome during MEDEP differentiation. (A) PCA of the mRNA expression in the 3 independent differentiation experiments using MEDEP cells (rlog: regularized log2 of read count values for the 500 most variable genes). (B-C) Pearson correlation analysis of the mRNA (B) and protein (C) expression during MEDEP differentiation. Log2 values of the expression values in transcripts per million reads (mRNA) or copy number per cell (proteins) were used for calculation. (D) Relationship between mRNA and protein expression, determined by Pearson correlation analysis, using the same expression values as in panels B and C. TE-corrected RNA values were obtained by multiplying RNA expression values by their TE factor obtained from Alvarez-Dominguez et al.31 Half-life–corrected protein values were obtained by dividing protein expression values by their half-life obtained from Schwanhäusser et al.32 (E) Correlation between the modification of protein expression during TED and protein stability. (F) Both TE and protein stability contribute to the poor correlation between the MEDEP cell transcriptome and proteome during TED.
Transcript and protein changes at the onset of terminal differentiation
In culture, primary erythroid progenitor cells require Epo for both expansion and differentiation, whereas stem cell factor (SCF) and dexamethasone (dex) cooperate with Epo to promote expansion and arrest differentiation.33 Undifferentiated MEDEP cells grow in the presence of SCF and dex, with their terminal differentiation induced by Epo (Figure 6A). The similarities in growth factor responsiveness between MEDEP and primary cells and the ability to synchronously induce MEDEP cell terminal differentiation suggest they may be a valuable model for deciphering mechanisms controlling the onset of terminal differentiation. MEDEP cells were treated with different growth factor combinations to determine their effects on cell differentiation. Epo alone or in the presence of SCF was sufficient to induce terminal differentiation. Interestingly, Epo treatment of cells for 12 hours was sufficient to prime MEDEP cells for terminal differentiation, as cells were then able to achieve differentiation with addition of SCF and dex in the absence of Epo. Blocking heme synthesis with succinyl acetone during this 12-hour period did not abolish the cell priming for TED (Figure 6A). Two-dimensional enrichment analysis34 was performed to ascertain whether similar changes occur in the proteome occurring in the first 12 hours of terminal differentiation in primary cells and in MEDEP cells. These analyses revealed enrichment of proteins involved in heme biosynthesis and a decrease in proteins involved in ribosome biosynthesis during the first 12 hours of terminal differentiation in both cellular models (Figure 6B).
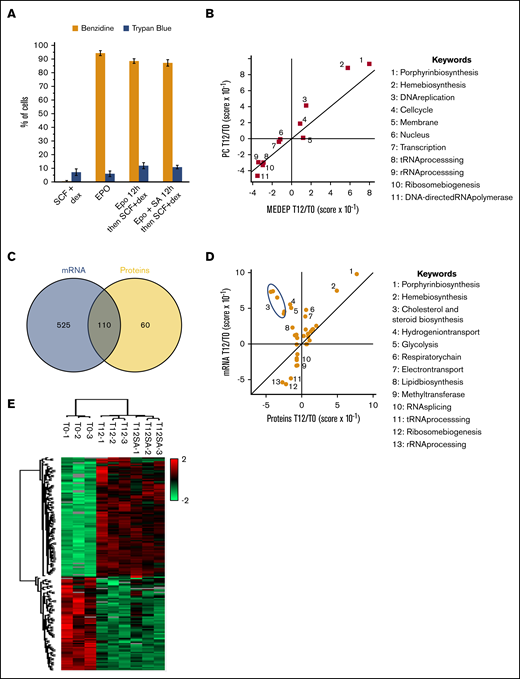
Changes in gene expression at the onset of MEDEP differentiation. (A) MEDEP differentiation induction by growth factors. MEDEP cells were treated for 72 hours with SCF and dex or Epo or, where indicated, for 12 hours only with Epo in the presence or absence of succinyl acetone (SA) and then with SCF+dex after removal of Epo. After 72 hours, hemoglobinization was monitored by benzidine staining and cell viability by trypan blue exclusion. (B) Two-dimensional annotation enrichment analysis of the proteome modifications occurring during the first 12 hours in MEDEP and primary cell differentiation was performed, using the Uniprot Keywords database (supplemental Table 1). This method identifies annotation terms whose corresponding proteins exhibit consistent behavior in 1 data set and analyzes the behavior of all proteins with the same annotation in a second data set, thus enabling the detection of similarities or divergences. (C) Venn diagram showing the mRNA and proteins with a significant modification during the first 12 hours of MEDEP differentiation. Only gene expression quantified at both the transcriptomic and the proteomic level were used for this analysis. (D) Two-dimensional annotation analysis of the transcriptome and proteome modifications during the first 12 hours of MEDEP differentiation. (B,D) Keyword annotations corresponding to the numbers on the main graph (right). (E) Hierarchical clustering analysis of the proteins differentially expressed after 12-hour incubation with Epo (T12H) or with Epo and SA (T12HSA), compared with cells incubated with SCF and dex (T0) (z-score–transformed values).
Changes in gene expression at the onset of MEDEP differentiation. (A) MEDEP differentiation induction by growth factors. MEDEP cells were treated for 72 hours with SCF and dex or Epo or, where indicated, for 12 hours only with Epo in the presence or absence of succinyl acetone (SA) and then with SCF+dex after removal of Epo. After 72 hours, hemoglobinization was monitored by benzidine staining and cell viability by trypan blue exclusion. (B) Two-dimensional annotation enrichment analysis of the proteome modifications occurring during the first 12 hours in MEDEP and primary cell differentiation was performed, using the Uniprot Keywords database (supplemental Table 1). This method identifies annotation terms whose corresponding proteins exhibit consistent behavior in 1 data set and analyzes the behavior of all proteins with the same annotation in a second data set, thus enabling the detection of similarities or divergences. (C) Venn diagram showing the mRNA and proteins with a significant modification during the first 12 hours of MEDEP differentiation. Only gene expression quantified at both the transcriptomic and the proteomic level were used for this analysis. (D) Two-dimensional annotation analysis of the transcriptome and proteome modifications during the first 12 hours of MEDEP differentiation. (B,D) Keyword annotations corresponding to the numbers on the main graph (right). (E) Hierarchical clustering analysis of the proteins differentially expressed after 12-hour incubation with Epo (T12H) or with Epo and SA (T12HSA), compared with cells incubated with SCF and dex (T0) (z-score–transformed values).
Transcriptome and proteome changes in MEDEP cells induced for 12 hours with Epo were quantitated and compared. Expression of 635 mRNA and 170 proteins was significantly modified (P < 1%; fold change >1.5) after Epo induction, with 110 showing similar patterns of regulation at both the transcriptomic and proteomic level (Figure 6C; supplemental Table 3). Of note, expression of genes involved in cholesterol and steroid biogenesis increased, whereas accumulation of corresponding proteins decreased. The most significant increase in both mRNA (P < 3 × 10⁻⁸) and protein expression (P < 3.6 × 10⁻⁴) during the first 12 hours of MEDEP terminal differentiation included proteins involved in heme biosynthesis (Figure 6D). Blocking heme synthesis during this priming period led to minor effects on proteome modification (Figure 6E; supplemental Table 3).
One hundred thirteen genes and 43 proteins that were differentially expressed at this early time point have been identified as Gata1 targets in G1ER cells.35 This highly significant enrichment (P < 1.1E-14) was foreseeable, as Gata1 is a master regulator of erythroid differentiation. However, proteomic data indicate Gata1 protein is already near its maximum level before Epo induction, and no significant increase in Gata1 protein is detected during the first 12 hours of Epo stimulation (Figure 4D; supplemental Tables 1 and 3). This finding implies that either post translational modifications of Gata1 itself or modifications in the composition of the Gata1 complex induced by Epo are responsible for this activation of Gata1 transcriptional activity. How Gata1 is activated at the onset of TED in Epo-treated cells is a crucial question for better understanding the induction of TED.
Proteome conservation and divergence during human and murine erythropoiesis
The proteomes of human and murine primary erythroid cells and their changes during TED were compared. The early human progenitor stage (Prog1) was excluded from analysis as it corresponds primarily to late BFUe cells,18 whereas the less differentiated murine cells analyzed in this study were CFUe. Although human erythroblasts contained more proteins than their murine counterparts, the overall protein content changed in a very similar pattern during human and murine erythropoiesis (Figure 7A). Global stage-specific patterns of expression were conserved between species (Figure 7B) with proteomes of human and murine erythroid progenitors demonstrating a high degree of similarity at each intermediate step of TED (Figure 7C). Most proteins exhibited similar patterns of expression in murine and human erythroblasts, with a few exceptions such as Gfi1b, Nfe2, and Klf13. Their levels of expression were also similar with few exceptions, such as Klf1 and Zfpm1 (Figures 7D-F). Several transcription factors can directly associate with Gata1 or are recruited with Gata1 to the same control elements of erythroid genes,13,36-38 thus their expression relative to Gata1 could be more important than their absolute level of expression. Although the pattern of GATA1 expression is similar during murine and human TED, the relative expression of GATA1 and some of its partners could be different and probably contributes to the discrepancies observed at the transcriptomic level between human and murine erythropoiesis (Figure 7F).
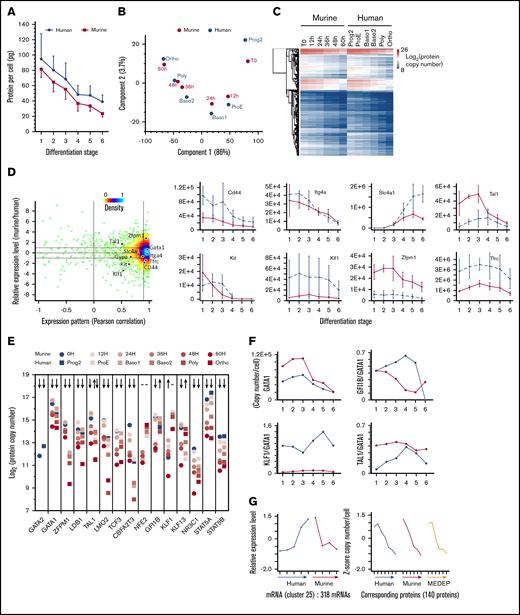
Comparison of the evolution of the erythroblast proteome during human and murine erythropoiesis. (A) A comparison of the overall protein content in primary human and murine erythroblasts. The total protein content was calculated by summing the amounts of each protein quantified by MS analysis. (B) PCA of the protein expression in murine and human erythroblasts (log2 of the copy number per cell values). (C) Hierarchical clustering analysis of the protein expression (in log2) during murine and human erythropoiesis. (D) Comparison of the expression pattern and the absolute protein expression in murine and human erythropoiesis. Each point corresponds to one of the proteins quantified in both human and murine erythropoiesis. The Pearson correlation coefficient of the expression pattern (x-axis) was calculated after z-score transformation of the expression values. The ratio of the median expression value in mice to the median expression value in human erythropoiesis is indicated (y-axis). Right: the expression of selected proteins is indicated (protein copy number in linear scale). (E) Expression of the main transcription factors during human and murine erythropoiesis. (F) Absolute expression of Gata1 and relative expression of Gfi1B, Tal1, and Klf1 compared with Gata1 during human and murine erythropoiesis. (G) Mean expression (left) of 318 mRNAs with an opposite pattern of expression during human and murine erythropoiesis.16 A total of 140 proteins encoded by these mRNAs were quantified in both human and murine primary cells and in MEDEP cells (right). See supplemental Figure 7 for a comprehensive comparison of the protein expression in the different clusters reported in An et al.16
Comparison of the evolution of the erythroblast proteome during human and murine erythropoiesis. (A) A comparison of the overall protein content in primary human and murine erythroblasts. The total protein content was calculated by summing the amounts of each protein quantified by MS analysis. (B) PCA of the protein expression in murine and human erythroblasts (log2 of the copy number per cell values). (C) Hierarchical clustering analysis of the protein expression (in log2) during murine and human erythropoiesis. (D) Comparison of the expression pattern and the absolute protein expression in murine and human erythropoiesis. Each point corresponds to one of the proteins quantified in both human and murine erythropoiesis. The Pearson correlation coefficient of the expression pattern (x-axis) was calculated after z-score transformation of the expression values. The ratio of the median expression value in mice to the median expression value in human erythropoiesis is indicated (y-axis). Right: the expression of selected proteins is indicated (protein copy number in linear scale). (E) Expression of the main transcription factors during human and murine erythropoiesis. (F) Absolute expression of Gata1 and relative expression of Gfi1B, Tal1, and Klf1 compared with Gata1 during human and murine erythropoiesis. (G) Mean expression (left) of 318 mRNAs with an opposite pattern of expression during human and murine erythropoiesis.16 A total of 140 proteins encoded by these mRNAs were quantified in both human and murine primary cells and in MEDEP cells (right). See supplemental Figure 7 for a comprehensive comparison of the protein expression in the different clusters reported in An et al.16
Clustering analysis of protein expression patterns during murine and human erythropoiesis identified 4 primary expression patterns (supplemental Figure 5; supplemental Table 4). Two of these clusters (groups 1 and 2) had similar patterns of protein expression in human and murine erythroblasts and contained 96% of the proteins that showed changes in expression during TED. Interestingly, group 2, which contains proteins with a conserved pattern of increased expression, encompasses a large part of key actors of TED, including more recently described regulators, such as TMCC2,29 TRIM58,39 and XPO7.40 Other proteins of these small groups are also likely to play important, but yet to be defined, roles during TED.
Previous work identified clusters of mRNAs with opposite patterns of expression during either murine or human TED.16 Retrieval and comparison of the proteins corresponding to these mRNAs revealed that the expression pattern of the corresponding proteins was similar during murine and human erythropoiesis (Figures 7G; supplemental Figures 6 and 7). The observation that many interspecies discrepancies observed at the transcriptomic level disappeared at the proteomic level suggest translational or posttranslational mechanisms rectify transcriptional variation to eliminate or buffer strong divergences at the proteomic level during TED.
Discussion
Methods that enable absolute quantification of proteins in complex samples, such as whole cell extracts, have been recently developed. The TPA method provides an accuracy similar to that obtained using targeted methods and spiked peptide standards when using internal standards such as histones.23,24,41,42 The TPA method has been used for quantification of several cellular proteomes,18,43-48 including that of bacteria42 and yeast.49 In this study, we showed the capacity of these absolute quantification approaches to resolve important questions regarding cell differentiation processes. Using this methodology, we addressed the question of whether the strong chromatin condensation that occurs during TED, goes hand in hand with a decrease in the cellular content of histones. This question has remained unsolved since Hattangadi et al40 reported in 2014 that terminal erythroid maturation involves migration of histones into the cytoplasm, leaving erythroid nuclei depleted of proteins, including histones, at the end of differentiation. Zhao et al50,51 reported that histones are released into the cytoplasm following nuclear opening during TED, but they did not demonstrate that the histone content decreased during TED. In our previous work regarding human erythropoiesis, we did not observe a significant decrease of nuclear histones during TED.18 Our present results, validated by several independent analyses, show that the overall cellular content of histones did not decrease significantly during murine TED.
Because of their high amplification capacity, their synchronous differentiation processes, and the ease of using gene-editing approaches, cellular models have routinely been used to study murine erythropoiesis. Our results show that MEDEP cells, with a TED very similar to that of primary cells and controlled by Epo, constitute an acceptable model for TED studies and for the study of the mechanisms leading to induction of TED. In contrast, proteomes of differentiated MEL and G1ER cells most closely resembled basophilic erythroblasts, making them less desirable for studies of the later stages of TED.
The data sets we generated can be used in many ways to begin to interpret the transcriptional and translational control of erythropoiesis, such as generation of networks that regulate numerous biologic processes. They also provide a significant resource for studies of normal and perturbed erythropoiesis performed in these models, allowing a deeper understanding of mechanisms of erythroid development in various inherited and acquired erythroid disorders.
Mass spectrometry proteomic data have been deposited in the ProteomeXchange Consortium via the Proteomics Identifications Database (PRIDE; data set identifier PXD009384). RNA-seq transcriptome data have been deposited in the Gene Expression Omnibus database (accession number GSE120379).
Acknowledgments
The authors thank Virginie Salnot, Cédric Broussard, Evangeline Bennana, and David Rombaut (all from Plateforme de Proteomique, Université Paris-Descartes [3P5]) for their contribution to the proteomic analyses.
This work was supported in part by grants from the Laboratory of Excellence GR-Ex (ANR-11-LABX-0051) (P.M.) and National Institutes Health, National Institute of Diabetes and Digestive and Kidney Diseases grant DK32094 (N.M. and P.G.G). The labex GR-Ex is funded by the program Investissements d’Avenir of the French National Research Agency (ANR-11-IDEX-0005-02).
Authorship
Contribution: M. Ladli and F.V. performed the primary cell cultures; M. Leduc and P.M. performed the Friend and MEDEP cell cultures; C. Lefèvre and M.F. performed G1ER cell cultures; E.-F.G., M. Leduc, F.G., and P.M. performed the proteomic experiments; V.P.S., C.D.H., N.M., and P.G.G. performed transcriptomic experiments; E.F.G., M. Leduc, V.P.S., F.G., I.B., N.M., P.G.G., and P.M. analyzed the data; C. Lacombe, N.M., P.G.G., and P.M. wrote the manuscript; N.M., P.G.G., and P.M. designed the study; and all authors discussed the results and critically reviewed the manuscript.
Conflict-of-interest disclosure: The authors declare no competing financial interests.
Correspondence: Patrick Mayeux, Institut Cochin, 27 Rue du Faubourg Saint-Jacques, F75014 Paris, France; e-mail: patrick.mayeux@inserm.fr; and Patrick G. Gallagher, Yale University School of Medicine, 333 Cedar St, PO Box 208064, New Haven, CT 06520-8064; e-mail: patrick.gallagher@yale.edu.

