

Key Points
VEN in combination with HMAs is highly effective for AML with mutant NPM1 (NPM1+).
VEN with HMA therapy could be considered a mutation-targeted treatment in older patients with NPM1+ AML.

Abstract
Nucleophosmin-1 mutations (NPM1+) occur in ∼30% of acute myeloid leukemia (AML) patients. Although typically associated with favorable prognosis, the beneficial impact of NPM1+ decreases with increasing age in patients treated with standard intensive chemotherapy (IC) or hypomethylating agents (HMAs). This retrospective analysis compared outcomes of NPM1+ AML patients treated with 1 of 3 induction approaches: HMA plus BCL-2 inhibitor venetoclax (VEN), HMA, or IC therapy. Composite complete response (CRc: CR + CR with incomplete count recovery) was seen in 96% (27/28), 36% (17/47), and 89% (204/228) of HMA + VEN, HMA, and IC patients, respectively (HMA + VEN vs HMA, P < .001; HMA + VEN vs IC, P = .10). Older patients (age >65 years) treated with HMA + VEN, HMA, or IC had CR rates of 88%, 28%, and 56%, respectively (HMA + VEN vs HMA, P < .001; HMA + VEN vs IC, P = .01). Significant improvement in overall survival (OS) was seen in patients age >65 years treated with HMA + VEN vs HMA (not reached [NR] vs 0.4 years; P < .001) or IC (NR vs 0.93 years; P = .001). Older patients treated with HMA + VEN had OS of 80% after median 1-year follow-up, with estimated 2-year OS of 70%. In the multivariable Cox model analysis, HMA + VEN was associated with a 69% lower risk of death compared with IC (hazard ratio, 0.31; 95% confidence interval, 0.12-0.83; type I error–adjusted P = .038). HMA + VEN combinations demonstrated impressive results compared with traditional standard-of-care regimens in older patients with NPM1+ AML.
Introduction
Nucleophosmin-1 (NPM1) is a multifunctioning molecular chaperone involved in epigenetic cellular regulation through nuclear-cytoplasmic protein shuttling, ribosomal assembly, and maintenance of cellular senescence via interaction with the tumor suppressor p53.1,2 Mutations in NPM1 (NPM1+) occur in ∼30% of patients with acute myeloid leukemia (AML) and historically are associated with favorable response to standard intensive chemotherapy (IC), with both increased complete response (CR) rates and improved overall survival (OS).3,4 NPM1+ is the second most common identified mutation in AML, and the incidence of NPM1+ is not age dependent.3,5 NPM1 mutations are enriched in cytogenetically normal AML, where they are identified in ∼40% to 60% of cases, occurring at a similar if not increased frequency in older adults.2-4,6-8 In a large cohort of 1540 AML patients, NPM1+ was a favorable prognostic marker, associated with a hazard ratio (HR) of death of 0.7 (95% confidence interval [CI], 0.6-0.9) and a median OS of nearly 6 years compared with ∼2 years in those with wild-type (WT) NPM1.3 Felini et al2 found NPM1+ patients (n = 79; median age at diagnosis, 51.8 years) achieved a CR rate of 77% and harbored less chemotherapy-refractory disease (NPM1+, 9% vs WT NPM1, 23%) after induction therapy. The favorable prognostic impact of NPM1+ seems to be most pronounced in younger patients. A 2012 analysis by Mroźek et al7 demonstrated younger patients with NPM1+ (median age, 44 years) vs older (median age, 69 years) had profound differences in OS between cohorts (median OS: younger, 10.5 years vs older, 1.7 years). Despite such age-associated prognostic differences, current National Comprehensive Cancer Network and European LeukemiaNet (ELN) guidelines stratify patients with NPM1+ and WT FLT3 into a favorable risk group (signifying a <40% risk of relapse) when treated with intensive induction therapy.9,10
Recent work investigating the prognostic impact of NPM1+ stratified by patients receiving IC age 55 to 65 years or age >65 years found improved OS in NPM1+ patients age 55 to 65 years without cooccurring mutations in FLT3 internal tandem duplication (ITD; FLT3+).11 The favorable impact of NPM1+ seemed to diminish in patients age >65 years, who had lower CR rates (53% vs 88%) and increased 1-year relapse rates (47% vs 12%) compared with patients age 55 to 65 years, despite similar molecular profiles and cytogenetic risk.11 In addition to the known prognostic impact of cooccurring mutations, increased NPM1+ variant allele frequency (VAF) may further negate the positive prognostic impact of NPM1+; however, current data supporting this are conflicting.12-14
Although hypomethylating agent (HMA) therapy represents a viable alternative to IC in the unfit older adult, outcomes with HMA monotherapy remain poor, with a median OS of 5.5 months and a 1-year OS of 28%.15 In NPM1+ patients considered unfit for intensive induction treated with a frontline HMA, responses remain poor (overall response rate, 45.5%; CR, 23.5%; median OS, ∼10 months), similar to those seen in a matched WT NPM1 cohort and consistent with prior studies of patients with intermediate- and poor-risk cytogenetics.16,17 Efforts to increase responses with IC included in vitro studies using all-trans retinoic acid (ATRA) in conjunction with IC, demonstrating potentiation of the effect of IC.18 ATRA + IC demonstrated improved responses in NPM1+ AML without cooccurring FLT3-ITD in a prior retrospective analysis,19 an effect that has since yielded mixed results in clinical practice.20
The recent approval of venetoclax (VEN; 400 mg daily), an oral BCL-2 inhibitor, in combination with HMAs in older, chemotherapy-unfit AML patients has demonstrated remarkable effectiveness (composite CR [CRc; CR + CR with incomplete count recovery (CRi)], 73%; OS, 16.9 months),21 quickly emerging as a new standard of care for the older AML patient. NPM1+ patients seem to particularly benefit from this induction approach, with a CR + CRi rate of 91.5%21 and median OS not reached (NR) at follow-up (median OS, 11 months to NR), an improvement when compared with historical outcomes seen with IC for NPM1+ older patients.
Determining the optimal treatment regimen for an older patient with NPM1+ AML remains a challenging clinical decision. To improve our understanding of outcomes in older patients with NPM1+ AML in the current treatment era, we retrospectively evaluated outcomes of this unique AML cohort when treated with frontline intensive induction therapy, HMA, or HMA + VEN regimens.
Materials and methods
Study design and patient selection
Patients with a diagnosis of AML with NPM1+ who received frontline AML therapy at MD Anderson Cancer Center from 2007 to 2019 were eligible for this institutional review board–approved retrospective cohort review. Participants were stratified into cohorts based on the per-protocol induction therapy received: HMA + VEN, HMA, or IC (defined as receipt of cytarabine + anthracycline). Patients treated with IC in combination with targeted therapeutics (ie, FLT3, IDH1, IDH2 inhibitors) were included, and additional chemotherapeutic agents such as fludarabine or cladribine were allowed (supplemental Appendix A provides a list of treatment regimens received). HMA patients included those treated with HMA monotherapy (azacitidine or decitabine) or with the combination of an FLT3 inhibitor (FLT3i).
Data collection and analysis
Patient data were reviewed for age at diagnosis, Eastern Cooperative Oncology Group performance status, ELN risk classification, treatment start date, induction therapy received, history of an antecedent hematological disorder and any previous treatments received for an antecedent hematological disorder, date of relapse, and date of death or last follow-up date. Cytogenetic and molecular data were analyzed at diagnosis, using standard metaphase cytogenetics and targeted molecular testing. All patients had assessment of at least NPM1 and FLT3-ITD. NPM1 mutation analysis was performed by polymerase chain reaction followed by capillary electrophoresis in 127 patients and by targeted hotspot next-generation sequencing (Illumina, San Diego, CA) in 176 patients. Measurable residual disease (MRD) status in patients obtaining CR/CRi was assessed by 8-color multiparameter flow cytometry using leukemia-associated phenotypes and/or variation from normal. Response to therapy was assessed using ELN criteria.9 OS was calculated as time from start of induction therapy to the date of death or last follow-up. Patients alive at last follow-up were censored in survival analysis.
Patient characteristics were summarized with descriptive statistics and compared among different treatment groups. Continuous variables were compared between treatment groups by a 2-sample Student t test or analysis of variance if the data were normally distributed; otherwise, a Wilcoxon rank sum test or Kruskal-Wallis test was used. The association of treatment groups and other clinical factors were assessed using Fisher’s exact test or the χ2 test. OS was estimated using the Kaplan-Meier method and compared among groups using the log-rank test. Multivariable logistic regression models and Cox proportional hazards models were used to evaluate effects of treatment after adjusting for other risk factors. To account for multiple comparisons, adjusted P values were determined for CRc, MRD, and OS for the 3 cohorts using the Benjamini and Hochberg method. Statistical analyses were conducted in IBM SPSS and SAS software (version 9.4).
Results
A total of 446 patients with newly diagnosed NPM1+ AML treated on frontline AML protocols at MD Anderson Cancer Center from 2007 to 2019 were identified; 143 patients were excluded because they received induction regimens that could not be classified into HMA, HMA + VEN, or IC, leaving 303 patients for analysis (supplemental Data). Baseline demographics are shown in Table 1. The HMA + VEN group included 28 patients (median age, 71 years); the HMA group, 47 patients (median age, 72 years); and the IC group, 228 patients (median age, 55 years). As expected, the IC group had a substantially higher representation of younger patients than either the HMA + VEN or HMA cohort (patients age <55 years: HMA + VEN, n = 0; HMA, n = 0; IC, n = 114; patients age 55-65 years: HMA + VEN, n = 2; HMA, n = 8; IC, n = 89). All groups had a median Eastern Cooperative Oncology Group performance status of 1. A majority of patients had de novo AML (HMA + VEN, n = 25 [89%]; HMA, n = 35 [74%]; IC, n = 213 [93%]), ELN favorable-risk disease (HMA + VEN, n = 24 [86%]; HMA, n = 33 [70%]; IC, n = 183 [80%]), and diploid cytogenetics (HMA + VEN, n = 23 [82%]; HMA, n = 28 [60%]; IC, n = 173 [76%]).
Patient demographics
| Treatment Group (N = 288) | HMA + VEN (n = 28) | HMA (n = 47) | Intensive induction (n = 228) | P |
|---|---|---|---|---|
| Median age, y | 71 | 72 | 55 | .0001 |
| <55 | — | — | 114 | |
| 55-65 | 2 | 8 | 89 | |
| >65 | 26 (median, 72) | 39 (median, 75) | 25 (median, 68) | .004* |
| Performance status | ||||
| 0-1 | 15 (63) | 23 (64) | 180 (87) | .0002 |
| 2-3 | 9 (37) | 13 (36) | 27 (13) | |
| AML subtype | ||||
| De novo | 25 (89) | 35 (74) | 213 (93) | .001 |
| Secondary AML | 1 (4) | 6 (13) | 4 (2) | — |
| Treated secondary AML | 2 (7) | 6 (13) | 11 (5) | — |
| Risk group (ELN) | ||||
| Favorable | 24 (86) | 33 (70) | 183 (80) | .310 |
| Intermediate | — | 5 (11) | 12 (5) | — |
| Adverse | 4 (14) | 9 (19) | 33 (15) | — |
| Cytogenetics | ||||
| Diploid | 23 (82) | 28 (60) | 173 (76) | .331 |
| Complex | 1 (4) | 2 (4) | 8 (4) | — |
| +8 | 2 (8) | 1(2) | 7 (3) | |
| −5q | — | — | — | |
| −7q | — | — | 1 (<1) | |
| −5/−7 | — | — | — | |
| 11q abnormality | 1 (<1) | |||
| Other intermediate | 2 (7) | 11 (23) | 23 (1) | |
| Insufficient/not performed | — | 5 (11) | 11 (5) | |
| CBF (inv(16), t(8;21)) | — | — | 4 (2) |
Data are n or n (%) unless otherwise noted.
HMA + VEN vs IC.
Mutational analysis
Patients harbored a median of 4 mutations, as shown in Table 2 (range: HMA + VEN, 1-9; HMA, 1-7; IC, 1-11). FLT3-ITD and DNMT3A mutations were commonly comutated (HMA + VEN: FLT3-ITD, 4 [18%] of 28; DNMT3A, 14 [50%] of 28; HMA: FLT3-ITD, 28 [60%] of 47; DNMT3A, 18 [38%] of 47; IC: FLT3-ITD, 100 [44%] of 228; DNMT3A, 62 [27%] of 228), consistent with prior cohort analyses.3 FLT3-ITD mutations were underrepresented in the HMA + VEN cohort compared with the IC and HMA cohorts. A majority of patients with FLT3-ITD mutations had a low allelic ratio (AR; FLT3-ITD+/WT FLT3-ITD <0.5: HMA + VEN, 4 [100%] of 4; HMA, 20 [71%] of 28; IC, 82 [83%] of 99). TET2 was also frequently comutated (HMA + VEN, 16 [57%] of 28; HMA, 20 [42%] of 47; IC, 41 [18%] of 228). IDH1 mutations were identified in 25%, 22%, and 12% of HMA + VEN, HMA, and IC patients, respectively; IDH2 mutations were identified in 25%, 15%, and 19%, respectively. Patients in each cohort demonstrated a heterogeneous mutational landscape, as shown in Figure 1A-C.
Mutational profile
| Key molecular mutations | HMA + VEN | HMA | Intensive induction |
|---|---|---|---|
| Median mutations per patient (range) | 4 (1-9) | 4 (1-7) | 3 (1-11) |
| FLT3-ITD | 4 (18) | 28 (60) | 100 (44) |
| AR >0.5, n (by age, y) | |||
| <55 | — | — | 9 |
| 55-65 | — | 1 | 5 |
| >65 | — | 7 | 3 |
| AR <0.5, n (by age, y) | |||
| <55 | — | — | 45 |
| 55-65 | 1 | 2 | 27 |
| >65 | 3 | 18 | 10 |
| Total evaluable FLT3-ITD | 4/4 (100) | 28/28 (100) | 99/100 (99) |
| FLT3-D835 | 3 (7) | 5 (11) | 42 (18) |
| DNMT3A | 14 (50) | 18 (38) | 62 (27) |
| FLT3/DNMT3A | 1 (4) | 13 (28) | 30 (13) |
| IDH1 | 7 (25) | 9 (20) | 28 (12) |
| IDH2 | 7 (25) | 7 (15) | 44 (19) |
Data are n (%) or n/N (%) unless otherwise noted.
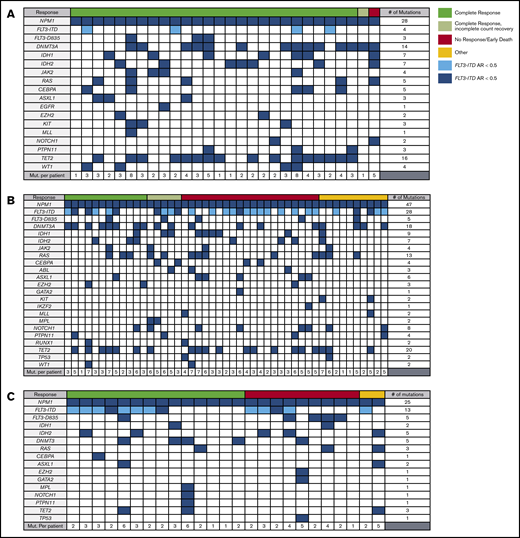
Mutational profiles of HMA + VEN, HMA, and IC (age >65 years) cohorts. HMA + VEN (A), HMA (B), and IC (C) cohorts harbored diverse mutational profiles with a median of 4 mutations per patient, including NPM1+. Commonly cooccurring mutations in the context of NPM1 mutations included FLT3-ITD, DNTM3A, IDH1, and IDH2. TET2 mutations were common in the HMA + VEN and HMA cohorts, likely reflective of the older age and the known association with DTA mutations.
Mutational profiles of HMA + VEN, HMA, and IC (age >65 years) cohorts. HMA + VEN (A), HMA (B), and IC (C) cohorts harbored diverse mutational profiles with a median of 4 mutations per patient, including NPM1+. Commonly cooccurring mutations in the context of NPM1 mutations included FLT3-ITD, DNTM3A, IDH1, and IDH2. TET2 mutations were common in the HMA + VEN and HMA cohorts, likely reflective of the older age and the known association with DTA mutations.
Mutation effects on outcomes
Outcomes are shown in Tables 3 and 4. In the HMA + VEN, HMA, and IC groups, the CR rate was 89%, 26%, and 85%, respectively. There was no significant difference in CR rates between the HMA + VEN and IC groups (89% vs 85%; P = .778), whereas both were significantly improved compared with patients treated with HMA therapy (89% and 85% vs 26%; P < .001). CRc was seen in 96%, 36%, and 89% of HMA + VEN, HMA, and IC patients, respectively (HMA + VEN vs IC, P = .33; HMA + VEN vs HMA, P < .001). There was no significant difference in 30-day mortality between groups (HMA + VEN, 4%; HMA, 9%; IC, 4%; P = .37). Patients age 55 to 65 years in the HMA + VEN (n = 2), HMA (n = 8), and IC groups (n = 89) had CR rates of 100%, 13%, and 88%, respectively.
Treatment outcomes
| Treatment group | HMA + VEN, n (%) (n = 28) | HMA, n (%) (n = 47) | Intensive induction, n (%) (n = 228) | P |
|---|---|---|---|---|
| Response | ||||
| CRc (CR + CRi) | 27 (96) | 17 (36)* | 204 (89)† | <.001* |
| .330† | ||||
| CR | 25 (89) | 12 (26)* | 193 (85)† | <.001* |
| .778† | ||||
| CRi | 2 (7) | 5 (11) | 11 (5) | — |
| MRD− (multiparameter flow cytometry) | 18 (75) | 3 (27)* | 85 (79)† | .011* |
| .593† | ||||
| PR | — | — | 1 (<1) | — |
| No response | 12 (26) | 8 (4) | — | |
| 30-d mortality | 1 (4) | 4 (9) | 9 (4) | — |
| Not evaluable | — | 1 (2) | — | — |
| Treatment outcomes by age, y | ||||
| CR | ||||
| <55 | — | — | 101/114 (89) | — |
| 55-65 | 2/2 (100) | 1/8 (13)* | 78/89 (88)† | .067* |
| 1.00† | ||||
| >65 | 23/26 (88) | 11/39 (28)* | 14/25 (56)† | <.001* |
| .013† | ||||
| Total | 25/28 (89) | 12/47 (26)* | 193/228 (85)† | <.001* |
| . 778† |
HMA + VEN vs HMA.
HMA + VEN vs IC.
Cox multivariate analysis for OS
| OS | HR | 95% CI | P | FDR-adjusted P |
|---|---|---|---|---|
| Treatment group | ||||
| HMA vs IC | 1.68 | 0.95-2.98 | .076 | .076 |
| HMA + VEN vs IC | 0.31 | 0.12-0.83 | .019 | .038 |
| ELN risk group | ||||
| Intermediate vs favorable | 1.18 | 0.59-2.36 | .635 | — |
| Adverse vs favorable | 1.30 | 0.80-2.13 | .293 | — |
| Age at diagnosis, y | 1.04 | 1.02-1.06 | <.0001 | — |
| Secondary AML | 1.37 | 0.76-2.48 | .302 | — |
| ECOG performance status | ||||
| ≥2 vs <2 | 1.79 | 1.16-2.76 | .009 | — |
| FLT3-ITD | ||||
| Positive vs negative | 1.55 | 1.09- 2.21 | .016 |
FDR, false discovery rate.
Patients age >65 years receiving HMA + VEN (n = 26), HMA (n = 39), and IC (n = 25) had CR rates of 88%, 28%, and 56%, respectively (HMA + VEN vs HMA, P < .001; HMA + VEN vs IC, P = .013). Among patients achieving a CR who had data available for MRD analysis by flow cytometry (HMA + VEN, n = 24; HMA, n = 11; IC, n = 107), MRD negativity for the HMA + VEN, HMA, and IC groups was 75%, 27%, and 79%, respectively (HMA + VEN vs HMA, P = .011; HMA + VEN vs IC, P = .593).
VAF of NPM1 mutations at diagnosis has been associated with OS with conflicting results.12-14 A total of 170 patients had VAF available for analysis, with a median VAF of 42%. In this cohort, there was a nonsignificant trend toward increased survival seen in patients with VAF <42% (n = 80) vs those with VAF ≥42% (n = 90; median OS, 3.4 vs 2.7 years; P = .09).
The favorable prognostic impact of a NPM1+ mutation is context dependent and is particularly influenced by the presence of FLT3-ITD comutations. Therefore, this interaction was evaluated specifically, as shown in the multivariate analysis in Table 4. In NPM1+ and FLT3-ITD+ patients, who represented 132 participants (44%), CR was achieved in 100% (4/4), 21% (6/28), and 84% (84/100) of those treated with HMA + VEN, HMA, and IC, respectively (supplemental Data). FLT3-ITD+ patients had inferior outcomes (HR for death, 1.55; 95% CI, 1.09-2.21; P = .016) compared with patients with WT FLT3, correlating with inferior OS (1.4 vs 3.7 years; P = .003), consistent with the known prognostic effect of FLT3-ITD mutations.3 In the setting of NPM1+, no significant difference in median OS was identified based on the AR (high, >0.5; low, <0.5) of FLT3-ITD+ (low AR (n = 107), 1.4 years vs high AR (n = 25), 1.1 years; P = .12). Analysis of FLT3-ITD+ patients treated with a FLT3 inhibitor (n = 56 [sorafenib, n = 53; quizartinib, n = 1; midostaurin, n = 2]) demonstrated similar OS vs FLT3-ITD+ patients not receiving a FLT3i (n = 76; median OS: FLT3-ITD+/FLT3i, 1.4 years vs FLT3-ITD+, 1.2 years; P = .77). However, IC patients treated with a FLT3i had significant improvement in OS compared with those FLT3+ patients not receiving a FLT3i (n = 76; median OS: FLT3+/FLT3i, 4.7 years vs FLT3+/no FLT3i, 1.4 years; P = .018).
A trend toward decreased survival was also seen among patients with triple-mutated NPM1/FLT3-ITD/DNMT3A when compared with patients without FLT3-ITD or DNMT3A mutations regardless of treatment regimen (median OS: NPM1/DNMT3A/FLT3-ITD, 1.6 years vs 3.6 years; P = .07). In the setting of WT FLT3, DNMT3A mutations had no significant impact on OS in NPM1+ patients (P = .97).
Impact of age on survival
OS decreased incrementally in NPM1+ patients age <55, 55 to 65, and >65 years (median OS, 5.0, 4.4, and 0.9 years, respectively). A noteworthy difference in OS was identified in IC-treated patients age ≤65 years compared with those age >65 years (median OS, 4.4 years vs 11.2 months; P < .001). Because older AML patients are more likely to harbor complex cytogenetics and have adverse-risk disease, even in the context of NPM1+, this analysis was repeated only for ELN favorable-risk patients (n = 240) with similar findings (median OS: age ≤65 years, 5.1 years vs age >65 years, 1.0 year; P < .001).
Assessing the impact of treatment regimen on OS in all patients irrespective of age or fitness, there was a significant increase in OS with HMA + VEN vs HMA (median OS, NR vs 0.4 years; P < .001), whereas no significant difference was observed between HMA + VEN and IC (median OS, NR vs 3.7 years; P = .292). After adjusting for multiple factors by multivariable Cox model analysis (Table 4), HMA + VEN therapy was associated with a significant reduction in risk of death compared with IC (HR, 0.31; type I error–adjusted P = .038) after considering other important clinical factors in the model. Furthermore, median OS in the subgroup of patients age >65 years was significantly improved in those treated with HMA + VEN vs HMA (NR vs 0.4 years; P < .001) and in those treated with HMA + VEN vs IC (NR vs 0.93 years; P = .001; Figure 2). Among ELN favorable-risk NPM1+ patients age >65 years, HMA + VEN was associated with improved survival (median OS, NR) compared with HMA (0.5 years; P < .001) or IC (median OS, 0.99 years; P = .001), as shown in Figure 3.
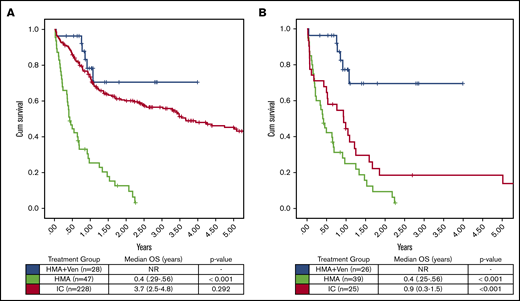
OS by treatment group in NPM1+patients treated with HMA + VEN, HMA, and IC. (A) OS was not significantly different between HMA + VEN vs IC when patients of all ages were included in the analysis (median OS, NR vs 3.7 years; P = .292). (B) However, in patients age >65 years, HMA + VEN demonstrated a significant improvement in OS compared with IC (median OS, NR vs 0.9 years; P < .001). HMA + VEN outperformed HMA monotherapy, which demonstrated a median OS of 0.4 years (4.8 months).
OS by treatment group in NPM1+patients treated with HMA + VEN, HMA, and IC. (A) OS was not significantly different between HMA + VEN vs IC when patients of all ages were included in the analysis (median OS, NR vs 3.7 years; P = .292). (B) However, in patients age >65 years, HMA + VEN demonstrated a significant improvement in OS compared with IC (median OS, NR vs 0.9 years; P < .001). HMA + VEN outperformed HMA monotherapy, which demonstrated a median OS of 0.4 years (4.8 months).

OS in ELN favorable-risk patients. (A) HMA + VEN demonstrated improved OS in patients age >65 years compared with both HMA and IC (median OS, NR vs 0.5 vs 1.0 years; P < .001 and .005, respectively). (B) HMA + VEN continued to be associated with a significant improvement in OS in ELN favorable-risk patients age >60 years.
OS in ELN favorable-risk patients. (A) HMA + VEN demonstrated improved OS in patients age >65 years compared with both HMA and IC (median OS, NR vs 0.5 vs 1.0 years; P < .001 and .005, respectively). (B) HMA + VEN continued to be associated with a significant improvement in OS in ELN favorable-risk patients age >60 years.
Because of the known interactions of FLT3-ITD and impact of FLT3i in FLT3-ITD+ patients, we analyzed survival in the subgroup of NPM1+ and FLT3-ITD− patients separately (Figure 4). In the analysis of older FLT3-ITD− patients, HMA + VEN maintained a significantly improved OS compared with HMA or IC (median OS, NR vs 6 vs 10.8 months; P < .01), which compares favorably with the OS observed in prior studies of NPM1+/FLT3-ITD− AML.11
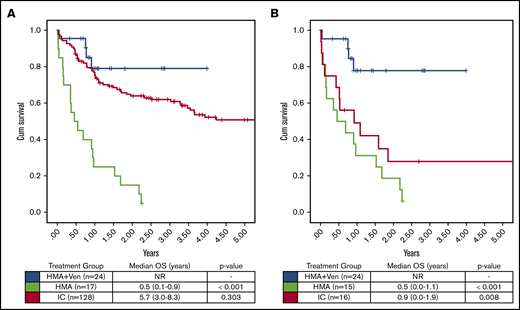
OS FLT3-ITD−/FLT3i− was assessed, given the known frequent cooccurrence of FLT3-ITD mutations in NPM1+AML and the emerging data demonstrating improved OS in patients receiving an FLT3i. (A) No difference in OS was seen in patients of all ages treated with HMA + VEN vs IC (median OS, NR vs 5.7 years; P = .303). (B) In patients age >65 years, HMA + VEN continued to demonstrate improved OS compared with IC (median OS, NR vs 0.9 years; P = .008). In both age groups, HMA + VEN and IC significantly outperformed HMA monotherapy (median OS, 0.5 years).
OS FLT3-ITD−/FLT3i− was assessed, given the known frequent cooccurrence of FLT3-ITD mutations in NPM1+AML and the emerging data demonstrating improved OS in patients receiving an FLT3i. (A) No difference in OS was seen in patients of all ages treated with HMA + VEN vs IC (median OS, NR vs 5.7 years; P = .303). (B) In patients age >65 years, HMA + VEN continued to demonstrate improved OS compared with IC (median OS, NR vs 0.9 years; P = .008). In both age groups, HMA + VEN and IC significantly outperformed HMA monotherapy (median OS, 0.5 years).
The favorable outcome of patients with IDH1 and IDH2 mutations in the setting of VEN-based regimens has additionally been reported,21,22 although their prognostic importance in the setting of IC has been more challenging to delineate and remains a matter of some debate.23 In the entire cohort of NPM1+ patients, those with cooccurring IDH1 mutations (n = 44) had an OS of 1.2 years (vs 2.5 years for WT IDH1) and those with IDH2-R140 mutations (n = 58) had an OS of 3.4 years (vs 2.2 years for WT IDH2), which is of interest, although neither group reached statistical significance (P = .26 and P = .39, respectively). No IDH2 R172 mutations were identified in this cohort of NPM1+ AML.
Subgroup analysis of patients treated with IC with IDH mutations (IDH1, n = 24; IDH2, n = 40; IDH1/2, n = 4) demonstrated no significant difference in OS (median OS: IDH1, 6.7 years; IDH2, 3.7 years; WT, 3.5 years; P = nonsignificant [NS]), whereas those with dual IDH1/IDH2 mutations had inferior OS (median OS, 0.6 years; P ≤ .01 across all 3 comparator groups). IDH1/2 mutations also had no significant impact on OS in patients treated with HMA therapy (median OS: IDH1, 0.4 years; IDH2, 0.2 years; IDH1/2, 0.9 years; WT, 0.5 years; P = NS). Median OS was not reached in patients with IDH1 or IDH2 mutations treated with HMA + VEN. Estimated 1-year OS was 75%, 100%, and 55% for patients with IDH1, IDH2, and WT IDH, respectively. CR rates were particularly high in NPM1+ patients with IDH1 mutations (6 [86%] of 7) and with IDH2 mutations (6 [100%] of 6) treated with HMA + VEN.
Discussion
With the recent approval of multiple new therapeutic options for patients with AML, the choice of treatment regimen to optimize patient outcomes can be challenging. This is especially true in older patients with AML, in whom outcomes regardless of fitness have remained historically poor. AML with NPM1+ is common, representing approximately one-third of all AMLs, and is associated with more favorable-risk disease and chemotherapy responsiveness; however, this favorable outcome is substantially muted in older NPM1+ patients. Whether novel lower-intensity regimens may offer similar or even improved outcomes with improved patient tolerance and quality of life is an essential question in the current treatment era. Therefore, given recent reports delineating exquisite sensitivity of NPM1+ AML to VEN-based treatment regimens,21,24 we sought to determine the outcomes of NPM1+ AML patients, with a focus on older patients receiving various treatment strategies, particularly the outcomes of patients receiving HMA + VEN, as compared with historical standard-of-care therapies (IC or HMA monotherapy).
In this study, in multivariate analysis, HMA + VEN was associated with a 69% lower risk of death compared with IC (HR, 0.31; 95% CI, 0.12-0.83; P = .038). Older patients age >65 years with NPM1+ AML treated with either decitabine or azacitidine combined with VEN achieved a high CR rate compared with patients receiving intensive induction regimens (88% vs 56%; P = .01) and had significantly improved OS (NR vs 0.4 vs 0.9 years) compared with HMA monotherapy or intensive induction therapy. After a median follow-up of 1 year, 80% (n = 21) of patients age >65 years treated with HMA + VEN were alive, compared with 36% (n = 9) of patients treated with IC and 12% (n = 1) of patients treated with HMA. These results compare favorably with prior retrospective analyses of older patients treated with IC and provide further evidence of the improved outcomes using HMA combinations over HMA monotherapy in the treatment of AML.7,11,16
Given the known negative prognostic effect of co-occurring FLT3-ITD mutations on outcomes of NPM1+ patients,3,25,26 as well as the potential therapeutic synergy between BCL-2 inhibition and FLT3 inhibition, FLT3-ITD mutations were included in a multivariate model comparing treatment regimens for OS. Additionally, sensitivity analyses were performed after excluding FLT3-ITD+ patients and those treated with an FLT3i, which may have altered the results. Regardless of FLT3-ITD status and use of an FLT3i, HMA + VEN combinations continued to demonstrate improved outcomes in older AML patients.
HMA + VEN is effective in adult patients with NPM1+ AML. In patients age >65 years with NPM1+ AML, frontline HMA + VEN therapy was associated with CR rates >85% and low (<5%) treatment-related mortality. Additionally, MRD negativity by flow cytometry was achieved in a substantial portion of patients treated with HMA + VEN, indicating this regimen can induce deep MRD− remissions.
Older HMA + VEN patients had an OS of 80% after a median 1 year of follow-up, with an estimated 2-year OS of 70%. Outcomes in this subgroup were significantly improved compared with contemporaneous patients receiving IC, suggesting HMA + VEN is a well-tolerated and effective treatment option in this patient population. Only a few patients age <60 years with NPM1+ mutations were treated with HMA + VEN therapy. Although HMA + VEN therapy in these patients seemed to have efficacy similar to that of intensive induction, further follow-up evaluating the long-term outcomes is warranted before HMA + VEN therapy is considered a standard therapeutic option for younger, fit patients with AML.
Limitations of the study included the retrospective nature of the analysis, in addition to the small sample size in the HMA + VEN and HMA cohorts. Furthermore, FLT3-ITD mutations were underrepresented in the HMA + VEN cohort. These results must therefore be interpreted in the context of these limitations. Randomized prospective studies are ongoing to assess the role of HMA + VEN as a standard-of-care therapy in older, fit adults.
In conclusion, we confirm the sensitivity of NPM1+ AML to HMA + VEN combinations and suggest this regimen could be considered as an optimal mutation-targeted treatment approach for older patients with AML and NPM1 mutations.
Send data sharing requests via e-mail to the corresponding author, Courtney D. DiNardo (cdinardo@mdanderson.org).
Authorship
Contribution: C.A.L. aided in data analysis and preparation of the manuscript; W.Q. and J.N. aided in data analysis; C.D.D. and M.K. aided in data collection and analysis and preparation of the manuscript; and S.L., T.M.K., N.D., G.B., N.P., K.N., Y.A., M.Y., N.S., M.O., S.R.P., K.P.P., E.J., M.A., F.R., H.M.K., K.S., and K.T. aided in data collection and review of the manuscript.
Conflict-of-interest disclosure: C.D.D. reports research funding from AbbVie, Agios, Celgene, and Daiichi Sankyo and consultancy and advisory roles for AbbVie, Agios, Celgene, Daiichi Sankyo, and Notable Labs. M.K. reports consulting and research funding from AbbVie, Genentech, F. Hoffman-La Roche. T.M.K. reports research funding and honoraria from AbbVie. N.D. reports research funding and consultancy from AbbVie and Genentech. N.P. reports consulting/honoraria from AbbVie, Celgene, Stemline, Incyte, Novartis, MustangBio, Roche Diagnostics, and LFB; research funding and clinical trial support from Stemline, Novartis, AbbVie, Samus, Cellectis, Plexxikon, Daiichi Sankyo, and Affymetrix; grants and funding from Affymetrix and SagerStron Foundation; and noncompensated board memberships for Dan’s House of Hope and HemOnc Times/Oncology Times. M.A. reports research funding from AbbVie. F.R. reports research funding and honoraria from AbbVie. H.M.K. reports research funding from AbbVie, Agios, Amgen, Ariad, Astex, Bristol-Myers Squibb, Cyclacel, Daiichi Sankyo, Immunogen, Jazz Pharma, Novartis, and Pfizer and honoraria support from AbbVie, Actinium (advisory board), Agios, Amgen, Pfizer, and Takeda. The remaining authors declare no competing financial interests.
Correspondence: Courtney D. DiNardo, Department of Leukemia, The University of Texas MD Anderson Cancer Center, 1515 Holcombe Blvd, Houston, TX 77030; e-mail: cdinardo@mdanderson.org.

