

Key Points
Baseline functional PET parameters can predict outcomes of DLBCL patients treated with R-CHOP.
Prognostic models based on MTV and MH may allow early identification of poor-risk patients.

Abstract
Several functional parameters from baseline (18)F-fluorodeoxyglucose positron emission tomography (PET)/computed tomography have been proposed as promising biomarkers of treatment efficacy in diffuse large B-cell lymphoma (DLBCL). We tested their ability to predict outcome in 2 cohorts of DLBCL patients receiving conventional immunochemotherapy (rituximab, cyclophosphamide, doxorubicin hydrochloride, vincristine sulfate, and prednisone [R-CHOP] regimen), either every 14 (R-CHOP14) or 21 days (R-CHOP21). Baseline PET analysis was performed in 141 patients with DLBCL treated with R-CHOP14 in the prospective SAKK38/07 study (NCT00544219) of the Swiss Group for Clinical Cancer Research (testing set). Reproducibility was examined in a validation set of 113 patients treated with R-CHOP21. In the SAKK38/07 cohort, progression-free survival (PFS) at 5 years was 83% for patients with low metabolic tumor volume (MTV) and 59% for those with high MTV (hazard ratio [HR], 3.4; 95% confidence interval [CI], 1.6-7.0; P = .0005), whereas overall survival (OS) was 91% and 64%, respectively (HR, 4.4; 95% CI, 1.9-10; P = .0001). MTV was the most powerful predictor of outcome also in the validation set. Elevated metabolic heterogeneity (MH) significantly predicted poorer outcomes in the subgroups of patients with elevated MTV. A model integrating MTV and MH identified high-risk patients with shorter PFS (testing set: HR, 5.6; 95% CI, 1.8-17; P < .0001; validation set: HR, 5.6; 95% CI, 1.7-18; P = .0002) and shorter OS (testing set: HR, 9.5; 95% CI, 1.7-52; P < .0001; validation set: HR, 7.6; 95% CI, 2.0-28; P = .0003). This finding was confirmed by an unsupervised regression tree analysis indicating that prognostic models based on MTV and MH may allow early identification of refractory patients who might benefit from treatment intensification. This trial was registered at www.clinicaltrials.gov as #NCT00544219.
Introduction
Diffuse large B-cell lymphoma (DLBCL) not otherwise specified is the most common histologic subtype of lymphoma, accounting for 30% to 40% of the non-Hodgkin lymphomas in Western countries.1 It is a heterogeneous disease with distinct molecular features and clinical behavior.2,3 According to their cell of origin (COO), genetically and phenotypically distinct subgroups of DLBCL (activated B-cell–like, germinal-center B-cell–like [GCB], and unclassified) can be discriminated with different response to treatment and clinical outcomes.4-7
The addition of rituximab (anti-CD20 monoclonal antibody) to the standard cyclophosphamide, doxorubicin, vincristine, and prednisone (CHOP) chemotherapy regimen, given with rituximab either every 2 (R-CHOP14) or 3 (R-CHOP21) weeks, has improved the outcome in patients with DLBCL.8,9 However, a relevant portion of patients (30% to 40%) still experience treatment failure.10 Several systems for predicting prognosis have been developed and the most widely used is the International Prognostic Index (IPI).11 In recent years, modifications of the IPI for DLBCL have shown an improved predictive value,12,13 but novel biomarkers are still needed to better identify patients who could benefit from more aggressive therapeutic approaches.
Nowadays, (18)F-fluorodeoxyglucose (18FDG) positron emission tomography/computed tomography (PET/CT) represents the standard for staging and therapeutic response assessment in DLBCL.14 In fact, the 18FDG-PET/CT scan at the end-of-treatment is the best predictor of DLBCL outcome and its visual evaluation is based on a 5-point scale (Deauville score), where a score of ≤3 represents the standard definition of complete remission.14,15
Repeated imaging studies after 1-to-3 R-CHOP cycles (interim positron emission tomography [PET]/computed tomography [CT]) have been proposed to guide treatment decisions, and some studies have suggested that a quantitative approach based on the decrease of the maximum standardized uptake value (ΔSUVmax) between baseline and interim PET/CT may be a more objective tool compared with the visual assessment.16-19 However, the role of interim PET/CT as a reliable early prognostic factor remains controversial in DLBCL.20-25
Several quantitative parameters derived from baseline PET/CT, including the SUVmax, the total lesion glycolysis (TLG), and the metabolic tumor volume (MTV), seem promising biomarkers in various lymphoma subtypes.26-30 In particular, some studies reported that an elevated MTV value is a good predictor of poor outcome in patients with DLBCL.31-35 Improved prognostic models might also be derived from the combination of baseline MTV or TLG and early response on interim PET/CT.34,36 In addition, metabolic heterogeneity (MH), a functional PET parameter with known prognostic value in solid tumors,37,38 may also have a role in lymphomas.39
Recent research provided preliminary but promising evidence that the integration of quantitative PET parameters with some clinical, biological, and molecular features may allow a more accurate prognostication in DLBCL.29,40,41
The main aim of this study was to test the ability of baseline functional PET parameters in predicting the efficacy of immunochemotherapy in a cohort of DLBCL patients treated with R-CHOP14 in the prospective clinical trial SAKK 38/07. A separate validation cohort of DLBCL patients treated with the standard RCHOP21 was also analyzed.
Patients and methods
All procedures performed in this study were in accordance with the ethical standards of the 1964 Declaration of Helsinki and its later amendments. The study was approved by the Institutional Review Board/Ethics Committee of the participating centers.
Testing set
Among the 156 patients with any stage of untreated DLBCL prospectively enrolled in the SAKK 38/07 trial of the Swiss Group for Clinical Cancer Research,24 141 with baseline 18FDG-PET/CT scans suitable for imaging postprocessing and a complete clinical follow-up were eligible for this study.
In all cases, the diagnosis of DLBCL was confirmed by central pathology review and the presence of “double-hit” cases with BCL2 and C-MYC rearrangements was ruled out by in situ hybridization analyses.
All patients received 6 cycles of R-CHOP (rituximab 375 mg/m2, cyclophosphamide 750 mg/m2, doxorubicin 50 mg/m2, vincristine 1.4 mg/m2 on day 1, and prednisone 100 mg/m2 for 5 days) every 14 days followed by 2 cycles of rituximab. If indicated by local guidelines, consolidation radiotherapy was allowed and was administered in 21 patients (15%).
PET/CT scans were to be performed in all patients at diagnosis, after 2 cycles of R-CHOP14, and at the end of immunochemotherapy. Treatment details and PET scan protocol have been previously published.24
Validation set
The validation cohort comprised 113 patients with any stage of untreated DLBCL included in a retrospective survey of the PET use in our institutions. Seventy-three patients were obtained from the database of the Oncology Institute of Southern Switzerland, Bellinzona, Switzerland, and 40 from that of the Hematology Unit of the Ospedale Papa Giovanni XXIII, Bergamo, Italy. Age >18 years, 18FDG-PET/CT baseline scan, front-line treatment with 6 cycles of R-CHOP21, and a clinical follow-up of at least 18 months were the criteria of selection. Fifteen patients (13%) received consolidation radiotherapy.
The PET/CT scan was performed baseline, within 2 weeks before the beginning of the treatment, and after the completion of immunochemotherapy.
Baseline whole-body PET/CT was performed with a Biograph 6 HiRez scanner (Siemens, Erlangen, Germany). Acquisition started 60 ± 5 minutes following the injection of 18FDG (3.5-4 MBq/kg) to the subjects fasting at least 6 hours. PET images (CT corrected for attenuation) were reconstructed with a standard iterative algorithm (3D-OSEM).
Prognostic factors
The IPI,11 the revised‐IPI,13 and the National Comprehensive Cancer Center Network enhanced-IPI (NCCN‐IPI)12 were calculated for each patient using the clinical information retrieved from either the SAKK38/07 study database or the hospital records, as appropriate. The COO was centrally determined by immunohistochemistry using the Hans algorithm.42
PET/CT images analysis
For the present study, all the PET/CT scans were centrally evaluated following a standard protocol with dedicated imaging software (MM Oncology, Syngo.via, Siemens). The lymphoma lesions were segmented using an algorithm with a fixed threshold at 2.5 SUV value43 for MTV estimation, then SUVmax and TLG were calculated automatically. MH of the target lesion (ie, the lesion with the highest 18FDG uptake) was measured in each patient using the area under curve of cumulative SUV-volume histogram (AUC-CSH) method as previously published.39
Statistics
Quantitative variables were expressed by medians and interquartile ranges (IQR). Medians were compared using the Mann-Whitney U test. Differences between the frequencies of categorical data were assessed with the χ2 test. The PET-associated functional continuous parameters were analyzed as dichotomized variables, using receiver-operating characteristic (ROC) analysis to identify the optimal cutoff point to discriminate subgroups with different progression-free survival (PFS) and overall survival (OS). Survival functions were defined according to the revised National Cancer Institute criteria44 and estimated by the Kaplan-Meier method, and patient groups were compared by the log-rank test. Cox proportional hazard models were used for multivariable analysis and the estimation of hazard ratios (HRs). The predictive accuracy of the different prognostic indices in the identification of patients at risk of shorter survival was compared using the Harrell C concordance probability estimate (CPE),45 which calculates the probability of agreement for any pair of patients in which agreement means that the patient with the shorter survival time also has the higher predicted risk. Because C statistics range from 0.5 (random concordance) to 1 (perfect concordance), higher values of C indicate better discrimination. Their relative quality was further assessed using an in-sample fit approach to model selection (Akaike information criterion [AIC]),46 which estimates the likelihood of a prognostic model to predict future outcomes. The best model is the one that, in comparison with all the others, has the minimum AIC (ie, best fit). P < .05 was considered statistically significant. Negative predictive value (NPV) and positive predictive value (PPV) were calculated according to standard definitions. Both testing and validation datasets were explored using a recursive-partitioning classification tree method (implemented into the ctree function of the R package party) to develop unbiased prognostic models based on dichotomized variables.47 This procedure enables the hierarchical classification of the prognostic covariates, from the most important, which splits the primary node (entire population), to those which extend to the terminal nodes (risk groups).
Statistical analyses were conducted by using the STATA statistical software package, version 11 (StataCorp, College Station, TX) and the R statistical software environment, version 3.1.1, as appropriate.
Results
Testing set (SAKK38/07)
Detailed clinical features and outcome of the patients enrolled in the SAKK 38/07 study have been published previously.24 Table 1 summarizes the demographic and clinical characteristics of the 141 patients included in the present analysis and reports the estimation of their functional PET parameters at baseline. At a median follow-up of 64 months (IQR, 60-67 months), 30 progressions of disease and 23 deaths were recorded. The estimated 5-year PFS and OS rates were 76% (95% confidence interval [CI], 67-82) and 84% (95% CI, 77-90), respectively.
Comparison of baseline patient characteristics and functional PET parameters in the testing (N = 141) and validation (N = 113) cohorts
| Clinical features | Testing set (SAKK 38/07), n (%) | Validation set, n (%) | P* |
|---|---|---|---|
| Sex | .833 | ||
| Male | 73 (52) | 57 (51) | |
| Female | 68 (48) | 56 (49) | |
| Age | |||
| Median; IQR | 59 y; 49-68 | 70 y; 57-76 | <.0001 |
| >60 y | 68 (48) | 80 (71) | <.0001 |
| Ann Arbor stage | .275 | ||
| 1 | 15 (11) | 15 (13) | |
| 2 | 46 (33) | 34 (30) | |
| 3 | 33 (23) | 17 (15) | |
| 4 | 47 (33) | 47 (42) | |
| Bulky disease | |||
| >7.5 cm | 70 (50) | 50 (44) | .392 |
| >10 cm | 42(30) | 29 (26) | .375 |
| Elevated LDH | 68 (48) | 56 (50) | .726 |
| ECOG PS >1 | 10 (7) | 9 (8) | .793 |
| Extranodal sites >1 | 34 (24) | 25 (22) | .709 |
| COO (Hans algorithm) | N = 113 | N = 99 | <.001 |
| GCB | 29 (26) | 58 (59) | |
| Non-GCB | 84 (74) | 41 (41) | |
| IPI group | .085 | ||
| Low risk | 65 (46) | 36 (32) | |
| Intermediate-low risk | 32 (23) | 39 (34) | |
| Intermediate-high risk | 27 (19) | 25 (22) | |
| High risk | 17 (12) | 13 (12) | |
| R-IPI group | .111 | ||
| Low risk | 22 (16) | 8 (7) | |
| Intermediate risk | 75 (53) | 67 (59) | |
| High risk | 44 (31) | 38 (34) | |
| NCCN-IPI group | .007 | ||
| Low risk | 22 (16) | 7 (6) | |
| Intermediate-low risk | 67 (47) | 42 (37) | |
| Intermediate-high risk | 39 (28) | 51 (45) | |
| High risk | 13 (9) | 13 (12) | |
| PET parameters, median (IQR) | |||
| SUVmax | 19.9 (15.1-28.2) | 21 (13.5−28.1) | .95 |
| MTV | 386 (143-1119) | 342 (78- 822) | .12 |
| TLG | 2618 (824-8906) | 2325 (472-5390) | .08 |
| Metabolic heterogeneity (AUC-CSH) | 0.45 (0.40-0.50) | 0.49 (0.46-0.53) | <.001 |
Bold P values indicate statistically significant results (P < .05).
ECOG, Eastern Cooperative Oncology Group; PS, performance status.
χ2 test for comparison of frequencies and Mann-Whitney U test for comparison of medians.
Univariable analysis
Among the clinical features evaluable at presentation, no impact on outcome appeared related to sex, age (>60 years), serum lactate dehydrogenase (LDH), stage, extranodal disease, and bulky disease (>7.5 cm). An impaired performance status (Eastern Cooperative Oncology Group score >1) was associated with a shorter OS (P = .0342), but did not show a significant effect on PFS. The IPI, R-IPI, and NCCN-IPI were also associated with OS (trend test P = .0442, .0279, and .0045, respectively) but had only a borderline impact on PFS (trend test P, .0590, .0498, and .0516, respectively). Table 2 reports the optimal cutoff points of the dichotomized PET parameters estimated by ROC analysis for PFS and OS. In the whole cohort, elevated MTV and TLG were significantly associated with worse PFS and OS, whereas SUVmax and MH had no effect on outcomes (Table 3). However, when the analysis was limited to the 126 patients with stages 2-4, MH became significantly associated with PFS (P = .03) and had a borderline effect also on OS (P = .07). Moreover, elevated MH was associated with shorter PFS (P = .02) and OS (P = .009) in the subset of patients with elevated MTV. Among the dichotomized IPI factors, at univariable analysis, a significant association was found between baseline MTV and serum LDH, extranodal disease and stage, not with age or performance status.
Results of the ROC analysis used to identify optimal cutoff points for PFS and OS in the testing (N = 141) and validation (N = 113) cohorts
| Functional PET parameters | ROC analysis for PFS | ROC analysis for OS | |||||||||
|---|---|---|---|---|---|---|---|---|---|---|---|
| Cutoff point | Sensitivity, % | Specificity, % | AUC | P | Cutoff point | Sensitivity, % | Specificity, % | AUC | P | ||
| Testing set | SUVmax | 20 | 60 | 55 | 0.556 | .342 | 24.2 | 74 | 40 | 0.550 | .433 |
| MTV, mL | 931 | 57 | 75 | 0.629 | .029 | 1149 | 52 | 81 | 0.670 | .011 | |
| TLG | 3960 | 63 | 62 | 0.620 | .034 | 6991 | 57 | 73 | 0.661 | .012 | |
| MH (AUC-CSH) | 0.43 | 53 | 66 | 0.545 | .474 | 0.43 | 52 | 69 | 0.555 | .431 | |
| Validation set | SUVmax | 31 | 27 | 86 | 0.507 | .917 | 31 | 32 | 86 | 0.582 | .267 |
| MTV, mL | 336 | 73 | 54 | 0.629 | .029 | 336 | 79 | 54 | 0.637 | .070 | |
| TLG | 3186 | 55 | 66 | 0.574 | .318 | 3574 | 63 | 70 | 0.634 | .079 | |
| MH (AUC-CSH) | 0.47 | 53 | 66 | 0.527 | .730 | 0.46 | 42 | 85 | 0.648 | .046 | |
Bold P values indicate statistically significant results (P < .05).
Univariable analysis of PFS and OS by dichotomized (below vs above the ROC cutoff point) functional PET parameters in the validation and testing sets
| Univariable analysis of PFS | Univariable analysis of OS | ||||||||||
|---|---|---|---|---|---|---|---|---|---|---|---|
| 5-y PFS (95% CI), % | Log-rank P | HR (95%CI) | NPV | PPV | 5-y OS (95% CI), % | Log-rank P | HR (95%CI) | NPV | PPV | ||
| Testing set | SUVmax | .164 | 0.6 (0.3-1.2) | 84 | 27 | .196 | 0.5 (0.2-1.4) | 89 | 19 | ||
| Low | 72 (58-81) | 81 (71-88) | |||||||||
| high | 80 (67-88) | 90 (78-96) | |||||||||
| MTV (mL) | .0005 | 3.4 (1.6-7.0) | 86 | 40 | .0001 | 4.4 (1.9-10) | 90 | 35 | |||
| Low | 83 (72-90) | 91 (83-95) | |||||||||
| High | 61 (44-74) | 65 (46-78) | |||||||||
| TLG | .0078 | 2.6 (1.3-5.6) | 86 | 31 | .0021 | 3.4 (1.5-7.8) | 90 | 29 | |||
| Low | 83 (72-90) | 90 (81-95) | |||||||||
| High | 65 (50-77) | 73 (57-84) | |||||||||
| MH | .0780 | 1.9 (0.9-3.9) | 84 | 29 | .1011 | 2.0 (0.9-4.4) | 87 | 22 | |||
| Low | 80 (69-88) | 88 (79-93) | |||||||||
| High | 69 (54-80) | 79 (65-88) | |||||||||
| Validation set | SUVmax | .0935 | 2.2 (0.9-5.6) | 83 | 32 | .0432 | 2.6 (0.99-6.9) | 86 | 32 | ||
| Low | 77 (63-86) | 79 (63-89) | |||||||||
| High | 67 (41-84) | 63 (34-82) | |||||||||
| MTV (mL) | .021 | 2.9 (1.1-7.3) | 89 | 28 | .0090 | 3.9 (1.3-11.8) | 93 | 26 | |||
| Low | 85 (67-93) | 92 (80-97) | |||||||||
| High | 66 (48-79) | 62 (41-77) | |||||||||
| TLG | .0632 | 2.2 (0.9-5.0) | 86 | 27 | .0107 | 3.1 (1.2-7.8) | 89 | 27 | |||
| Low | 82 (67-90) | 83 (65-92) | |||||||||
| High | 64 (41-80) | 63 (39-79) | |||||||||
| MH | .1547 | 1.8 (0.8-4.2) | 84 | 28 | .0433 | 2.5 (0.99-6.0) | 88 | 28 | |||
| Low | 80 (64-89) | 85 (74-92) | |||||||||
| High | 67 (47-81) | 56 (26-78) | |||||||||
Bold P values indicate statistically significant results (P < .05).
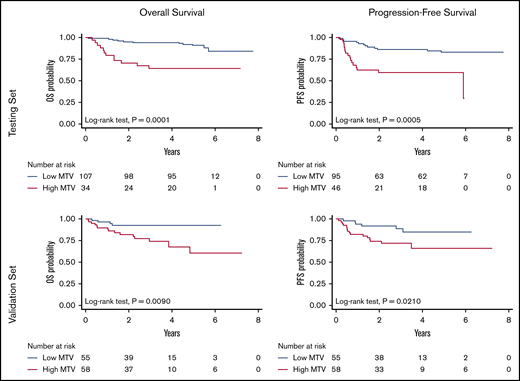
PFS at 5 years was 83% (95% CI, 72-90) for patients with low MTV vs 61% (95% CI, 44-74) for those with high MTV (log-rank test, P = .0005), whereas OS was 91% (95% CI, 83-95) vs 65% (95% CI, 46-78) (log-rank test, P = .0001), respectively (Figure 1, top). Outcome at 5 years was anticipated by dichotomized MTV with very high NPV (86% and 90% for PFS and OS, respectively) but lower PPV (40% for PFS and 35% for OS, respectively).
Integrated MTV-MH model
Because of the MH effect on the outcome of patients with high MTV, we explored the prognostic impact of a model integrating MTV and MH (Figure 2, top). The combination of these 2 parameters improved the performance of MTV alone to predict treatment outcome (log-rank test for trend, P < .001 for both PFS and OS). Among the patients with high MTV, those with high MH showed a significantly higher risk of progression (HR, 5.6; 95% CI, 1.8-17) and death (HR, 9.5; 95% CI, 1.7-52). The PPV of this prognostic model for the definition of the poorer risk patients was 57% for PFS and 62% for OS, respectively. Notably, an unsupervised approach with a classification tree method based on binary recursive partitioning (which included all the functional PET parameters and the dichotomized variables that contribute to the international prognostic indices) also found MTV and HM to be the most important factors, leading to a superimposable predictive model for both OS and PFS (Figure 3, top).
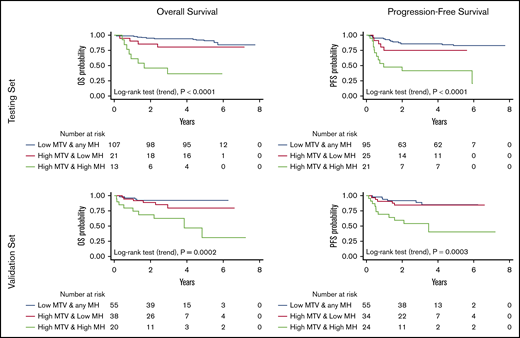
OS and PFS according to the model built integrating the MTV and MH either in the testing or in the validation cohort.
OS and PFS according to the model built integrating the MTV and MH either in the testing or in the validation cohort.

The classification trees showing the prognostic signature consisting of 2 variables, MTV and MH, whose dichotomization was significantly correlated with survival. MTV alone, when its value is low, identifies the prognostic category node 2 with best survival probability. To separate the prognostic categories node 4, with intermediate survival rates, from node 5, with poorer survival, the value of MTV must be high (node 3), and that of MH must be low or high, respectively. The Kaplan-Meier curves show statistically different overall and progression-free survival, either in both the testing and the validation patient sets. For each inner node, the Bonferroni-adjusted P values are given, which take into account the multiple testing and may differ from the P values of the log-rank test in the univariable analysis (Table 3).
The classification trees showing the prognostic signature consisting of 2 variables, MTV and MH, whose dichotomization was significantly correlated with survival. MTV alone, when its value is low, identifies the prognostic category node 2 with best survival probability. To separate the prognostic categories node 4, with intermediate survival rates, from node 5, with poorer survival, the value of MTV must be high (node 3), and that of MH must be low or high, respectively. The Kaplan-Meier curves show statistically different overall and progression-free survival, either in both the testing and the validation patient sets. For each inner node, the Bonferroni-adjusted P values are given, which take into account the multiple testing and may differ from the P values of the log-rank test in the univariable analysis (Table 3).
Multivariable analysis
At multivariable analysis (stepwise Cox regression including the functional PET parameters, which were significant at univariable analysis) only MTV retained statistical significance for both OS (HR, 4.4; 95% CI, 1.9-10; P < .01) and PFS (HR, 3.4; 95% CI, 1.6-7.0; P = .01). The prognostic impact of MTV on OS and PFS did not change after controlling for the performance status and for the IPI, R-IPI, and NCCN-IPI.
The model integrating MTV and MH was also the only parameter retaining a significant prognostic effect on OS (HR, 3.1; 95% CI, 1.9-5.0; P < .001) and PFS (HR, 2.4; 95% CI, 1.6-3.6; P < 001) in a stepwise Cox regression including the IPIs.
Validation set
The validation set included patients with significantly older age and showed a lower proportion of patients with good risk according to the NCCN-IPI, but the distribution of risk groups according to either IPI or R-IPI was not statistically different (Table 1). The median follow-up (36 months; IQR, 28-50) was shorter in comparison with the SAKK 38/07 cohort (P < .001). Twenty-two patients had disease progressions and 19 died. The estimated 5-year PFS and OS rates were 75% (95% CI, 63-83) and 76% (95% CI, 63-85), respectively. All the dichotomized functional PET parameters at baseline had a significant impact on OS at univariable analysis. However, only MTV showed a statistically significant association with PFS (Table 3; Figure 1, bottom). Analogous to the testing set, low values of MTV accurately identified the subset of patients with good treatment outcome (NPV, 89% and 93% for PFS and OS, respectively). However, high MTV values were less efficient in the discrimination of the poor prognosis patients (PPV, 28% and 26% for PFS and OS, respectively). Also, in keeping with the testing set, an impaired performance status predicted OS (P = .0023), but not PFS. IPI and NCCN-IPI were also associated with OS (trend test P = .0465 and 0.0261, respectively) but had no effect on PFS; R-IPI did not affect the OS nor PFS. At multivariable analysis (stepwise Cox regression controlling for the performance status and the IPIs) an elevated MTV value remained independently associated with a shorter PFS (HR, 2.9; 95% CI, 1.1-7.3; P = .028) and OS (HR, 3.6; 95% CI, 1.2-11; P = .023).
Elevated MH was associated with shorter OS (P = .043) in the entire cohort and with both PFS (P = .006) and OS (P = .016) in the subset of patients with elevated MTV. The model integrating MTV and MH showed a PPV of 46% for PFS and 45% for OS and confirmed in the validation set its ability to improve upon MTV alone the identification of the poor-risk patients with shorter PFS (HR, 5.6; 95% CI, 1.7-18) and OS (HR, 7.6; 95% CI, 2.0-28) (Figure 2, bottom). At multivariable analysis, the prognostic efficacy of this model for PFS (HR, 2.5; 95% CI, 1.5-4.3; P = .001) and OS (HR, 2.8; 95% CI, 1.6-5.1; P = .001) was maintained after controlling for the IPIs. Analogous to the testing set, the regression tree analysis generated again a predictive model based on MTV and MH, for either OS or PFS (Figure 3, bottom).
Comparison of PET-derived models and prognostic indices
The discriminatory power and predictive accuracy of this PET-derived model appeared superior, in both the testing and the validation cohorts, to the ones of the international clinical indices (Table 4) when assessed by using either the AIC46 or a CPE estimator (Harrell C statistic).45
Comparison of clinical indices and models based on MTV and MH
| PFS | OS | ||||
|---|---|---|---|---|---|
| Prognostic model | AIC | CPE | AIC | CPE | |
| Testing set | MTV dichotomized | 265 | 0.6436 (±0.0433) | 207 | 0.6847 (±0.0440) |
| MTV+MH model | 260 | 0.6684 (±0.0440) | 201 | 0.7065 (±0.0443) | |
| IPI | 273 | 0.5908 (±0.0513) | 215 | 0.6086 (0.0584) | |
| R-IPI | 272 | 0.5908 (±0.0498) | 214 | 0.6175 (±0.0564) | |
| NCCN-IPI | 272 | 0.5857 (±0.0511) | 211 | 0.6409 (±0.0578) | |
| Validation set | MTV dichotomized | 192 | 0.6356 (±0.0556) | 162 | 0.6346 (±0.0607) |
| MTV+MH model | 186 | 0.6944 (±0.0586) | 156 | 0.6884 (±0.0638) | |
| IPI | 194 | 0.6143 (±0.0613) | 165 | 0.6171 (±0.0668) | |
| R-IPI | 196 | 0.5586 (±0.0556) | 166 | 0.5933 (±0.0606) | |
| NCCN-IPI | 196 | 0.5729 (±0.0592) | 164 | 0.6150 (±0.646) | |
Discussion
Despite the potential power limitation because of the overall good outcome of patients in our cohorts, resulting in a relatively low number of events, this study further substantiates the high predictive value of baseline MTV in DLBCL31-35 and provides a first evidence that MH combined with other functional volumetric PET parameters may allow to foresee treatment outcomes in DLBCL. The main strengths of this study are the uniform treatment, the centralized analysis of PET scans, and, above all, the reproducibility assessment in an independent validation set of patients of the observations made in the cohort of patients enrolled in the SAKK38/07 study. Differences (eg, in age, COO, and MH distribution) between the testing and validation sets support the potential general validity of the proposed model, too.
Because taking into account the interaction of individual factors in determining an outcome endpoint (such as PFS or OS) can be difficult, their selection in a prognostic model is typically complex. We built the model that combines MTV and MH on the basis of the impact of MH in the subsets of patients with high MTV or nonlocalized disease. This model is also in keeping with a recent meeting abstract48 and with the observations we previously made in a primary mediastinal lymphoma study, where the subset of patients with elevated MH and TLG values had a particularly dismal prognosis.39 The validity of the model was then confirmed by an unsupervised approach using a methodology (regression tree analysis based on unbiased binary recursive partitioning) that is widely used in data mining.47 This alternative statistical approach maximizes sensitivity by identifying patients truly at risk, minimizes misclassification of low-risk patients, and can stratify patients into different levels of risk.47 The regression tree analysis in our datasets ended up with the same 2 PET-derived factors (MTV and MH), producing a simple decision tree that appears accurate and easy to apply.
The present study provides the first demonstration that MH can play a critical role in DLBCL, where (especially in the presence of large MTVs) it appears to be associated with treatment resistance and treatment failure. In both the testing and the validation cohorts, MH effectively discriminated, among patients with increased MTV, those with truly poorer prognosis.
MH describes a complex phenomenon (depending on cell metabolism, proliferation, blood flow, and hypoxia) that reflects the clinical and molecular heterogeneity of the disease.39 It appears plausible that MH introduced into our prognostic model additional biological information that contributed to further characterize the prognostic risk defined by the simple metrics of the tumor burden provided by the MTV estimation.
Main limitations of the study, which may make the use of MTV and MH in routine clinical practice still premature, are the absence of standardized methodology and the lack of agreement on the optimal estimation of volume-based PET parameters. Different procedures and a wide range of threshold levels have been proposed to calculate MTV.35,43,49 Moreover, the prognostic effect of MTV has been estimated using cut-points that are heavily cohort-dependent, being generated by ROC analysis of small series. In this study, we chose to use a segmentation method with a fixed-threshold at SUV = 2.543 that, compared with the widely used percentage threshold at 41% of SUVmax, maintains a similar accuracy and offers better tumor coverage,41 particularly in lesions with heterogeneous FDG uptake distribution.49
Although the lack of standardization endangers the reproducibility of the results obtained in retrospective studies, there is increasing evidence of the prognostic value of quantitative parameters obtained from 18FDG‐PET/CT in patients with different non‐Hodgkin lymphoma subtypes.17,26,28,50,51 We sought to use the quantitative parameters from PET scans to discriminate patient with different outcomes. The PET-based prognostic models appeared superior to the clinical and pathological prognostic indices that are widely and routinely used. Prior reports have already indicated that volumetric PET parameters may be better outcome predictors than the IPI.31,52 Only 1 study, which analyzed a limited number of quantitative whole-body 18FDG-PET/CT and failed to show any independent prognostic utility of PET parameters, suggested that the NCCN-IPI may be superior53 ; however, the latter study adopted a dichotomized NCCN index which is not currently used.
Work is in progress to solve the previously mentioned methodological problems54-56 and the integration of the functional PET parameters with clinical indices and molecular features is expected to become an important tool for a more precise identification of the very-high-risk group of patients and for the subsequent development of patient‐tailored treatment approaches.29,56,57 In this perspective, our results indicate that models based on the combination of functional parameters from baseline 18FDG-PET/CT may represent a simple and powerful tool to help early identification of patients with very high risk for initial treatment failure, who can be selected for more intensive treatment (eg, stem cell transplant or CAR-T cell strategies). If confirmed in other cohorts, these results could influence the design of future clinical trials and may offer an opportunity to reduce the number of patients dying from refractory DLBCL.
Presented in part at the 15th International Conference on Malignant Lymphoma, Lugano, Switzerland, 20 June 2019.
E-mail data sharing requests to the corresponding author, Emanuele Zucca (emanuele.zucca@eoc.ch).
Acknowledgments
The authors thank the investigators, research nurses, and data managers of the SAKK 38/07 trial at each study center, as well as the central study team at the SAKK coordinating center for their administrative support in data collection and study conduction. The authors also thank their colleagues Franco Cavalli and Beat Thürlimann for critically reading the manuscript and for their fruitful feedback and thoughtful discussion; special thanks go to Sarah Jane Ortelli Giannakis for her editorial support and to Rita Gianascio Gianocca for the secretarial help. The authors express gratitude to Francesca Ceriani, MSMBE, for her assistance in the estimation of metabolic heterogeneity.
The SAKK 38/07 trial was subsidized by a grant from Amgen (Switzerland) and a grant (OCS 02270-08-2008) from Oncosuisse (Switzerland). The present analysis was partly supported by a grant (ABREOC 22008-262) from the Ente Ospedaliero Cantonale, Bellinzona (Switzerland). The SAKK organization is supported by the Swiss State Secretariat for Education, Research and Innovation (SERI).
Authorship
Contribution: L. Ceriani and E.Z. designed the study, performed research, analyzed the data, and wrote the paper; L. Cascione contributed to the study design data analysis and manuscript writing; S.H. and S.S. reviewed the statistical analysis; and all authors contributed to data collection, reviewed and approved the manuscript, and shared final responsibility for the decision to submit.
The members of the Swiss Group for Clinical Cancer Research (SAKK) appear in the Appendix.
Conflict-of-interest disclosure: The authors declare no competing financial interests.
Correspondence: Emanuele Zucca, Medical Oncology Clinic, Oncology Institute of Southern Switzerland, Ospedale San Giovanni, CH-6500 Bellinzona, Switzerland; e-mail: emanuele.zucca@eoc.ch.
Appendix: study group members
Members of the Swiss Group for Clinical Cancer Research (SAKK) include: Mario Bargetzi, Francesco Bertoni, Roger Burkhard, Clemens Caspar, L. Ceriani, S.D., Christoph Driessen, Natalie Fischer, Thomas Hany, Felicitas Hitz, Lorenz M. Jost, Dieter Köberle, Fatime Krasniqi, Nicolas Mach, C.M., G.M., Ulrich Mey, Walter Mingrone, A.A.M., Urban Novak, Thomas Pabst, Miklos Pless, Christoph Renner, Andrei Samarin, Mathias Schmid, A.S., Georg Tscherry, Michèle Voegeli, Reinhard Zenhäusern, Thilo Zender, Thorsten Zenz, and E.Z.

