

Key Points
TP53 mutation, VAF, and karyotypic complexity define prognostic subgroups in TP53-mutated MDS.
TP53 VAF helps predict overall, transformation-free, and relapse-free survival in TP53-mutated MDS.

Abstract
TP53 mutations are associated with adverse outcomes and shorter response to hypomethylating agents (HMAs) in myelodysplastic syndrome (MDS). Limited data have evaluated the impact of the type, number, and patterns of TP53 mutations in response outcomes and prognosis of MDS. We evaluated the clinicopathologic characteristics, outcomes, and response to therapy of 261 patients with MDS and TP53 mutations. Median age was 68 years (range, 18-80 years). A total of 217 patients (83%) had a complex karyotype. TP53 mutations were detected at a median variant allele frequency (VAF) of 0.39 (range, 0.01-0.94). TP53 deletion was associated with lower overall response rate (ORR) (odds ratio, 0.3; P = .021), and lower TP53 VAF correlated with higher ORR to HMAs. Increase in TP53 VAF at the time of transformation was observed in 13 patients (61%), and previously undetectable mutations were observed in 15 patients (65%). TP53 VAF was associated with worse prognosis (hazard ratio, 1.02 per 1% VAF increase; 95% confidence interval, 1.01-1.03; P < .001). Integration of TP53 VAF and karyotypic complexity identified prognostic subgroups within TP53-mutant MDS. We developed a multivariable model for overall survival that included the revised International Prognostic Scoring System (IPSS-R) categories and TP53 VAF. Total score for each patient was calculated as follows: VAF TP53 + 13 × IPSS-R blast score + 16 × IPSS-R cytogenetic score + 28 × IPSS-R hemoglobin score + 46 × IPSS-R platelet score. Use of this model identified 4 prognostic subgroups with median survival times of not reached, 42.2, 21.9, and 9.2 months. These data suggest that outcomes of patients with TP53-mutated MDS are heterogeneous and that transformation may be driven not only by TP53 but also by other factors.
Introduction
Myelodysplastic syndromes (MDS) are a heterogeneous group of myeloid disorders characterized by ineffective hematopoiesis leading to cytopenias and risk of transformation to acute myeloid leukemia (AML).1 Mutations in TP53 are observed in 10% to 12% of patients with MDS and are associated with adverse outcomes, risk of transformation to AML, and shorter response to current available therapies.2-8 Although most TP53 mutations occur within the DNA-binding domain (DBD), mutations can be observed throughout the whole gene length.2,9-12 Recent studies suggest the clonal size of TP53 mutations, determined by the variant allele frequency (VAF), may influence prognosis.4,13 Preclinical models suggest that distinct mutation types in different TP53 gene domains may lead to different impacts on protein functionality.14-17 Whether these functional differences translate into distinct clinical features and outcomes and how the type, number, and size of TP53 mutations influence the prognosis of patients with TP53-mutated MDS remains unclear, so it has become necessary to determine whether additional disease characteristics such as karyotypic abnormalities or additional gene mutations influence prognosis in this group of patients. In addition, although TP53 mutations are known to predict for transformation to AML, the specific clonal changes that lead to transformation to AML in TP53-mutant MDS are not fully understood.
In this study, we evaluated the TP53 and comutational patterns and characteristics of a cohort of 938 patients with MDS, including 261 patients with TP53 mutations. We evaluated the patterns of TP53 mutations, other mutated genes, and TP53 deletions and correlated them with clinical outcomes to determine whether specific prognostic subsets of patients with TP53-mutated MDS could be identified.
Materials and methods
Patients and samples
We evaluated all consecutive patients with previously untreated MDS who were treated at The University of Texas MD Anderson Cancer Center (MDACC) from 2013 to 2018. Informed consent was obtained according to protocols approved by the MDACC Institutional Review Board in accordance with the Declaration of Helsinki. Diagnosis was confirmed in the hematopathology laboratory at MDACC by morphologic, cytochemical, and immunohistochemical analysis using the World Health Organization (WHO) 2008 and 2016 criteria.18 Conventional karyotyping was performed on fresh bone marrow (BM) aspirate using standard procedures and reported by using the International System for Human Cytogenetic Nomenclature 2013.19 Prognostic risk was calculated using both the International Prognostic Scoring System (IPSS)20 and the revised IPSS (IPSS-R)21 for patients with MDS.
Targeted gene sequencing analysis
Genomic DNA was extracted from whole BM aspirate samples and was subjected to targeted polymerase chain reaction–based sequencing using a next-generation sequencing platform as previously described.22 This analysis was performed within the MDACC Clinical Laboratory Improvement Amendments–certified Molecular Diagnostics Laboratory after informed consent (additional details in the supplemental Data). For next-generation sequencing–based analysis, the limit of detection for variant calling was 2%. Previously described somatic mutations registered at the Catalogue of Somatic Mutations in Cancer (COSMIC: http://cancer.sanger.ac.uk/cosmic) were considered as potential driver mutations.
Determination of deletion of TP53 based on conventional karyotyping
To evaluate the presence of TP53 locus deletion, all patients had conventional karyotyping performed on unsorted BM. For cases of chromosome 17 alteration in cytogenetics that usually result in TP53 loss, fluorescence in situ hybridization (FISH) may or may not have been performed. For cases involving balanced changes involving breakpoint at 17p13, FISH was required to confirm or exclude a TP53 deletion. Deletion of TP53 was counted as present in the following cytogenetic alterations: monosomy 17; isochromosome i(17)(q10); del(17)(pvar(variable)) with pvar centromeric to p13.1; unbalanced translocations, including der(var)t(var;17)(var;qvar),–17; der(var)t(var;17)(var;pvar),–17 with pvar centromeric to p13.1; der(17)t(17;var)(pvar;var)der(17)t(var;17)(var;pvar) with pvar centromeric to p13.1; der(var)t(var;17)(var;qvar) with dicentric der; der(var)t(var;17)(var;pvar) with pvar centromeric to p13.1 and dicentric der; balanced translocation and 17p13 breakpoint: t(17;var)(p13;var) or t(var;17)(var;p13) in the presence of TP53 deletion by FISH; additive material: add(17)(pvar) in the presence of TP53 deletion by FISH; dicentric chromosome dic(var;17)(var;pvar); and ring chromosome r(17)(pvarqvar) with the presence of TP53 deletion by FISH.
Statistical analysis and response assessment
Response assessment was performed by following 2006 International Working Group criteria.23 Response assessment included BM aspiration after cycle 1 of therapy in all patients followed by sequential BM aspirations every 1 to 3 months. Generalized linear models were used to study the association of overall response rate (ORR), complete remission (CR), and risk factors. Overall survival (OS) was calculated as the number of months from diagnosis to death or last follow-up date. Transformation-free survival (TFS) was defined as the time interval between diagnosis and date of transformation or death. Relapse-free survival (RFS) was calculated from the time of response until relapse or death in response. Patients who were alive at their last follow-up were censored on that date. The Kaplan-Meier product limit method24 was used to estimate the median OS, TFS, and RFS for each clinical or demographic factor. Univariable Cox proportional hazards regression was used to identify any association with each of the variables and survival outcomes.
Results
Patient characteristics
A total of 938 patients with MDS were evaluated during the reviewed time period. Among these, a total of 261 (28%) had detectable TP53 mutations. Patient characteristics are summarized in Table 1. Among patients with TP53-mutant MDS, 8 (3%) were classified as very-low risk (VL), 17 (7%) as low risk (L), 18 (7%) as intermediate risk (Int), 48 (18%) as high risk (H), and 170 (65%) as very-high risk (VH) by IPSS-R. Twenty patients (2%) met criteria for MDS with isolated del(5q) of whom 10 (50%) received therapy with lenalidomide, 3 (15%) with hypomethylating agents (HMAs), 3 (15%) with erythropoietin-stimulating agents, and 4 (20%) were on observation. A total of 138 patients (53%) had therapy-related MDS (T-MDS) related to therapy for previous malignancies, which included chemotherapy in 131 patients (50%) and radiation therapy in 70 patients (27%). Treatment data were available for a total of 201 patients (77%), with the remaining not having available treatment and response data because of loss to follow-up or therapy at an outside institution. Patients who did not receive therapy at our institution were older (median age, 70 vs 68 years; P = .034), more frequently female (73% vs 57%; P = .025), and had a higher frequency of VL or L risk by IPSS-R (VL: 10% vs 1%, L: 17% vs 4%; P < .001) and higher frequency of good cytogenetic features by IPSS-R (22% vs 7%; P = .003) than patients who did receive therapy at MDACC. Characteristics of patients for which no data on therapy were available are provided in supplemental Table 1. First-line therapy in these patients was chemotherapy-based in 4 patients (2%), single-agent HMAs in 121 patients (60%) (azacitidine in 37 [30%], decitabine in 55 [45%], and guadecitabine in 29 [24%]), HMA in combination with novel agents in 73 patients (36%), and immunomodulatory drugs in 1 patient. A total of 39 patients (15%) underwent allogeneic stem-cell transplantation (allo-SCT), including 2 patients who underwent allo-SCT directly after diagnosis with no pretransplantation therapy.
Clinical characteristics of patients who have MDS with TP53 mutations
| Characteristic | TP53-mutant MDS (n = 261) | TP53-wildtype MDS (n = 677) | P | ||||||
|---|---|---|---|---|---|---|---|---|---|
| n | % | Median | Range | n | % | Median | Range | ||
| Median age, y | 68 | 18-90 | 67 | 22-93 | .770 | ||||
| Male sex | 157 | 61 | 444 | 67 | .101 | ||||
| Hemoglobin, g/dL | 9.2 | 8.9-9.4 | 12 | 7.9-16.1 | .408 | ||||
| WBC, × 109/L | 3.7 | 3.4-4.1 | 4.1 | 3.8-4.3 | .211 | ||||
| Platelets, × 109/L | 84 | 73-95 | 130 | 122-139 | <.001 | ||||
| ANC, × 109/L | 1.9 | 1.6-2.1 | 2.2 | 2.0-2.4 | .023 | ||||
| Median BM blast % | 6 | 0-18 | 3 | 0-19 | <.001 | ||||
| WHO MDS diagnosis | <.001 | ||||||||
| Single lineage dysplasia | 16 | 6 | 41 | 6 | |||||
| Multilineage dysplasia | 52 | 20 | 212 | 31 | |||||
| Ring sideroblasts | 22 | 8 | 101 | 15 | |||||
| Excess blasts | 150 | 58 | 266 | 39 | |||||
| Unrecognized | 15 | 6 | 42 | 6 | |||||
| del(5q) | 5 | 2 | 15 | 2 | |||||
| Not available | 0 | 0 | 1 | 0 | |||||
| IPSS-R risk category | <.001 | ||||||||
| Very low | 8 | 3 | 88 | 13 | |||||
| Low | 17 | 7 | 217 | 32 | |||||
| Intermediate | 18 | 7 | 88 | 24 | |||||
| High | 48 | 18 | 124 | 19 | |||||
| Very high | 170 | 65 | 78 | 12 | |||||
| Not available | 0 | 0 | 8 | ||||||
| IPSS-R cytogenetic group | <.001 | ||||||||
| Very good | 3 | 1 | 18 | 3 | |||||
| Good | 27 | 10 | 423 | 63 | |||||
| Intermediate | 6 | 2 | 113 | 17 | |||||
| Poor | 7 | 3 | 55 | 8 | |||||
| Very poor | 218 | 84 | 60 | 9 | |||||
| Complex karyotype | 217 | 83 | 60 | 9 | <.001 | ||||
| Therapy related | 138 | 53 | 91 | 13 | <.001 | ||||
| Prior chemotherapy | 131 | 50 | 80 | 12 | |||||
| Prior radiation | 70 | 27 | 58 | 9 | |||||
ANC, absolute neutrophil count; WBC, white blood cell count.
Landscape and characteristics of TP53 mutations and other identified co-mutations
A total of 396 mutations in TP53 were detected with a median VAF of 39% (range, 1% to 94%). Mutations included 309 (78%) missense, 28 (7%) nonsense, 37 (9%) frameshift insertions or deletions, and 18 (5%) splice-site mutations. The most prevalent mutation was R273H (n = 18; 0.05%) followed by R248W (n = 14; 0.04%), Y220C (n = 16; 0.04%), and R175H (n = 13; 0.03%). Locations of all identified mutations are shown in Figure 1A. Most evaluated patients (n = 175; 67%) had 1, 75 (29%) had 2, 10 (4%) had 3, and 1 (0.4%) had 4 detectable TP53 mutations. All but 1 patient had at least 1 missense mutation affecting the DBD. Patterns of co-mutation indicating type of mutation are shown in supplemental Figure 1. There was no difference in TP53 mutation VAF among patients with T-MDS and de novo MDS (P = .35).
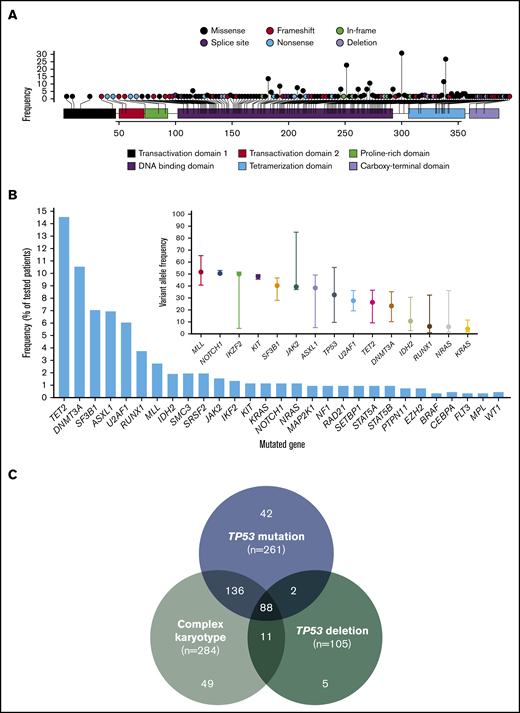
Landscape of identified TP53 mutations and other co-mutations. (A) Lollipop plot representing all identified mutations in TP53. Height of bar plot represents frequency of a specific mutation. Color of each mutation (circles) represents mutation type. Color of each gene region represents domains. (B) Frequency of identified mutations in other genes by amplicon-based next-generation sequencing. VAFs of identified mutations with median and range. Mutations are ordered by decreasing median VAF. (C) Frequencies of TP53 mutation, TP53 deletion, and complex karyotype among the entire patient cohort (n = 938).
Landscape of identified TP53 mutations and other co-mutations. (A) Lollipop plot representing all identified mutations in TP53. Height of bar plot represents frequency of a specific mutation. Color of each mutation (circles) represents mutation type. Color of each gene region represents domains. (B) Frequency of identified mutations in other genes by amplicon-based next-generation sequencing. VAFs of identified mutations with median and range. Mutations are ordered by decreasing median VAF. (C) Frequencies of TP53 mutation, TP53 deletion, and complex karyotype among the entire patient cohort (n = 938).
A total of 94 patients (37%) had detectable mutations in genes other than TP53. The most frequently mutated gene was TET2 present in 15% of patients, followed by DNMT3A in 11% and ASXL1 and SF3B1 in 7%. Frequency and VAF of identified mutations are shown in Figure 1B. We studied the association of specific mutations present in at least 5 patients with the presence of other mutations (supplemental Table 3). Substitution of arginine with tryptophan in amino acid position 273 (R273C) tended to be observed in the presence of mutations in other sequenced genes (odds ratio [OR], 6.48; P = .076).
Karyotypic abnormalities and their associations with TP53 mutations
The presence of a complex karyotype was associated with the presence of a TP53 mutation (complex karyotype 78.3% vs non-complex karyotype 6.7%; P < .001). TP53 mutations in patients without a complex karyotype included 55 missense mutations, nonsense mutations in 2 patients (4%), and frameshift mutations in 2 patients (4%); they affected the DBD in all but 2 patients in whom the mutation was located in the topologically associating domain. In addition, the VAF of TP53 mutations in patients without a complex karyotype was significantly lower than in those with karyotypic complexity (median, 5.1% [range, 1%-58.4%] vs 33.9% [range, 0%-93.6%]; P < .001).
A total of 20 patients (2%) met the criteria for MDS with isolated del(5q) based on WHO classification. Among these, 5 patients (20%) had TP53 mutations, including 2 patients with 1 detectable mutation (Y107X [VAF = 58.4%] and R248Q [VAF = 25.9%]) and 3 patients with 2 detectable TP53 mutations (Y220C [VAF = 2.3%] and A138T [VAF = 23.2%] and Y163C [VAF = 14.6%] and P152Q [VAF = 10.7%]).
TP53 deletions were significantly more frequent among patients with mutated TP53 compared with those with wild-type TP53 (31.8% vs 2.2%; P < .001), even among patients with complex karyotype (37.3% vs 18.3%; P = .005). Frequencies of co-occurrence of TP53 mutations, TP53 deletion, and complex karyotype are shown in Figure 1C. Patients with T-MDS were more likely to have complex karyotype (OR = 5.45; P < .0001) and have a TP53 mutation (OR = 6.15; P < .0001). In patients with TP53-mutated MDS, there were no differences in the frequency of TP53 deletions (33.3% vs 30.1%; P = .573) or complex karyotype (84.8% vs 81.3%; P = .453) between patients with T-MDS and de novo MDS. Among patients with TP53 mutations, those with more than 1 detectable mutation were less likely to have TP53 deletions (9.3% vs 42.9%; P < .001).
To determine whether this could be associated with biallelic loss of TP53 among double-TP53 mutants, we assessed TP53 dynamics in 18 patients with multiple TP53 mutations for whom longitudinal sequencing was available (supplemental Figure 2). Among these 18 patients, dynamics of both TP53 mutations throughout therapy, response, and relapse suggested that both could be present within the same clone in 8 patients (44%).
TP53 mutation VAF and TP53 deletion influence response outcomes with HMA therapy
With a median follow-up of 21.9 months (95% confidence interval [CI], 20.3-25.6 months), in contrast with previous studies,25 there were no significant differences in ORR (58% vs 63%; P = .303) or CR (27% vs 22%; P = .288) based on the presence of TP53 mutation in patients treated with HMAs. Among patients treated with single-agent HMAs, a trend to higher ORR was observed in patients treated with guadecitabine compared with azacitidine or decitabine (62% with guadecitabine, 49% with azacitidine, and 40% with decitabine; P = .419), with no significant differences in CR rates (28% with guadecitabine, 22% with azacitidine, and 16% with decitabine; P = .739). Schedules of HMA therapy are detailed in supplemental Table 2. The presence of TP53 deletion was associated with lower ORR (OR, 0.53; P = .021). Lower TP53 mutation VAF correlated with higher ORR, but there were no differences in CR rate or response duration based on VAF (supplemental Figure 3). There was a trend for higher TP53 VAF to be associated with shorter response duration (hazard ratio [HR], 1.007; 95% CI, 0.999-1.015; P = .099) even when corrected for IPSS-R. In addition, there was no correlation between the number of TP53 mutations and TP53 abnormalities with ORR or CR, but the presence of 1 or more TP53 abnormalities was associated with shorter response duration (median response duration, not reached for no TP53 mutation vs 14.8 months if there was 1 TP53 mutation [HR, 2.51; 95% CI, 1.23-5.11; P = .011] and 14.7 months if there were 2 or more TP53 mutations [HR, 2.9; 95% CI, 1.64-5.13; P < .001) (supplemental Figure 4).
Longitudinal sequencing throughout the course of therapy was available in 64 patients with TP53-mutated disease. The clonal size of the TP53 mutation, determined by VAF, decreased more among responders than among nonresponders (P = .022) with subsequent increase of VAF at the time of relapse (Figure 2).
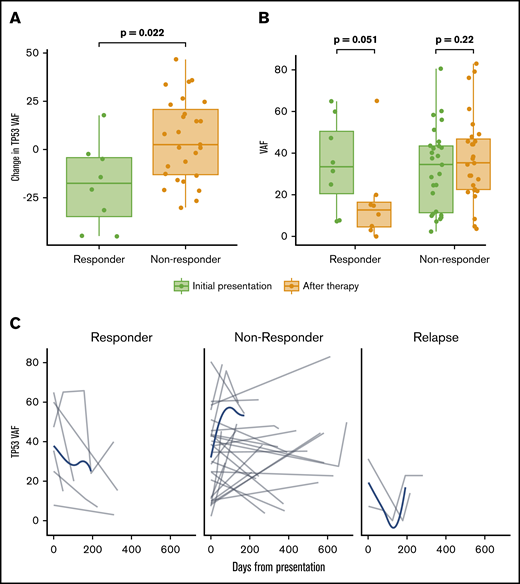
Influence of TP53 mutation VAF in response and dynamic changes of TP53 VAF throughout therapy. (A) Percentage change in TP53 mutation VAF before and after therapy in patients with and without a clinical response to HMA therapy. (B) TP53 VAF before and at the time of response assessment in patients with and without clinical response to HMA therapy. (C) Time-dependent changes of TP53 VAF among 64 patients with multiple sequencing time points throughout the course of therapy, including response assessment, disease progression, transformation, or relapse. Gray lines represent changes in a specific patient; blue lines represent tendencies of the entire evaluable cohort.
Influence of TP53 mutation VAF in response and dynamic changes of TP53 VAF throughout therapy. (A) Percentage change in TP53 mutation VAF before and after therapy in patients with and without a clinical response to HMA therapy. (B) TP53 VAF before and at the time of response assessment in patients with and without clinical response to HMA therapy. (C) Time-dependent changes of TP53 VAF among 64 patients with multiple sequencing time points throughout the course of therapy, including response assessment, disease progression, transformation, or relapse. Gray lines represent changes in a specific patient; blue lines represent tendencies of the entire evaluable cohort.
Cytogenetic evolution and mutational dynamics during transformation to AML
Among the 261 patients with TP53-mutant MDS, 63 (24%) experienced transformation to AML with a median TFS of 10.6 months (95% CI, 8.8-12.3 months). Univariable analysis identified the number of TP53 mutations (HR, 2.03; 95% CI, 1.3-3.05; P < .001), TP53 mutation VAF (HR, 1.02 increase per 1% VAF increase over a VAF of 0%; 95% CI, 1.01-1.02; P < .001), presence of TP53 deletion (HR, 2.10; 95% CI, 1.38-3.19; P < .001), and the presence of complex karyotype (HR, 2.58; 95% CI, 1.70-3.91; P < .001) as predictors of shorter TFS. By multivariable analysis that included these factors and IPSS-R, only TP53 mutation VAF remained an independent predictor of shorter TFS (HR, 1.02 increase per 1% VAF increase; 95% CI, 1.00-1.03; P = .005). On the basis of a Martingale residual analysis,26 the relationship between TP53 VAF and AML transformation risk remained linear at all TP53 VAF levels.
Sequencing data at the time of transformation was available in 23 (37%) of 63 patients who experienced transformation, including 9 patients (39%) with T-MDS and 14 patients (61%) with de novo MDS. Increase in TP53 VAF was observed in 5 patients (56%) with T-MDS and 8 patients (57%) with de novo MDS (P = .940). Acquisition of new previously undetectable mutations was observed in 5 patients (56%) with T-MDS and in 7 patients (50%) with de novo MDS (P = .675). New recurrent cytogenetic abnormalities were observed in 13 patients (57%) (P = .907) (Figure 3). Among patients in whom transformation was not driven by expansion of the TP53 mutant clone (n = 10), acquisition of previously undetectable mutations was observed in 5 patients (50%) with acquisition of inv(3), monosomy 7, and monosomy 17 in 1 patient each. Detailed mutational and cytogenetic changes at the time of MDS diagnosis and transformation in patients with de novo and T-MDS are shown in Figure 4.
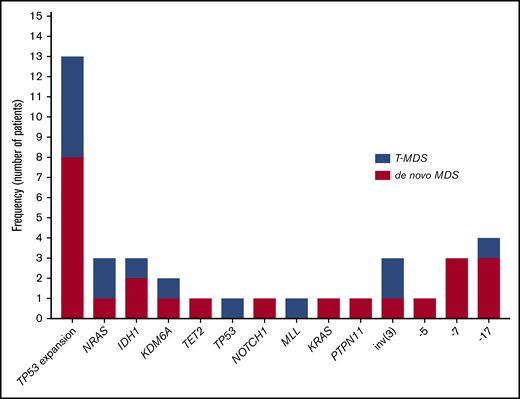
Mutation and cytogenetic changes at the time of transformation. Frequency of TP53 mutation expansion represents percentage of patients with increase in VAF of TP53 mutation at the time of transformation among evaluable patients (n = 23).
Mutation and cytogenetic changes at the time of transformation. Frequency of TP53 mutation expansion represents percentage of patients with increase in VAF of TP53 mutation at the time of transformation among evaluable patients (n = 23).
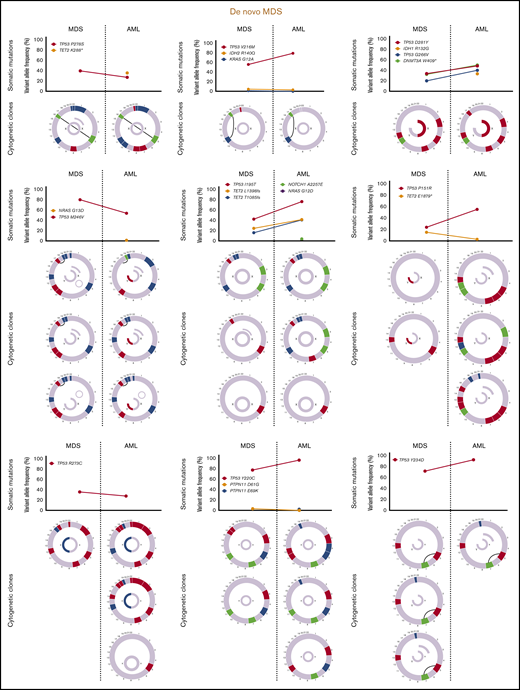

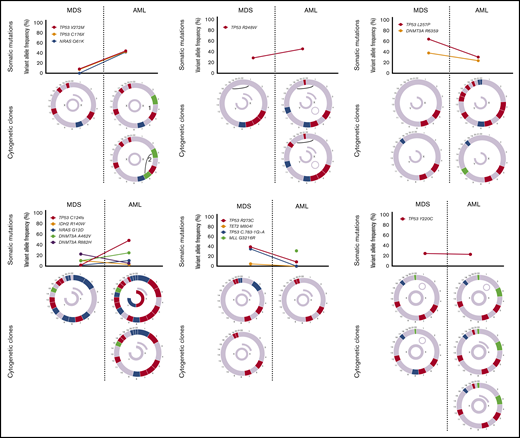
Cytogenetic evaluation and next-generation sequencing at baseline and time of transformation to AML. For each section of the figure, the upper graph represents VAF of detectable mutations at the time of diagnosis of MDS and at transformation. Lower graphs represent gain (blue) or loss (red) of chromosomal material and translocations (thin black lines connecting chromosomes) present at diagnosis or transformation. A partial semicircle present in the upper right corner of sexual chromosomes in some patients represents marker chromosomes. Inversions or derivatives are shown in green.
Cytogenetic evaluation and next-generation sequencing at baseline and time of transformation to AML. For each section of the figure, the upper graph represents VAF of detectable mutations at the time of diagnosis of MDS and at transformation. Lower graphs represent gain (blue) or loss (red) of chromosomal material and translocations (thin black lines connecting chromosomes) present at diagnosis or transformation. A partial semicircle present in the upper right corner of sexual chromosomes in some patients represents marker chromosomes. Inversions or derivatives are shown in green.
TP53 mutation VAF and cytogenetic complexity define specific prognostic subgroups within TP53-mutated MDS
By univariable analysis, the presence of TP53 mutation (HR, 4.8; 95% CI, 3.9-6.1; P < .001), TP53 deletion (HR, 3.7; 95% CI, 2.9-4.9; P < .001), or complex karyotype (HR, 5.0; 95% CI, 4.0-6.3; P < .001) were associated with adverse prognosis (Figure 5A; supplemental Figure 5). No differences in survival were observed on the basis of the type of TP53 mutation (supplemental Figure 6). A nonsignificant trend to worse outcomes in patients with mutations not involving DBD was observed (supplemental Figure 7). Among patients with MDS with isolated del(5q), the presence of a TP53 mutation was not associated with significantly shorter survival (median OS, 22.1 vs 28.1 months; HR, 4.61; 95% CI, 0.60-35.25; P = .140). Among patients with TP53-mutant MDS, the presence of a JAK2 mutation was associated with worse outcomes (HR, 4.38; 95% CI, 1.36-14.1; P = .013) with no other co-occurring mutations influencing survival. The presence of 2 or more TP53 abnormalities, determined by the number of mutations and the presence of TP53 deletion, was associated with shorter survival (HR, 1.39; 95% CI, 1.03-1.89; P = .034; Figure 5B). In addition, TP53 VAF was associated with worse prognosis (HR, 1.02 per 1% VAF increase; 95% CI, 1.01-1.03; P < .001), and patients could be classified into 3 distinct prognostic groups on the basis of their TP53 VAF (Figure 5C). Integration of TP53 VAF and karyotypic complexity was able to distinguish prognostic subgroups within patients with TP53-mutant MDS (Figure 5D; supplemental Figure 8). Furthermore, no significant survival differences could be observed among patients with wild-type TP53 and those with TP53 VAF <10% in the absence of a complex karyotype (median OS, 13.6 vs 27 months; HR, 1.77; 95% CI, 0.90-3.50; P = .10; supplemental Figure 9), even when corrected by IPSS-R category (supplemental Table 2).
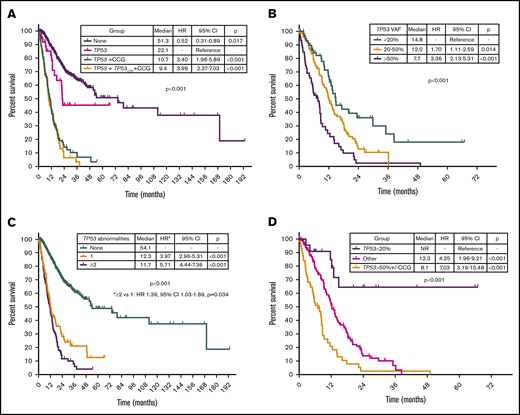
Prognostic subgroups of patients with TP53-mutant MDS based on TP53 VAF and karyotype. Kaplan-Meier estimate curves for OS of patients based on the presence of TP53 mutation, complex karyotype, and TP53 deletion (A); the number of TP53 abnormalities defined as the sum of mutations and deletions (B); VAF of TP53 mutation (C); and VAF of TP53 mutation and presence of a complex karyotype (D). CCG, complex cytogenetics; LOH, loss of heterozygosity.
Prognostic subgroups of patients with TP53-mutant MDS based on TP53 VAF and karyotype. Kaplan-Meier estimate curves for OS of patients based on the presence of TP53 mutation, complex karyotype, and TP53 deletion (A); the number of TP53 abnormalities defined as the sum of mutations and deletions (B); VAF of TP53 mutation (C); and VAF of TP53 mutation and presence of a complex karyotype (D). CCG, complex cytogenetics; LOH, loss of heterozygosity.
Allo-SCT was associated with improved OS (median OS, 14.4 vs 10.7 months; HR, 0.57; 95% CI, 0.37-0.87; P = .01), even among patients with complex karyotype (median OS, 14.2 vs 9.2 months; HR, 0.53; 95% CI, 0.35-0.82; P = .004). TP53 mutation VAF trended toward being associated with worse OS (HR, 1.02 per 1% VAF increase; 95% CI, 0.99-1.04; P = .098). Although a trend to improved survival was observed for all groups (supplemental Figure 10), improved OS with transplantation was statistically significant only among patients with TP53 VAF of 20% to 50%, although the difference was marginal (median OS, 14.2 vs 11.5 months; P = .046). Among patients with wild-type TP53, a total of 118 patients (17%) underwent allo-SCT (VL, 7 [8%] of 88; L, 26 [12%] of 217; Int, 35 [22%] of 162; H, 24 [19%] of 124; VH, 26 [33%] of 78). When corrected by IPSS-R category, transplantation was associated with improved OS (HR, 0.62; 95% CI, 0.42-0.91; P = .015) with the main benefit being observed in H patients (median OS, not reached vs 25 months; P = .044) by IPSS-R category.
To further evaluate the prognostic effect of TP53 mutation characteristics, we performed a multivariable Cox proportional hazards model for OS. The following patient characteristics were independently associated with shorter OS (Table 2): TP53 VAF, IPSS-R BM blast percentage, and cytogenetic, hemoglobin, and platelet categories. The clonal size (VAF) of TP53 mutation was included as a continuous variable, and all other variables were categorical. Further analysis indicated no statistically significant interaction between TP53 VAF and the IPSS-R score in predicting OS (P > .1), demonstrating that an additive model is appropriate. The fitted multivariable Cox model was validated by 10-fold cross-validation, with a corrected concordance index of 0.81, demonstrating a strong model fit. This model was used to generate a nomogram for OS (Figure 6A). This nomogram provides a visual depiction of the relative contribution of each prognostic factor to the total point score and the weight of factors influencing survival. The formula for calculating the total point score is as follows: total score = VAF TP53 + 13 × IPSS-R blast score + 16 × IPSS-R cytogenetic score + 28 × IPSS-R hemoglobin score + 46 × IPSS-R platelet score. Total point scores ranged from 0 to 277.1, with a median of 89.4. Median survival times for the 4 groups (lowest to highest score) were not reached, 42.2, 21.9, and 9.2 months (Figure 6B). We then performed multivariable Cox proportional hazards models for RFS and TFS and developed similar nomograms (supplemental Figures 11 and 12).
Multivariable analysis for OS
| Variable | HR | 95% CI | P |
|---|---|---|---|
| TP53 VAF | 1.018 | 1.010-1.025 | <.001 |
| One TP53 mutation | 1.25 | 0.78-2.00 | .35 |
| Multiple TP53 mutations | 1.39 | 0.88-2.19 | .15 |
| TP53 deletion | 0.95 | 0.68-1.32 | .75 |
| IPSS-R category | |||
| Absolute neutrophil count | 0.78 | 0.47-1.30 | .35 |
| BM blast count | 1.32 | 1.18-1.47 | <.001 |
| Cytogenetic risk category | 1.32 | 1.17-1.50 | <.001 |
| Hemoglobin | 1.72 | 1.39-2.12 | <.001 |
| Platelets | 2.55 | 1.92-3.40 | <.001 |
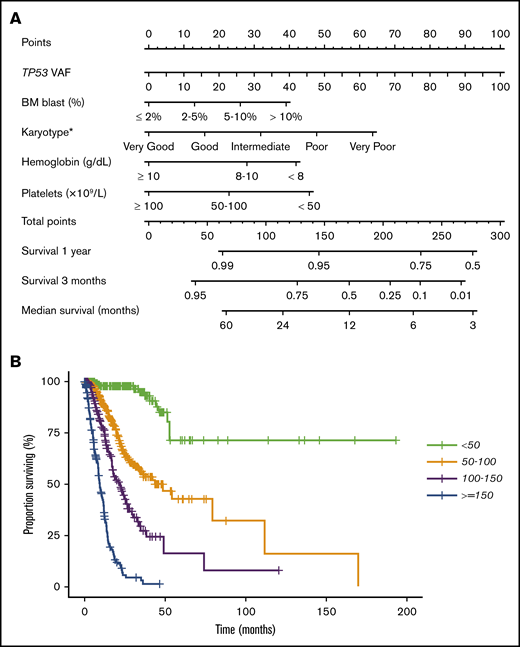
Multivariable Cox proportional hazards model and nomogram for OS. (A) Nomogram for OS. Nomogram used by totaling points identified at top scale for each of the independent variables. This summed point score was then identified on a total point scale to identify the 3-month and 1-year survival probability and median OS. (B) Kaplan-Meier estimate curves for OS, which were based on the 4 groups determined by the median point score of the multivariable model.
Multivariable Cox proportional hazards model and nomogram for OS. (A) Nomogram for OS. Nomogram used by totaling points identified at top scale for each of the independent variables. This summed point score was then identified on a total point scale to identify the 3-month and 1-year survival probability and median OS. (B) Kaplan-Meier estimate curves for OS, which were based on the 4 groups determined by the median point score of the multivariable model.
Discussion
Mutations in TP53 are associated with dismal prognosis and short response durations to currently available therapies.3,9,10 Current preclinical studies suggest that not all TP53 mutations are equal and that cellular and genomic context may define biological functions of mutant TP53.16,17 In addition, clonal size of TP53 mutations may define outcomes and prognosis of patients with these mutations.4 In this study, we evaluated a cohort of 261 patients with MDS and TP53 mutations within a cohort of 938 patients with MDS. As a result of the high number of referrals for T-MDS in our center, our study population included a higher than expected frequency of TP53-mutated MDS.7,9,11 By studying this cohort, we were able to identify that the presence of a complex karyotype affects the outcomes of patients with TP53 mutation, and we observed that the clonal size of TP53 mutations influences response to therapy with HMAs, risk of transformation to AML, and OS, even when corrected by clinically relevant parameters such as those included in the IPSS-R categories.
Although previous studies have reported the prognostic impact of TP53 mutations and the distribution and type of mutations in MDS,4,7,27 so far, there is no consistent analysis evaluating the potential associations of different co-occurring TP53 mutations or of specific TP53 mutations with other commonly recurrent mutations in MDS. In this study, 33% of patients with TP53 mutations had multiple detectable TP53 mutations. In all but 1 patient, 1 of the detectable mutations always involved a missense mutation within the DBD. In addition, frequency of nonsense, frameshift, or splice-site mutations was higher in patients with multiple TP53 mutations compared with those with a single TP53 mutation. Although this observation may be a result of the overall higher frequency of missense mutations in the DBD, it could also indicate unequal leukemogenic potential of these mutations. Further investigation into the potential distinct biological effects and leukemogenic potential of these less frequent mutations is warranted.
To evaluate the prognostic and predictive impact of TP53 abnormalities and determine whether distinct prognostic subgroups can be identified within patients with TP53-mutated MDS, we studied the association of TP53 mutations with co-occurring mutations, TP53 deletion, and the clonal size of TP53 mutations. Although prognostic risk scores such as the IPSS-R were not specifically developed for patients with T-MDS (who are known to have significantly worse outcomes than patients with de novo MDS), previous studies suggest that use of prognostic scores may still be able to identify prognostic subsets in the group of patients with T-MDS.28-30 Therefore, we decided to include the IPSS-R categories as prognostic categories within our survival analysis. By doing so, we were able to observe that TP53 mutation VAF and the presence of karyotypic complexity can clearly stratify patients with MDS into distinct prognostic subgroups, even when correcting by clinical parameters and IPSS-R score, and we developed a nomogram to predict expected median OS from the time of diagnosis. We also identified that the number of TP53 abnormalities may define the prognosis of these patients and that, as previously reported, the type of TP53 mutation does not seem to have an impact on prognosis.7 However, contrary to previous reports, which suggest that TP53 mutations may identify prognostic subgroups within groups of patients with complex karyotypes,7 we observed that the presence of a complex karyotype may define prognostic subgroups within patients with TP53 mutations. In addition, we could identify a subset of patients with low mutation burden (TP53 VAF <10%) and the absence of a complex karyotype whose outcomes may be better than expected. Compared with what we noted in previous studies,25 we did not observe higher response rates to HMAs on the basis of the presence of TP53 mutations independently of type of HMA, but patients with lower TP53 VAF were more likely to respond to HMA therapy than those with higher VAF. In addition, decrease in mutation burden was more frequently observed among patients with clinical response to therapy. This may be of particular importance when selecting optimal timing for allo-SCT, particularly when considering the poor outcomes after allo-SCT in TP53-mutant MDS and the impact of TP53 VAF in outcomes after transplantation, as reported by other studies and as observed in our study.31-34
Mutations in TP53 are known to predict for high risk of transformation to AML.9 Although this process has traditionally been assumed to be driven by TP53, in our study, we observed that expansion of the TP53 mutant clone present at the time of MDS diagnosis was associated with transformation only in a subset of evaluated patients (61%). Emergence of clones harboring previously undetected mutations or cytogenetic abnormalities was observed in 65% of patients, suggesting that the mechanisms of transformation may not be exclusively related to TP53. To further evaluate whether previous exposure to genotoxic therapy leading to therapy-related disease could determine biological differences in the mechanisms leading to transformation, we compared the genomic changes from MDS diagnosis to the time of AML transformation among de novo and T-MDS and could not identify any differences in the frequency of TP53 clonal expansion or acquisition of new mutations. However, this analysis is limited by the small patient sample in which these data were available, and future studies will be required to study this in further detail.
We acknowledge that our study has several limitations. First, our sequencing technique did not include ultra-deep sequencing and therefore small TP53 mutations (VAF <1%) may have been missed; we could not adjust for copy number changes to correct the observed VAFs. Second, the panel of genes studied was not equal among all included patients and sequencing of recurrently mutated genes such as SF3B1, SRSF2, U2AF1, and ZRSR2 were studied in only a subset of patients. Third, the retrospective nature of this study limits our ability to unequivocally confirm the potential prognostic impact of characteristics present in small patient subsets or the potential role of allo-SCT in subgroups of patients with TP53-mutated MDS. Prospective evaluation of patients with TP53-mutated MDS with deep longitudinal sequencing will be required to confirm our findings and study clonal evolution and dynamics of TP53-mutated MDS in further detail. In addition, single-cell sequencing in patients with multiple detectable TP53 mutations will be required to confirm the potential existence of biallelic TP53 mutations, and translational studies aimed at correlating specific TP53 mutations or co-mutation patterns with distinct leukemogenic potential will be required.
Despite these limitations, our data suggest that outcomes of patients with MDS and TP53 mutations are not uniform and that their response and prognosis may differ on the basis of mutation burden and genomic context, even when correcting by clinical characteristics. In addition, we identified that transformation to AML in TP53-mutated MDS is not always associated with TP53 clone expansion and that acquired or emerging clones at transformation can be potentially targetable with available or emerging agents. Finally, incorporation of this data at the time of diagnosis may allow the definition of specific subgroups of patients with TP53-mutated MDS and may help define the optimal therapeutic approach and timing of transplantation.
Acknowledgments
This work was supported in part by The University of Texas MD Anderson Cancer Center Support Grant CA016672 (from the National Institutes of Health, National Cancer Institute) and The University of Texas MD Anderson Syndromes and Acute Myeloid Leukemia Moon Shot Program.
Authorship
Contribution: G.M.-B., C.B.B., and G.G.-M. designed the study, contributed patients, analyzed the data, and helped write the manuscript; K.S., K.N., Y.A., E.J., T.M.K., F.R., G.B., K.T., N.P., N.D., M.K., and H.K. contributed patients and helped analyze the data and write the manuscript; S.R.P. and K.S.C. collected and analyzed data; C.E.B.-R. and R.K.-S. performed histopathologic analysis; K.P.P. and R.K.-S. performed sequencing analysis; C.A.C. performed biostatistical analysis; R.K.-S. reviewed bone marrow morphologic, flow cytometry, and genetic findings, analyzed the data, and helped write the manuscript; and K.A.S. helped write and edit the manuscript.
Conflict-of-interest disclosure: The authors declare no competing financial interests.
Correspondence: Guillermo Garcia-Manero, Department of Leukemia, The University of Texas MD Anderson Cancer Center, 1515 Holcombe Blvd, Box 428, Houston, TX 77030; e-mail: ggarciam@mdanderson.org.

