

Key Points
t(8;21) AML and inv(16) AML are characterized by remarkably different molecular patterns and distinct clonal compositions.
In CBF-AML, t(8;21), trisomy 8, FLT3, and KIT exon 17 mutations confer poor outcome, whereas NRAS and WT1 mutations confer good outcome.

Abstract
Core-binding factor (CBF) acute myeloid leukemia (AML) encompasses AML with inv(16)(p13.1q22) and AML with t(8;21)(q22;q22.1). Despite sharing a common pathogenic mechanism involving rearrangements of the CBF transcriptional complex, there is growing evidence for considerable genotypic heterogeneity. We comprehensively characterized the mutational landscape of 350 adult CBF-AML [inv(16): n = 160, t(8;21): n = 190] performing targeted sequencing of 230 myeloid cancer-associated genes. Apart from common mutations in signaling genes, mainly NRAS, KIT, and FLT3, both CBF-AML entities demonstrated a remarkably diverse pattern with respect to the underlying cooperating molecular events, in particular in genes encoding for epigenetic modifiers and the cohesin complex. In addition, recurrent mutations in novel collaborating candidate genes such as SRCAP (5% overall) and DNM2 (6% of t(8;21) AML) were identified. Moreover, aberrations altering transcription and differentiation occurred at earlier leukemic stages and preceded mutations impairing proliferation. Lasso-penalized models revealed an inferior prognosis for t(8;21) AML, trisomy 8, as well as FLT3 and KIT exon 17 mutations, whereas NRAS and WT1 mutations conferred superior prognosis. Interestingly, clonal heterogeneity was associated with a favorable prognosis. When entering mutations by functional groups in the model, mutations in genes of the methylation group (ie, DNMT3A, TET2) had a strong negative prognostic impact.
Introduction
Core-binding factor (CBF) leukemias constitute distinct entities within the World Health Organization 2016 classification and comprise acute myeloid leukemia (AML) with t(8;21)(q22;q22.1)/RUNX1-RUNX1T1 and AML with inv(16)(p13.1q22) or t(16;16)(p13.1;q22)/CBFB-MYH11 (hereafter commonly referred to as AML with inv(16)).1 Because of high remission rates after standard induction therapy and a long-term survival of 50% to 65%,2,3 AML with t(8;21) and inv(16) are categorized as favorable-risk AML within the 2017 European LeukemiaNet (ELN) genetic risk stratification.2-4 However, a substantial proportion of patients relapse and eventually die, emphasizing the need for a better understanding of these AML subtypes and further therapy improvement.
Both CBF-AML entities are characterized by chromosomal rearrangements involving the CBF transcriptional complex, leading to abnormal fusion proteins that block myeloid differentiation.5,6 Yet, there is compelling evidence that the CBF fusion proteins do not induce overt leukemia unless additional genetic aberrations are acquired.7 Activating mutations of genes involved in receptor tyrosine kinase/RAS pathways (RTK/RAS), mainly KIT, NRAS, and FLT3, are commonly found in CBF-AML.8,9 However, in many cases, CBF-AML leukemogenesis remains not entirely understood. Next-generation sequencing techniques allow for comprehensive genetic disease characterization, thus providing novel insights into the underlying molecular mechanisms. Recently, in a large collaborative study, we performed genetic profiling of 165 CBF-AML [t(8;21), n = 85; inv(16), n = 80] by whole-genome/whole-exome sequencing including pediatric (n = 87) and adult (n = 78) cases.10 Although commonly referred to as 1 disease group, AML with t(8;21) and inv(16) showed remarkably different mutational patterns. In addition to well-established variants in genes encoding for proteins in tyrosine kinase signaling, epigenetic regulation, and in the cohesin complex, novel candidate genes were identified.10
The objectives of our study were to validate and extend our recent findings by comprehensive profiling of the mutational spectrum in a large cohort of 350 adult patients with CBF-AML [t(8;21), n = 190; inv(16), n = 160] using a high-throughput targeted sequencing approach, and to correlate these findings with clinical outcome.
Patients and methods
Patients and treatment
Pretreatment specimens of 350 adult patients (median age, 50 years; range, 18-81 years) with CBF-AML [t(8;21), n = 190; inv(16), n = 160] were analyzed. None of the patients were included in previous studies.10,11 Patient characteristics are provided in Table 1. All patients were enrolled in 1 of 8 first-line treatment trials (n = 247 [70%]; AML HD93 [n = 23], AML HD98A [NCT00146120; n = 16], AML HD98B [n = 10], AML Study Group [AMLSG] 06-04 [NCT00151255; n = 9], AMLSG 07-04 [NCT00151242; n = 43], AMLSG 11-08 [NCT00850382; n = 56], AMLSG 21-13 [NCT02013648, n = 88], and Cancer and Leukemia Group B 10603/RATIFY trial [NCT00651261, n = 2]) or in the AMLSG Biology and Outcome (BiO)-Registry (NCT01252485, n = 103) of the German-Austrian AMLSG. A total of 332 (95%) patients received intensive induction and consolidation therapy either within 1 of the aforementioned clinical trials or according to recommended standard of care (supplemental Information). Thirty-one (9%) patients underwent allogeneic hematopoietic cell transplantation in first remission; 100 (29%) patients received the oral multitargeted tyrosine kinase inhibitor dasatinib in combination with standard chemotherapy as part of the AMLSG 11-08 or AMLSG 21-13 trials. Studies were approved by local ethics committees. Written consent was given by all patients for treatment, genetic analysis, and biobanking according to the Declaration of Helsinki.
Baseline characteristics of the 350 patients with t(8;21) and inv(16)-positive AML
| Entity | t(8;21), n = 190 | inv(16), n = 160 | P |
|---|---|---|---|
| Female, n (%) | 82 (43) | 81 (51) | .163 |
| Age, median (range), y | 51 (18-81) | 46 (18-77) | .033 |
| AML history, n (%) | .846 | ||
| De novo | 159 (90) | 133 (90) | |
| Therapy-related | 18 (10) | 14 (10) | |
| Missing data, n | 13 | 13 | |
| WBC, median (range), ×109/L | 8.7 (1.1-117.5) | 24.7 (1.2-222.7) | <.001 |
| Missing data, n | 12 | 14 | |
| Platelet count, median (range), ×109/L | 31 (3-535) | 41 (2-382) | .008 |
| Missing data, n | 12 | 9 | |
| Hemoglobin, median (range), g/dL | 8.8 (3.8-15.5) | 9.4 (3.5-17.0) | .009 |
| Missing data, n | 12 | 14 | |
| Peripheral blood blasts, median (range), % | 37 (0-95) | 35 (0-90) | .749 |
| Missing data, n | 23 | 23 | |
| Bone marrow blasts, median (range), % | 60 (7-100) | 70 (5-100) | .011 |
| Missing data, n | 25 | 32 | |
| LDH, median (range), U/L | 496 (138-10 823) | 489 (94-2794) | .905 |
| Missing data, n | 14 | 17 | |
| Treatment, n (%) | |||
| Intensive treatment | 177 (93) | 155 (97) | .116 |
| Intensive treatment plus dasatinib | 45 (25) | 55 (36) | .06 |
| Autologous HCT | 2 (1) | 6 (4) | .092 |
| Allogenic HCT (CR1) | 18 (9) | 14 (9) | .814 |
CR1, first complete remission; HCT, hematopoietic cell transplantation; LDH, lactate dehydrogenase.
Mutational and cytogenetic screening
High-throughput targeted sequencing was performed on the entire coding region of 230 genes involved in hematologic malignancies including candidate genes identified by our previous collaborative CBF-AML discovery study, in-house databases, and the Cancer Genome Atlas AML data.10,12 A list of all target genes is included in the supplemental Information (Table 1). For sequencing studies, DNA of mononuclear cells from peripheral blood (19%) or bone marrow (81%) was used. Library enrichment was performed using SureSelectXT (Agilent, Santa Clara, CA). Paired-end sequencing (read length: 2× 100 bp) was carried out on a HiSeq 2000 platform (Illumina, San Diego, CA). All sequencing data were analyzed using an in-house computational pipeline. Detailed information on the mutation calling and data curation workflow is provided in the supplemental Information. FLT3 internal tandem duplication were assessed by GeneScan-based fragment-length analysis as previously described.13 The diagnosis of CBF-AML was confirmed by polymerase chain reaction-based detection of RUNX1-RUNX1T1 and CBFB-MYH11 fusion gene transcripts corresponding to t(8;21) and inv(16) aberrations, respectively, and/or by chromosome banding analysis using standard methods.
Statistical analyses
Statistical analyses were performed using R, version 3.6.1, and SPSS, version 25 (IBM, Armonk, NY). Pairwise associations between genes and additional chromosomal aberrations were evaluated by Φ test and adjusted for multiple hypothesis testing by the Benjamini-Hochberg method.14 The Bradley-Terry model, based on pairwise precedence of gene mutations, was used for determination of sequential order of mutation acquisition.15,16 Clonal heterogeneity was assessed based on variant allele fractions (VAF) using Pearson goodness-of-fit test as previously described and corrected for multiple testing.15,17 Association between clinical variables and the end points relapse-free survival (RFS) and overall survival (OS) was analyzed using Cox proportional hazards regression models. Additionally, to assess the effect of genetic variables on these end points, lasso-penalized Cox models were fitted.18 The clinical covariables age, white blood cell (WBC) count, and CBF-AML subtype were included in these models without penalization term. Tuning parameter selection was performed using the Harrell concordance index (C-index), which was computed based on fivefold cross-validation.19-21 The C-index is a probability of concordance between predicted and observed survival, with c = 0.5 for random predictions and c = 1 for a perfectly discriminating model. The linear predictor of a regression model can be interpreted as an individual risk score based on all selected variables. The greater the linear predictor of an individual, the greater that person’s risk of suffering from an early event. To estimate the survival times, we fitted kernel-smoothed Kaplan-Meier (KM) estimators for each penalized model taking into account the distribution of the linear predictors. These estimates were generated for the original data set and in a fivefold cross-validation procedure. Because predictors represent continuous variables, survival curves were derived computing nearest-neighbor estimates of bivariate distribution of survival and low, medium, and high levels of the predictor.22 Penalized regression models do not allow for computation of reliable confidence intervals and P values. As such, the modified KM estimator can be considered a surrogate assistance to data interpretation and visualize the discriminative ability of the models. Therapeutic response and clinical end points were assessed as defined by the 2017 ELN recommendations.4 An effect was considered significant if P ≤ .05.
Results
Genetic heterogeneity of CBF-AML
High-throughput sequencing of the 350 CBF-AML yielded a mean on-target sequencing depth of ∼900×. Overall, 1059 mutations [t(8;21): n = 657; inv(16): n = 402) were detected in 150 of 230 target genes (mutational count here and in the following does not include the defining CBF rearrangement). A total of 103 genes were mutated recurrently (n ≥ 2) (Figure 1A). In 97% of t(8;21) and 94% of inv(16) cases, at least 1 mutation could be identified. On average, AML with t(8;21) harbored significantly more mutations than AML with inv(16) [t(8;21): 3.5 vs inv(16): 2.5; P < .001] (Figure 1B). In t(8;21) AML, 124 different genes were mutated; in inv(16) AML, 95 were mutated. Of the 150 affected genes, mutations in 69 genes were shared in both CBF-AML entities, whereas t(8;21) cases had a significantly higher fraction of private mutations (44% vs 27%, respectively; P = .009) (Figure 1C). With regard to the mutation type, insertions/deletions and nonsense mutations were more prevalent in t(8;21) compared with inv(16) AML (P < .001) (Figure 1D).
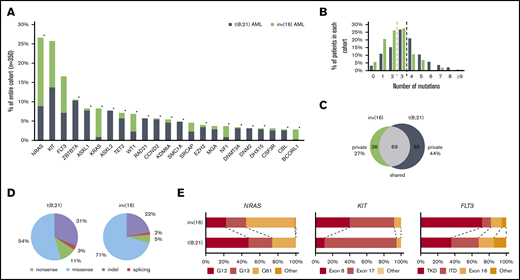
Mutational data of 350 CBF AML patients by high-throughput targeted sequencing. (A) The incidence of recurrently mutated genes (>3%) by CBF-AML entity. Asterisks indicate significant differences between both CBF-AML entities. (B) Bar plot indicating the number of driver events by patient for all patients in each CBF-AML cohort. Dashed lines indicate the median number of mutations in each CBF-AML cohort. (C) Number of privately or commonly mutated genes by CBF-AML entity. (D) Pie charts representing mutation type distribution by CBF-AML cohort. (E) Molecular hotspots. Bar plots indicating proportion of affected mutational hotspots in NRAS, KIT, and FLT3 by CBF-AML cohort.
Mutational data of 350 CBF AML patients by high-throughput targeted sequencing. (A) The incidence of recurrently mutated genes (>3%) by CBF-AML entity. Asterisks indicate significant differences between both CBF-AML entities. (B) Bar plot indicating the number of driver events by patient for all patients in each CBF-AML cohort. Dashed lines indicate the median number of mutations in each CBF-AML cohort. (C) Number of privately or commonly mutated genes by CBF-AML entity. (D) Pie charts representing mutation type distribution by CBF-AML cohort. (E) Molecular hotspots. Bar plots indicating proportion of affected mutational hotspots in NRAS, KIT, and FLT3 by CBF-AML cohort.
Mutations in RTK/RAS signaling were the most common events in both CBF-AML, with the highest incidence in NRAS [27%; t(8;21): 16%; inv(16): 39%; P < .001], KIT [26%; t(8;21): 25%; inv(16): 26%, P = .833], and FLT3 [all aberrations: 17%; t(8;21): 13%; inv(16): 21%, P = .083, internal tandem duplication: t(8;21): 5%, inv(16): 3%; P = .059] (Figure 1A and2). A substantial proportion of these cases had multiple (n ≥ 2) variants of the same gene suggesting distinct cooccurring clones (NRAS, 18%; KIT, 18%; FLT3, 16%). In addition, both entities displayed specific patterns with regard to the affected mutational hotspots. For example, in inv(16) AML, the NRAS codon Q61 was more frequently mutated, whereas t(8;21) AML harbored more NRAS codon G12/G13 aberrations [inv(16), Q61: 54%, G12/13: 45% vs t(8;21), Q61: 26%, G12/13: 74%; P = .005] (Figure 1E). Inv(16) AML was more often associated with alterations in KRAS (16% vs 2%, P < .001) and NF1 (6% vs 2%, P = .025), a negative regulator of RAS signaling. In contrast, t(8;21) AML harbored recurrent mutations in CBL (5%), an E3 ubiquitin-protein ligase involved in KIT degradation, CSF3R (5%), JAK2 (4%), and JAK3 (3%), which were almost absent in inv(16) AML (1%, 1%, 1%, and 0%; respectively).
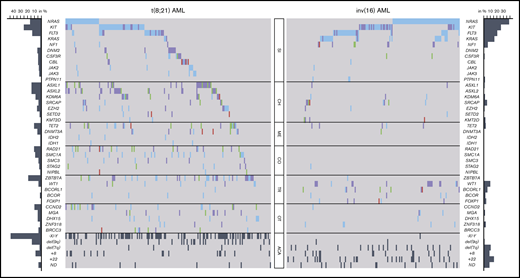
Mutational and cytogenetic landscape of 350 CBF-AML patients. Genes are grouped into functional groups. Each column represents a single patient; each colored box indicates a specified driver mutation. Wild-type cases are illustrated in light gray, missense mutations in blue, indels in purple, nonsense mutations in green, splice site mutations in pink, and additional chromosomal aberrations (ACA) in dark gray. Bar plots indicate the relative frequency of all aberrations in the corresponding CBF-AML cohort. CH, chromatin; CO, cohesin; ME, methylation; OT, other; SI, RTK/RAS signaling; TR, transcription.
Mutational and cytogenetic landscape of 350 CBF-AML patients. Genes are grouped into functional groups. Each column represents a single patient; each colored box indicates a specified driver mutation. Wild-type cases are illustrated in light gray, missense mutations in blue, indels in purple, nonsense mutations in green, splice site mutations in pink, and additional chromosomal aberrations (ACA) in dark gray. Bar plots indicate the relative frequency of all aberrations in the corresponding CBF-AML cohort. CH, chromatin; CO, cohesin; ME, methylation; OT, other; SI, RTK/RAS signaling; TR, transcription.
In t(8;21) AML, a striking enrichment was found for mutations in genes involved in chromatin modification (ASXL1, 14%; ASXL2, 14%; KDM6A, 8%; EZH2, 6%; SETD2, 3%), DNA methylation (TET2, 11%; DNMT3A, 6%), and in genes encoding for members of the cohesin complex (RAD21, 11%; SMC1A, 9%; SMC3, 4%; STAG2, 3%; NIPBL, 1%). In addition, a remarkably high incidence of aberrations was detected in the ZBTB7A gene (19%), a transcription factor guiding hematopoietic lineage fate10,23 ; DHX15 (5%), associated with ribosome biogenesis and spliceosome function10 ; as well as CCND2 (10%) and MGA (5%), both involved in MYC signaling.24,25 Mutations of BRCC3 (4%), an E3 ubiquitin ligase,26 were exclusively found in t(8;21) AML. Furthermore, recurrent loss-of-function mutations occurred in DNM2 (6%; Figure 3A), regulating signaling receptor degradation.27 In general, mutations in genes belonging to the same functional group tended to rarely cooccur, suggesting functional redundancy or synthetic lethality. With respect to cooccurring genetic aberrations, a weak but significant association was observed between NRAS and CCND2 (Figure 3C).
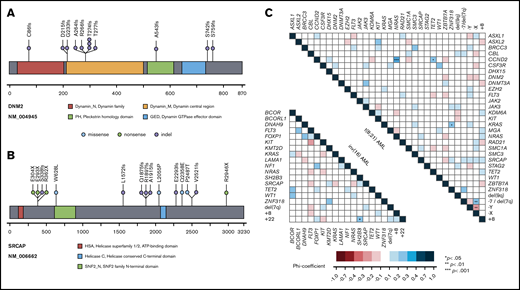
Recurrent mutations in DNM2 and SRCAP and genetic pattern in CBF-AML. Lollipop plots indicating localization of mutations and domain structure of DNM2 (A) and SRCAP (B). Each dot represents a single mutation; the corresponding color is the type of mutation. (C) Pairwise associations among genes and cytogenetic abnormalities found in at least 3% of CBF-AML patients. Associations are colored by φ coefficient. P values were adjusted for multiple testing using Benjamini-Hochberg method. Gene pairs that cooccurred more frequently are indicated by blue colors; gene pairs that cooccurred seldom by red colors. Significant associations are marked by asterisks depending on the level of significance.
Recurrent mutations in DNM2 and SRCAP and genetic pattern in CBF-AML. Lollipop plots indicating localization of mutations and domain structure of DNM2 (A) and SRCAP (B). Each dot represents a single mutation; the corresponding color is the type of mutation. (C) Pairwise associations among genes and cytogenetic abnormalities found in at least 3% of CBF-AML patients. Associations are colored by φ coefficient. P values were adjusted for multiple testing using Benjamini-Hochberg method. Gene pairs that cooccurred more frequently are indicated by blue colors; gene pairs that cooccurred seldom by red colors. Significant associations are marked by asterisks depending on the level of significance.
Of note, inv(16) AML showed a different and less complex genetic landscape (supplemental Figure 2). Apart from frequent alterations in RTK/RAS signaling genes, representing the overall predominantly affected pathway, mutations in other functional groups were less common compared with t(8;21) AML. Aberrations of genes involved in chromatin modification were rare in inv(16) AML, with mutations of the ASXL gene family (ASXL1, 1%; ASXL2, 0%) being almost or completely absent. The same applied to mutations belonging to the cohesin complex that were absent in all but 1 case (RAD21, 0%; SMC1A, 0%; SMC3, 0%; STAG2, 1%; Figure 2). Frequent mutations were detected in the transcription factor WT1 (10%) and the transcriptional corepressor BCORL1 (6%). Interestingly, both t(8;21) and inv(16) AML shared recurrent loss-of-function aberrations of SRCAP (4% vs 5%, respectively; Figure 3B) that so far have not been described in CBF-AML. SRCAP encodes the core component of chromatin-remodeling Snf2-related CREBBP activator protein complex.28
In addition to remarkable differences in the mutational landscape between t(8;21) and inv(16) AML, we also identified distinct patterns with regard to secondary chromosomal aberrations. With exception of trisomy 8, which was found with similar frequency in both subgroups, a striking diversity was observed: whereas deletion of the long arm of chromosome 9 and loss of a sex chromosome were significantly associated with t(8;21) AML (P < .001 and P < .001, respectively), del(7q) and trisomy 22 were correlated with inv(16) AML (P = .002 and P < .001, respectively) (Figure 2; supplemental Table 3).
Clonal architecture of CBF-AML
Using the Bradley-Terry model, the sequential order of mutation acquisition and thus the clonal hierarchy of CBF-AML was reconstructed.15,16 To enhance robustness, only genes with a minimum number of 6 [inv(16) AML] or 7 [t(8;21) AML] interactions (ie, gene cooccurrences) were included in the model. In t(8;21) AML, mutations in genes encoding for proteins regulating DNA methylation usually occurred earlier, as did mutations of transcription factors (Figure 4A). These were followed by aberrations of genes involved in chromatin modification and genes belonging to the cohesin complex. With exception of JAK2 and CBL, mutations in the RTK/RAS signaling pathway were late events in t(8;21) leukemogenesis and often arose in multiple distinct clones. In inv(16) AML, mutations in the histone modifier SRCAP as well as the transcription factors FOXP1 and BCORL1 were acquired at earlier leukemic stages, whereas aberrations in FLT3, NRAS, NF1, KIT, KRAS, as well as in WT1 were relatively late events (Figure 4B). In sum, both CBF-AML subtypes often followed similar trajectories with aberrations affecting transcription and differentiation preceding mutations impairing proliferation (Figure 4C).
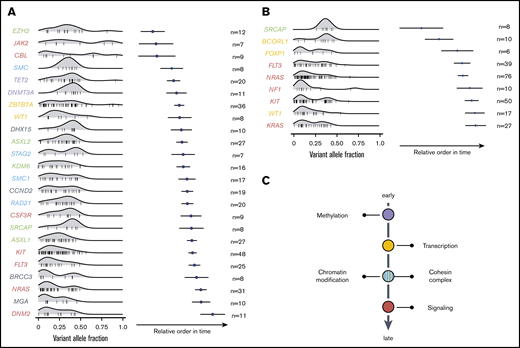
Sequential order of mutation acquisition in t(8;21) AML and inv(16) AML. (A) t(8;21) AML. (B) inv(16) AML. Bradley-Terry plot based on pairwise precedences of gene mutations. Only samples with ≥2 mutations were included in the model. The x-axis reflects the relative order of acquisition. Black dots indicate the point estimate; black lines indicate 95% confidence intervals of gene ordering in time. Genes are positioned along the y-axis on the basis of their relative order of occurrence. The variant allele frequency was adapted for sex and chromosomal aberrations. (C) Schematic illustration of mutational trajectory in CBF-AML leukemogenesis.
Sequential order of mutation acquisition in t(8;21) AML and inv(16) AML. (A) t(8;21) AML. (B) inv(16) AML. Bradley-Terry plot based on pairwise precedences of gene mutations. Only samples with ≥2 mutations were included in the model. The x-axis reflects the relative order of acquisition. Black dots indicate the point estimate; black lines indicate 95% confidence intervals of gene ordering in time. Genes are positioned along the y-axis on the basis of their relative order of occurrence. The variant allele frequency was adapted for sex and chromosomal aberrations. (C) Schematic illustration of mutational trajectory in CBF-AML leukemogenesis.
We next sought to delineate the clonal heterogeneity of CBF-AML based on differences in the variant allele frequencies as previously described.15 Using this approach, we were able to reconstruct the definite phylogenetic tree in some cases (Figure 5B,C,E,F). However, in the majority of patients, the clonal architecture could not unambiguously be resolved because of low VAF and multiple possible combinations (Figure 5A,D). In addition, we compared patients with evidence of clonal heterogeneity to patients with a single clone (homogeneity). Clonal heterogeneity was defined as presence of multiple mutations with significantly different VAFs by Pearson goodness-of-fit test and homogeneity as multiple mutations with similar VAFs or only with a single mutation. By that, we found a significantly higher fraction of cases with clonal heterogeneity in t(8;21) AML compared with inv(16) (80% vs 65%, P = .002), suggesting a higher clonal diversity in t(8;21) AML (Figure 5G).
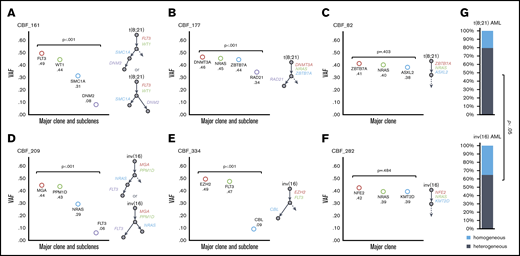
Clonal heterogeneity in CBF AML. Variant allele frequency (VAF) of driver mutations identified in 6 illustrative patients. t(8;21) AML patients (A-C); inv(16) AML patients (D-F). Colored circles indicate the observed allele frequency. Patients in panels A, B, D, and E show statistical evidence for clonal heterogeneity. The definite phylogenetic tree was reconstructed in panels B and E with 1 major clone and 1 subclone, whereas in panels A and D, the clonal architecture could not unambiguously be resolved. (C,F) VAF of driver mutations was similar suggesting the existence of only one major clone. (G) The proportion of patients in each cohort with evidence of several clones (heterogeneous, gray color) or only a single clone (homogeneous, blue color) is indicated.
Clonal heterogeneity in CBF AML. Variant allele frequency (VAF) of driver mutations identified in 6 illustrative patients. t(8;21) AML patients (A-C); inv(16) AML patients (D-F). Colored circles indicate the observed allele frequency. Patients in panels A, B, D, and E show statistical evidence for clonal heterogeneity. The definite phylogenetic tree was reconstructed in panels B and E with 1 major clone and 1 subclone, whereas in panels A and D, the clonal architecture could not unambiguously be resolved. (C,F) VAF of driver mutations was similar suggesting the existence of only one major clone. (G) The proportion of patients in each cohort with evidence of several clones (heterogeneous, gray color) or only a single clone (homogeneous, blue color) is indicated.
Clinical outcome of CBF-AML
The genetic heterogeneity of both CBF-AML entities was also reflected by differences in their clinical behavior. Patients with t(8;21) AML were older and in median had lower levels of WBC, platelets, and hemoglobin counts, as well as lower bone marrow blasts compared with inv(16) AML (Table 1).
Next, we assessed the impact of clinical and genetic characteristics on outcome. Only patients who received intensive treatment (n = 332) were included in the analysis. The median follow-up time for the whole patient cohort was 4.3 years (95% confidence interval, 3.8-4.8 years). In general, response to induction therapy was high, with no difference in complete remission rates [t(8;21), 90.5%; inv(16), 92%]. In multivariable Cox regression for OS, the only significant variable associated with worse OS in both CBF-AML groups was age, whereas platelets, hemoglobin, WBC count, gender, and therapy-related AML did not influence OS (supplemental Tables 11 and 12). With regard to RFS, WBC count and therapy-related AML were associated with a worse prognosis in inv(16) but not in t(8;21) AML (supplemental Tables 9 and 10).
Next, we sought to establish a more complex and unbiased statistical model taking into account a multitude of genetic and clinical factors. Because of the quantity of covariables and the number of patients, we used a lasso-penalized Cox proportional hazards regression model. First, we calculated models for each CBF-AML cohort separately, introducing clinical features (age, WBC count), recurrent chromosomal aberrations (+8, −Y, −X, +22), gene mutations with an incidence of ≥4%, and the presence of clonal heterogeneity as covariables, yet failed to gain a robust risk prediction model. To enhance robustness, we next combined all patients to a single CBF-AML cohort. To estimate the bivariate distribution of survival times and levels of the predictor of the penalized models, we computed a kernel-smoothed KM estimator using the linear predictor. The modified KM estimator predicts prognostic groups based on outcome predictor levels and reflects the discriminatory properties of the model. Using this approach, we were able to compute a model that nicely predicts prognosis (Figure 6; supplemental Figures 28 and 29). With respect to OS, t(8;21) AML was associated with an increased risk of death (Figure 6A). In line, in univariate analysis, OS of patients with t(8;21) AML was significantly inferior compared with inv(16) AML cases (P = .031) (supplemental Figure 6). In addition, age and WBC count were associated with a worse prognosis. The genetic aberration with the strongest negative impact on prognosis was trisomy 8, which was also supported by univariate analysis (supplemental Figure 10). Other genetic factors associated with a worse clinical outcome, yet to a slighter extent, were mutations in FLT3 and KIT exon 17, but not KIT in general. In univariate analysis, KIT mutations were not significantly affecting OS, even when stratified by mutational hotspot, VAF, or treatment with dasatinib (supplemental Figure 8). In contrast, mutations in NRAS and particularly WT1 were associated with improved outcome (Figure 6A; supplemental Figures 13 and 14). Surprisingly, the presence of clonal heterogeneity was associated with a more favorable prognosis in our model. Consistently, in univariate analysis, there was a trend toward an inferior OS in the homogeneous compared with the heterogeneous group (P = .054) (supplemental Figure 18). We did not find any specific genotype enriched in the homogeneous cases nor any association with clinical features or therapy that could explain this phenomenon. Of note, the number of mutations/aberrations did not inform prognosis (supplemental Figures 19 and 20). In regard to RFS, only t(8;21), age, and WBC count were selected by our model and were associated with inferior outcome (Figure 6D-F). Yet, genetic information did not add to predict RFS.
![Survival lasso models and curves according to clinical features, mutational status, and chromosomal aberrations in the entire CBF-AML cohort. Optimized models for OS (A) and RFS (D) with a hazard ratio (HR) <1.0 indicating a lower risk and a HR >1.0 a higher risk of death and relapse, respectively. (A) The OS model has a cross-validation C-index of 0.63; 295 patients were included in the analysis [eg, patients with t(8;21) AML or trisomy 8 had the highest risk of death compared with patients with evidence of clonal heterogeneity or WT1 mutations who had a more favorable prognosis]. (D) The RFS model has a cross-validation C-index of 0.61; 261 patients were included in the analysis. KM estimates for OS (B,C) and RFS (E,F) given levels of competing predictors were generated using the original data set (B,E: apparent estimates) and a fivefold cross-validation (C,F). Because predictors represent continuous variables (eg, linear predictor of Cox models), survival curves were derived computing nearest-neighbor estimate of bivariate distribution of survival times and predictor levels. For illustration purposes, survival curves for low, medium, and high levels of the predictor were derived from the modified KM estimator, determined as the survival curve estimate for the neighborhood of the smallest, median, and largest values of the predictor, respectively. The modified KM estimator thereby reflects the discriminatory properties of the model.](https://ash.silverchair-cdn.com/ash/content_public/journal/bloodadvances/4/24/10.1182_bloodadvances.2020002673/1/m_advancesadv2020002673f6.png?Expires=1763489519&Signature=w1mElRO4k6MXPu4JJBs-FGQu5E9ruL2y74LvousbERxlJMlcUhcjUYMnxSkYtbOedcbX5~77nJWcCAYZHt0A4PwNb2-LydxmZLg0JK-PS4Ict~TPgWwIdUjMxRwI9jrCiLtXXiPQ5sd2rB5Lz-B2UUQNXvjxayWkGXi5IehUIRHCt1JJJjtB07WaZ9Sj54K0wc4uoz67GKdNG~u9BAXfIWp4Y6nDyNGHGUUxNy1s-CNsPQOe4tvnzrPIz0vd20xQWGloYuVLTd5c8rauCfORhHBb3SkDmv2HmG1LKoi7z9bM-pHm42q9vbEJQMlbrE5xWVlK06FlJ9Icy9mn189gZA__&Key-Pair-Id=APKAIE5G5CRDK6RD3PGA)
Survival lasso models and curves according to clinical features, mutational status, and chromosomal aberrations in the entire CBF-AML cohort. Optimized models for OS (A) and RFS (D) with a hazard ratio (HR) <1.0 indicating a lower risk and a HR >1.0 a higher risk of death and relapse, respectively. (A) The OS model has a cross-validation C-index of 0.63; 295 patients were included in the analysis [eg, patients with t(8;21) AML or trisomy 8 had the highest risk of death compared with patients with evidence of clonal heterogeneity or WT1 mutations who had a more favorable prognosis]. (D) The RFS model has a cross-validation C-index of 0.61; 261 patients were included in the analysis. KM estimates for OS (B,C) and RFS (E,F) given levels of competing predictors were generated using the original data set (B,E: apparent estimates) and a fivefold cross-validation (C,F). Because predictors represent continuous variables (eg, linear predictor of Cox models), survival curves were derived computing nearest-neighbor estimate of bivariate distribution of survival times and predictor levels. For illustration purposes, survival curves for low, medium, and high levels of the predictor were derived from the modified KM estimator, determined as the survival curve estimate for the neighborhood of the smallest, median, and largest values of the predictor, respectively. The modified KM estimator thereby reflects the discriminatory properties of the model.
Survival lasso models and curves according to clinical features, mutational status, and chromosomal aberrations in the entire CBF-AML cohort. Optimized models for OS (A) and RFS (D) with a hazard ratio (HR) <1.0 indicating a lower risk and a HR >1.0 a higher risk of death and relapse, respectively. (A) The OS model has a cross-validation C-index of 0.63; 295 patients were included in the analysis [eg, patients with t(8;21) AML or trisomy 8 had the highest risk of death compared with patients with evidence of clonal heterogeneity or WT1 mutations who had a more favorable prognosis]. (D) The RFS model has a cross-validation C-index of 0.61; 261 patients were included in the analysis. KM estimates for OS (B,C) and RFS (E,F) given levels of competing predictors were generated using the original data set (B,E: apparent estimates) and a fivefold cross-validation (C,F). Because predictors represent continuous variables (eg, linear predictor of Cox models), survival curves were derived computing nearest-neighbor estimate of bivariate distribution of survival times and predictor levels. For illustration purposes, survival curves for low, medium, and high levels of the predictor were derived from the modified KM estimator, determined as the survival curve estimate for the neighborhood of the smallest, median, and largest values of the predictor, respectively. The modified KM estimator thereby reflects the discriminatory properties of the model.
We next categorized genes to functional groups based on their molecular function (methylation, chromatin, cohesin, signaling, transcription; Figure 2). Aberrations of the methylation group had the strongest negative prognostic impact (Figure 7A-C). This effect was mostly attributed to mutations in DNMT3A und TET2 that both were associated with a significantly worse prognosis in univariate analysis (P = .012 and P = .019, respectively; supplemental Figures 15 and 16). DNMT3A mutations almost exclusively occurred in t(8;21) AML. Additionally, mutations of the signaling and chromatin functional groups were also negatively influencing outcome to a slighter extent (Figure 7A). With regard to RFS, apart from t(8;21) AML, WBC count, and age, only mutations within the chromatin group informed prognosis and conferred a higher relapse risk (Figure 7D-F).
![Survival lasso models and curves according to clinical features, functional groups, and chromosomal aberrations in the CBF-AML cohort. Optimized models for OS (A) and RFS (D) with a HR <1.0 indicating a lower risk and a HR >1.0 a higher risk of death and relapse, respectively. (A) The OS model has a cross-validation C-index of 0.65; 279 patients were included in the analysis [eg, patients with t(8;21) AML or mutations of DNA methylation genes had the highest risk of death compared with patients with evidence of clonal heterogeneity]. (D) The RFS model has a cross-validation C-index of 0.62; 261 patients were included in the analysis. KM estimates for OS (B,C) and RFS (E,F) given levels of competing predictors were generated using the original data set (B,E: apparent estimates) and a fivefold cross-validation (C,F). Because predictors represent continuous variables (eg, linear predictor of Cox models), survival curves were derived computing nearest-neighbor estimate of bivariate distribution of survival times and predictor levels. For illustration purposes, survival curves for low, medium, and high levels of the predictor were derived from the modified KM estimator, determined as the survival curve estimate for the neighborhood of the smallest, median, and largest values of the predictor, respectively. The modified KM estimator thereby reflects the discriminatory properties of the model.](https://ash.silverchair-cdn.com/ash/content_public/journal/bloodadvances/4/24/10.1182_bloodadvances.2020002673/1/m_advancesadv2020002673f7.png?Expires=1763489519&Signature=y7Yxz8FW-bhkuMEwC9HFQpcAo2PPkumF3Cdv9RI1Wqn5c2ERex5T9H0z4S1VwaRO5bRqWz4LY7PcaoaVsMra1PcAZODFvS5P~pT-UjQvUGle5N85CWPH6DAYWcsOtVcBhkDHnPvfy54btx29EXxF0-ChFx4~fTx721Z--aeTpMIzm-D~F-t3ZjAf-VKvlWlE6GrNwrWzaYFjIIKqwpFdn8FAorhSWfX3b36KSh0vWifCRXGy~QROaF-I72ogPummERjfFCUdX8Fj5~zD4ULHwTPykVS~0MMuoFv6NxUh7PZZbjp3g~Xioc-1Vc3by3ot20S-5I0vG2uDHLaXa0FZBw__&Key-Pair-Id=APKAIE5G5CRDK6RD3PGA)
Survival lasso models and curves according to clinical features, functional groups, and chromosomal aberrations in the CBF-AML cohort. Optimized models for OS (A) and RFS (D) with a HR <1.0 indicating a lower risk and a HR >1.0 a higher risk of death and relapse, respectively. (A) The OS model has a cross-validation C-index of 0.65; 279 patients were included in the analysis [eg, patients with t(8;21) AML or mutations of DNA methylation genes had the highest risk of death compared with patients with evidence of clonal heterogeneity]. (D) The RFS model has a cross-validation C-index of 0.62; 261 patients were included in the analysis. KM estimates for OS (B,C) and RFS (E,F) given levels of competing predictors were generated using the original data set (B,E: apparent estimates) and a fivefold cross-validation (C,F). Because predictors represent continuous variables (eg, linear predictor of Cox models), survival curves were derived computing nearest-neighbor estimate of bivariate distribution of survival times and predictor levels. For illustration purposes, survival curves for low, medium, and high levels of the predictor were derived from the modified KM estimator, determined as the survival curve estimate for the neighborhood of the smallest, median, and largest values of the predictor, respectively. The modified KM estimator thereby reflects the discriminatory properties of the model.
Survival lasso models and curves according to clinical features, functional groups, and chromosomal aberrations in the CBF-AML cohort. Optimized models for OS (A) and RFS (D) with a HR <1.0 indicating a lower risk and a HR >1.0 a higher risk of death and relapse, respectively. (A) The OS model has a cross-validation C-index of 0.65; 279 patients were included in the analysis [eg, patients with t(8;21) AML or mutations of DNA methylation genes had the highest risk of death compared with patients with evidence of clonal heterogeneity]. (D) The RFS model has a cross-validation C-index of 0.62; 261 patients were included in the analysis. KM estimates for OS (B,C) and RFS (E,F) given levels of competing predictors were generated using the original data set (B,E: apparent estimates) and a fivefold cross-validation (C,F). Because predictors represent continuous variables (eg, linear predictor of Cox models), survival curves were derived computing nearest-neighbor estimate of bivariate distribution of survival times and predictor levels. For illustration purposes, survival curves for low, medium, and high levels of the predictor were derived from the modified KM estimator, determined as the survival curve estimate for the neighborhood of the smallest, median, and largest values of the predictor, respectively. The modified KM estimator thereby reflects the discriminatory properties of the model.
Discussion
AML with t(8;21) and AML with inv(16) are commonly referred to as 1 subentity given that both arise from preceding abnormal fusion proteins involving the CBF transcriptional complex. However, recent genomic studies revealed novel insights into the underlying disease mechanism highlighting considerable heterogeneity.10,29,30 Most previous studies have focused on 1 CBF-AML subtype, smaller or more heterogeneous cohorts including pediatric and adult cases, or only investigated a limited set of candidate genes hampering a comprehensive comparison of both subtypes.10,11,29,31 In our study, we analyzed a large and homogeneous cohort of adult patients with t(8;21) (n = 190) and inv(16) AML (n = 160) using targeted DNA sequencing with a 230-gene panel.
In general, t(8;21) AML harbored significantly more comutations compared with inv(16) AML. This was also true in a previous collaborative study.10 A possible hypothesis could be that the CBFB-MYH11 fusion protein acts more leukemogenic in the presence of only very few comutations, or an increase in additional aberrations does not provide any evolutionary advantage, whereas RUNX1-RUNX1T1 requires a higher number of cooperating alterations to promote leukemogenesis.
The genetic discrepancy between the 2 CBF-AML entities became apparent when segregating all recurrently mutated genes into functional subgroups categorized as tyrosine kinase signaling, chromatin modification, DNA methylation, cohesin complex, and transcription (Figure 2). The only major mutational overlap occurred in RTK/RAS signaling genes, which was mostly due to mutations in NRAS, KIT, and FLT3 that were frequent in both CBF-AML entities. Other signaling genes that were involved differed significantly (Figure 2). Interestingly, we found frequent loss-of-function mutations in DNM2 in 6% of t(8;21) AML. The best characterized function of DNM2, a highly conserved GTPase, is clathrin-dependent endocytosis, a key step in regulation of signaling by degradation or recycling of signal proteins.32 In murine model, DNM2 knockout in megakaryocytic lineages decreased thrombopoietin receptor (MPL) endocytosis. This resulted in unrestrained receptor signaling through constitutive JAK2 activation and ultimately in expansion of hematopoietic stem and progenitor cells.27 This observation could provide a functional explanation for its involvement in t(8;21) AML pathogenesis, which has been consistently linked to RTK/RAS pathway activation.
Whereas in t(8;21) AML, a significant enrichment for mutations in genes involved in chromatin modification, DNA methylation, and the cohesin complex were found, in inv(16) AML, mutations in these functional subgroups were rare or almost absent (Figure 2). These results are supported by previous studies.10,11,29 Overall, findings from our and other groups suggest that inv(16) AML is largely driven by alterations in RTK/RAS signaling, in contrast to t(8;21) AML, which is more complex and characterized by interactions of multiple genes within different functional pathways. Of note, with the exception of NRAS/CCND2 and –X/del(7q) in t(8;21) AML, we were not able to identify any relevant gene–gene/gene–karyotype interaction precluding further subdivision of CBF-AML into genetic clusters.
Recently, the pathogenic role of several genes in CBF-AML, in particular t(8;21) AML, has been described (eg, ASXL2, CCND2, DHX15, ZBTB7A).10,23,24,33 In addition, we could show that BRCC3 mutations lead to altered ubiquitination of its substrates and cooperate with RUNX1-RUNX1T1 to induce AML and to sensitize leukemic cells to cytotoxic chemotherapy.34 In our cohort, mutations of BRCC3, encoding for a Lysine 63-specific deubiquitinating enzyme involved in interferon signaling and DNA damage repair, were exclusively found in t(8;21) AML (4%) and were associated with a favorable outcome (supplemental Figures 17). Furthermore, we observed recurrent mainly truncating mutations in SRCAP in 5% of CBF-AML (Figures 1 and 3B). SRCAP encodes a chromatin remodeling protein, which catalyzes the incorporation of H2AZ histones into nucleosomes.35 SRCAP mutations have been linked to clonal hematopoiesis in the context of cellular stressors, particularly occurring in patients who previously received chemotherapy.35 This is in line with findings that SRCAP is involved in double-strand break repair resulting from genotoxic stress.28 In contrary, SRCAP mutations were not associated with therapy-related CBF-AML following exposure to cytotoxic treatment. In AML per se, SRCAP aberrations are rather rare events, occurring in only 1% of patients.12 Taken together, these findings suggest an alternate mechanism of SRCAP to cooperate with both RUNX1/RUNX1T1 and CBFB/MYH11 proteins.
In our cohort, in both CBF-AML subtypes mutations altering transcription and differentiation usually occurred in earlier clones, whereas mutations in RTK/RAS signaling typically represent late events. This clonal evolutionary scheme seems to be broadly applicable to AML because it has not only been reported for CBF-AML, but also for other AML entities.11,36 The higher mutational burden seen in t(8;21) AML was also reflected by higher numbers of distinct leukemic clones compared with inv(16) AML. Interestingly, clonal heterogeneity was associated with a more favorable prognosis as compared with “homogeneous” cases. This seems somewhat counterintuitive because, for example, in MDS, a higher mutational burden has been linked to particularly dismal outcome.15 A possible hypothesis is that in CBF-AML in case of homogeneity a major, evolutionary well-adapted clone is driving the disease, whereas in the case of heterogeneity, several minor clones exist in parallel while competing for clonal survival, making them ultimately more susceptible to eradication. In line with this theory, we found a significantly higher median VAF of mutations in case of homogeneity compared with heterogeneity (homogeneous: 0.39 vs heterogeneous: 0.28; P = .002). However, a limitation of this model is that clonality data were statistically inferred from bulk sequencing. Therefore, sequencing approaches at single-cell resolution are needed to further investigate this hypothesis.
The genotypic heterogeneity of CBF-AML was reflected by differences in prognosis with inferior OS of t(8;21) AML, which is supported by some but not all studies.2,3,29 To account for the enormous amount of data generated by high-throughput targeted sequencing at a given cohort size, we computed a lasso-penalized regression model for the combined CBF-AML cohort. With regard to functional classes, mutations in the DNA methylation functional group had the strongest negative impact on prognosis and were mostly related to DNMT3A and TET2. In addition, our model indicates a poor prognostic impact of trisomy 8 as well as mutations in FLT3 and KIT exon 17, but not KIT in general. A poor prognosis for KIT mutations (especially codon D816V) has been shown in some but not all studies, particularly in t(8;21) AML.9,11,37,38 It would be of particular interest whether the addition of FLT3 inhibitors can mitigate the inferior outcome of FLT3 mutations in CBF-AML. Interestingly, mutations in WT1 and NRAS conferred favorable prognosis in our CBF-AML cohort. Consistent with this, AML NRAS mutations have been shown to confer sensitivity to higher doses of cytarabine, eventually leading to a decreased relapse probability.39
In summary, in this comprehensive study of 350 adult CBF-AML patients, we provide novel aspects of the molecular landscape of CBF-AML and reveal fundamental differences in cooperating aberrations and clonal architecture of t(8;21) and inv(16) AML. Data from genetic studies suggest an inferior prognosis for trisomy 8, as well as FLT3 and KIT exon 17 mutations, whereas NRAS and WT1 mutations confer superior outcome. Furthermore, DNA methylation genes may provide new important prognostic information. Single-cell sequencing studies will allow further elucidation of the clonal composition of CBF-AML and their clinical impact.
Presented in part in abstract form at the 59th annual meeting of the American Society of Hematology, Atlanta, GA, 10 December 2017.
Mutational data are available as .xlsx file as part of the supplement.
Acknowledgments
The authors greatly acknowledge the members of the German-Austrian AML Study Group (AMLSG) for providing patient samples and clinical information.
N.J. is a fellow of the Clinician Scientist Program of the Medical Faculty/University of Ulm.
Authorship
Contribution: N.J., H.D., L.B., and K.D. designed the study and wrote the manuscript; N.J., A.D., S.C., and J.H. performed molecular analyses and analyzed data; N.J., T.T., E.S., D.W., and A.B. performed statistical analyses; N.J., A.D., S.C., E.P., A.C., J.H., D.W., A.S., K.G., T.S., M..L, H.A.H., E.K., R.F.S., V.I.G., P.P., F.G.R., M.H., F.T., A.G., A.B., H..D, L.B., and K.D. provided patient samples and clinical information.
Conflict-of-interest disclosure: The authors declare no competing financial interests.
Correspondence: Konstanze Döhner, Department of Internal Medicine III, University Hospital of Ulm, Albert-Einstein-Allee 23, D-89081 Ulm, Germany; e-mail: konstanze.doehner@uniklinik-ulm.de.

