

Key Points
rhIGFBP7 activates ATRA-driven elimination of leukemia stem/progenitor cells in non-APL AML with high RARA expression.
rhIGFBP7 treatment of non-APL AML cells reduces GFI1 expression, leading to increased sensitivity to ATRA.

Abstract
Treatment of acute promyelocytic leukemia (APL) with all-trans retinoic acid (ATRA) in combination with low doses of arsenic trioxide or chemotherapy leads to exceptionally high cure rates (>90%). ATRA forces APL cells into differentiation and cell death. Unfortunately, ATRA-based therapy has not been effective among any other acute myeloid leukemia (AML) subtype, and long-term survival rates remain unacceptably low; only 30% of AML patients survive 5 years after diagnosis. Here, we identified insulin-like growth factor binding protein 7 (IGFBP7) as part of ATRA-induced responses in APL cells. Most importantly, we observed that addition of recombinant human IGFBP7 (rhIGFBP7) increased ATRA-driven responses in a subset of non-APL AML samples: those with high RARA expression. In nonpromyelocytic AML, rhIGFBP7 treatment induced a transcriptional program that sensitized AML cells for ATRA-induced differentiation, cell death, and inhibition of leukemic stem/progenitor cell survival. Furthermore, the engraftment of primary AML in mice was significantly reduced following treatment with the combination of rhIGFBP7 and ATRA. Mechanistically, we showed that the synergism of ATRA and rhIGFBP7 is due, at least in part, to reduction of the transcription factor GFI1. Together, these results suggest a potential clinical utility of IGFBP7 and ATRA combination treatment to eliminate primary AML (leukemic stem/progenitor) cells and reduce relapse in AML patients.
Introduction
Acute myeloid leukemia (AML) is a devastating disease that is characterized by transcriptional dysregulation that results in a block in differentiation and increased malignant self-renewal. Next to genetic aberrancies, epigenetic modifications and transcriptional regulators play an essential role in the generation of diversity in the transcriptional landscape of AML cells related to their potential to respond to therapy. Chemotherapy has been the standard treatment for AML patients for decades, unfortunately with low success rates. The 5-year overall survival rate for AML patients is <40%,1 and these cure rates will not significantly improve unless efficient and well-tolerated alternative treatment strategies are developed.
Currently, acute promyelocytic leukemia (APL) is the only AML subtype that is successfully treated with all-trans retinoic acid (ATRA) and low doses of arsenic trioxide or chemotherapy, resulting in cure rates >90%.2,3 Expression of the fusion protein PML-RARα in APL cells serves as a dominant negative inhibitor for retinoic acid receptor (RAR) signaling. Addition of ATRA induces degradation of the PML-RARα fusion protein, leading to dissociation of corepressors and histone deacetylases (HDACs), allowing epigenetic changes and reactivation of transcription facilitating neutrophil differentiation and cell death.4-7 Several studies implied that the mere induction of differentiation is insufficient to cure APL, and the success of ATRA therapy for APL is likely due, in part, to activation of p53 by ATRA-induced degradation of the PML-RARα fusion protein.8,9 Although the success of ATRA-based therapy has been demonstrated for APL patients, it has not proven effective for patients with other AML subtypes.10-17 To unlock the therapeutic potential of ATRA-based therapy for non-APL AML patients, identification of novel therapeutic strategies regulating gene-expression programs associated with ATRA susceptibility are key.
Recently, several in vitro studies showed that ATRA can drive leukemia cells into differentiation and/or apoptosis in a subset of AML patients with a mutation in NPM118,19 or IDH1.20 We found that AML with overexpression of EVI-1 is susceptible to ATRA-induced differentiation and cell death.21 Moreover, several studies suggest that resistance to ATRA therapy in non-APL AML is due to epigenetic and transcriptional deregulation.22-24 The lysine-specific demethylase LSD1 (KDM1A) is overexpressed in several tumors and is required for maintenance of AML.24,25 Inhibition of the nonenzymatic activities of LSD1 by tranylcypromine (TCP) activates the ATRA-driven differentiation pathway in non-APL AML cells. Interestingly, the histone 3 lysine 4 demethylase activity of LSD1 was not involved in this activation.24,26,27 LSD1 interacts with growth factor independent 1 (GFI1), and the activity of LSD1 is dependent on this interaction.27-29 Multiple distinct LSD1 inhibitors disrupt the interaction of LSD1 with GFI1, destabilizing GFI1 on chromatin and abrogating its repressive activity. The subsequent activation of enhancers following disruption of the GFI1 repressor complex is believed to be dependent on the presence of SPI1 and CEBPα at GFI1-bound loci.29 Furthermore, the lysine acetyltransferase GCN5 contributes to ATRA resistance in non-APL AML via aberrant acetylation of histone 3 lysine 9 and maintenance of leukemic stem cell (LSC)–associated genes. Inhibition of GCN5 also unlocks an ATRA-driven therapeutic response.23 Inhibition of LSD1 and GCN5 induce sensitivity to ATRA only in part of the non-APL AML cases.
We previously demonstrated that insulin-like growth factor binding protein 7 (IGFBP7), a tumor suppressor and negative regulator of IGF1 receptor (IGF1R) activity, induces differentiation and apoptosis in primary AML cells and sensitizes AML cells for chemotherapy-induced cell death.30,31 Because IGF1R inhibitors can eliminate therapy-resistant cancer cells by modifying their chromatin state,32 and IGFBP7 is highly expressed in APL,33 we hypothesized that IGFBP7 may be part of the differentiation pathway in APL and may have the capacity to modify the epigenetic state of non-APL AML cells, resulting in susceptibility to ATRA-induced differentiation and cell death. Here, we show that increasing IGFBP7 expression or treatment of non-APL AML cells with recombinant human IGFBP7 (rhIGFBP7) could promote ATRA-induced responses, including differentiation, cell death, and inhibition of leukemic stem/progenitor cell survival. We also show that combination treatment with rhIGFBP7 and ATRA significantly reduced the engraftment of primary AML cells in vivo.
Methods
Cell lines and primary cells
HL60, KG1a, THP1, and HEK293T cells were purchased from the American Type Culture Collection; NB4 and OCI-AML3 cells were from the German Collection of Microorganisms and Cell Cultures. Human AML material was obtained from patients hospitalized at Amsterdam UMC, location VUmc at the time of diagnosis, according to HOVON AML protocols. Normal bone marrow (NBM) was obtained from otherwise healthy patients undergoing cardiothoracic surgery. Informed consent was obtained for every patient sample used, procedures were approved by the ethical committee of Amsterdam UMC, and all experiments were conducted in accordance with the Declaration of Helsinki. Culture conditions are described in supplemental Methods.
Lentiviral transduction
The lentiviral plasmid expressing human IGFBP7 (IGFBP7-OE) was generated as described previously.30 For IGFBP7 knockdown, pLKO1 short hairpin RNA #1 (shRNA#1; TRCN0000077943) and shRNA#2 (TRCN0000077945) were used. The lentiviral plasmid pLenti6.2/V5-DEST expressing GFI1-YFP (GFI1-OE), as well as the plasmids to knockdown GFI1, GFI1-shRNA65-pLKO.1-Venus, and GFI1-shRNA68-pLKO.1-Venus, were a gift from B. A. van der Reijden.
AML cells with enhanced or decreased levels of IGFBP7 or GFI1 were generated using lentiviral transduction. A total of 12 µg of plasmid DNA mix (ie, 1 of the above-described vectors, 5 µg of pRRE, 3 µg of pMD2G, and 2.5 µg of pRSV-REV) was mixed with 150 mM calcium chloride in HEPES-buffered saline and added to HEK293T cells seeded in medium containing 25 µM chloroquine. After 72 to 96 hours, medium was harvested. Retronectin (Takara Bio)–coated plates were incubated with virus and centrifuged at 3000 rpm and 32°C for 2 hours. AML cells were transduced in the presence of 8 µg/mL polybrene (Sigma-Aldrich). For IGFBP7 overexpression and knockdown, NB4 cells were selected with 1 µg/mL puromycin (Sigma-Aldrich) for 7 days. For GFI1 overexpression, HL60 cells were selected with 6 µg/mL blasticidin (Invitrogen) for 21 days, or primary AML cells were transduced in Iscove modified Dulbecco medium with 500 nM StemRegenin 1 (STEMCELL Technologies), 50 ng/mL Flt-3 ligand, 20 ng/mL interleukin-3, 100 ng/mL stem cell factor, and 20 ng/mL granulocyte colony-stimulating factor. For GFI1 knockdown, HL60 cells were transduced and subsequently Venus+ cells were sorted using a FACSAria II flow cytometer (BD Biosciences).
Immunostaining and flow cytometry analysis
AML cells were treated with ATRA (Sigma-Aldrich), rhIGFBP7, TCP (Selleckchem), or combinations for 72 to 120 hours (cell lines) or for 7 days (primary samples) before analysis. At least 2 × 10⁵ cells were harvested and washed in phosphate-buffered saline (PBS) with 0.1% human serum albumin. Samples were incubated with monoclonal antibody combinations consisting of anti-human 7AAD-PerCP (1:10), CD11b-PE (D12; 1:50) or CD11b-APC (MoP9; 1:50) or CD11b-FITC (Bear1; 1:10), CD45-HV500c (2D1; 1:20), CD33-PC7 (1:20), CD34-BV421 (581; 1:20), CD38-APC (HB7; 1:50), CD15-FITC (HI98; 1:50), CD56-PE (MY31; 1:20), CD3-FITC (SK7; 1:50), CD19-APC-H7 (SJ25C1; 1:10), or anti-mouse CD45-PerCP (30-F11; 1:50) (all from BD Biosciences) for 30 minutes and washed once with PBS and 1% human serum albumin. Flow-Count Fluorospheres (Beckman Coulter) were added, according to the manufacturer’s instructions, directly before analysis using an LSRFortessa flow cytometer (BD Biosciences). Data analysis was performed using FACSDiva software (BD Biosciences).
Liquid culture and colony-forming unit assays
After treatment of NB4 cells with ATRA for 4 days or primary samples with ATRA, rhIGFBP7, TCP, or combinations for 7 days (progenitor assay) and 4 weeks (long-term liquid culture assay) in CellGro-SCGM medium (CellGenix) with 50 ng/mL Flt-3 ligand, 20 ng/mL interleukin-3, and 100 ng/mL human stem cell factor (all from PeproTech), 1 to 5 × 10⁴ cells were transferred to MethoCult without erythropoietin (STEMCELL Technologies) and incubated in a humidified atmosphere at 37°C and 5% CO2. After 10 to 14 days, colonies were quantified using an Axiovert 25 bright-field microscope (Zeiss).
Patient-derived xenograft AML mouse model
NOD/SCID/IL2rγnull mice (NSG) were purchased from The Jackson Laboratory. All mice were maintained in a specific pathogen–free facility at the Amsterdam Animal Research Center of VU University in accordance with protocols (DEC-HEMA12-02 and DEC-HEMA13-02) approved by Centrale Commissie Dierproeven. Female and male mice, 6 to 9 weeks of age, were irradiated with 200 cGy 1 day prior to injection of cells. Primary AML cells were thawed, incubated with anti-CD3 MicroBeads (Miltenyi Biotec), and depleted of T cells using MACS columns (Miltenyi Biotec), according to the manufacturer’s protocol. AML cells were intravenously injected into the tail vein of the mice. Mice were treated with ATRA and/or rhIGFBP7, and their bone marrow was analyzed for the presence of human cells using a FACSCanto flow cytometer (BD Biosciences). Further details are provided in the supplemental Methods.
Immunoblotting
Cells were lysed in 1% NP40 lysis buffer containing 50 mM Tris (pH 7.5), 150 mM NaCl, 5 mM EDTA (pH 8.0), protease inhibitors (cOmplete Mini protease inhibitor cocktail; Roche), and phosphatase inhibitors (PhosSTOP; Sigma-Aldrich). Equal amounts of protein were loaded and separated on 4% to 16% Mini-PROTEAN TGX Precast Gels (sodium dodecyl sulfate polyacrylamide gel electrophoresis) (Bio-Rad) and transferred to polyvinylidene difluoride membranes (Millipore). Membranes were blocked for 45 minutes in 2.5% (weight-to-volume ratio, %) nonfat dry milk powder (Nutricia) and 2.5% (weight-to-volume ratio, %) bovine serum albumin (Millipore) in PBS/0.1% Tween 20 (PBS/T; Thermo Fisher Scientific), and incubated with mouse anti-IGFBP7 (1:500, MAB1334; R&D Systems), mouse anti-GFI1 (clone B9, 1:500, sc-376949; Santa Cruz Biotechnology), or mouse anti–β-actin (clone C4, 1:5000, MAB1504; Sigma-Aldrich) for ≥2 hours at room temperature (RT). After washing with bovine serum albumin in PBS/0.1% Tween 20, membranes were incubated with goat anti-mouse immunoglobulins/horseradish peroxidase (1:1000, P0447; Dako) for 1 hour at RT. Membranes were developed with enhanced chemiluminescence (GE Healthcare) and imaged using a UVITEC imaging system (Cleaver Scientific).
May-Grünwald-Giemsa staining
After treatment of AML cells with ATRA, rhIGFBP7, or the combination for 72 hours, 5 × 10⁴ cells were seeded on an object glass, using a Shandon Cytospin centrifuge (Thermo Fisher Scientific), dried overnight at RT, and stained using a Aerospray Hematology Pro Slide Stainer (ELITechGroup) with May-Grünwald-Giemsa staining. Cytospin images were acquired at 0.5 µm per pixel resolution using a Vectra Polaris Imaging System (Akoya Biosciences) in bright-field mode. Images were analyzed using QuPath Software (University of Edinburgh).
Data quantification and statistical analysis
Statistical analyses were performed using GraphPad Prism 8.0. Results are reported as mean ± standard error of the mean (SEM) or standard deviation (SD). Statistical significance between 2 measurements was determined using 2-tailed (un)paired Student t tests. To compare multiple groups, 1- or 2-way analysis of variance (ANOVA) with a post hoc Tukey’s, Dunnett, or Bonferroni multiple-comparison test were used. To measure the degree of association, Spearman’s rank correlation was used.
Detailed methodology used for RNA isolation and quantitative reverse transcriptase polymerase chain reaction (qRT-PCR), molecular diagnostics and cytogenetic analysis, production of rhIGFBP7, and RNA sequencing is described in supplemental Methods.
Results
Enhanced IGFBP7 expression sensitizes APL cells to physiological concentrations of ATRA
Pharmacological doses of ATRA promote myeloid differentiation of APL cells.34 To determine whether IGFBP7 is part of the ATRA-induced responses in APL, we generated APL cells (NB4) with decreased IGFBP7 using lentiviral transduction of 2 independent shRNAs (supplemental Figure 1A-B). Downregulation of IGFBP7 in NB4 cells resulted in a significant reduction in the membrane expression of the myeloid differentiation marker CD11b after treatment with high concentrations of ATRA (0.5 µM) (Figure 1A), suggesting that IGFBP7 is part of the signaling pathway crucial for ATRA-induced differentiation in APL cells. Increasing the expression of IGFBP7 alone (supplemental Figure 1C-D) did not lead to induction of differentiation in NB4 cells; however, incubation of the cells with a low dose of ATRA (0.01 µM) in the presence of enhanced IGFBP7 significantly increased the number of CD11b-expressing cells (5.7-fold) (Figure 1B). Overexpression of IGFBP7 in NB4 cells resulted in reduced clonogenic capacity of the cells and could significantly enhance the ATRA-driven decrease in clonogenic potential (Figure 1C). Thus, low doses of ATRA induced acquisition of CD11b and a reduction in the clonogenic capacity of NB4 cells with enhanced IGFBP7 levels, suggesting that IGFBP7 could potentiate the ability of ATRA to induce terminal differentiation in APL cells.
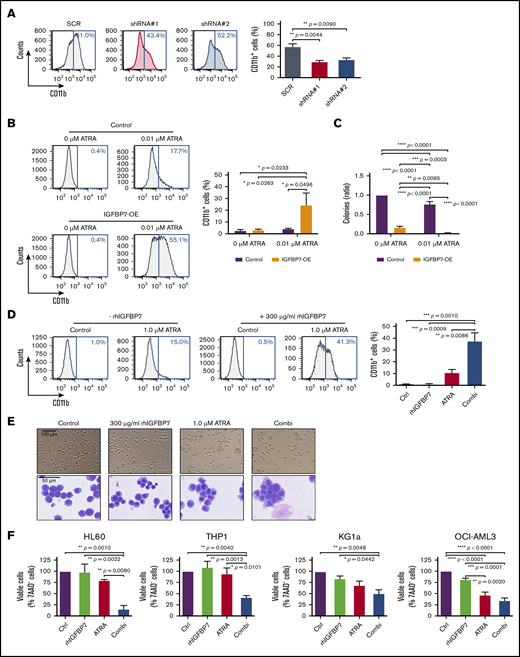

Enhanced IGFBP7 expression sensitizes APL cells to physiological concentrations of ATRA, and rhIGFBP7 potentiates ATRA-induced differentiation, inhibition of proliferation, and apoptosis in non-APL AML cells. For all experiments, AML cells were cultured in low serum condition and stimulated with PBS (Control/Ctrl), 300 µg/mL rhIGFBP7, 1.0 µM ATRA, or the combination (Combi) for 96 hours unless stated otherwise. Differentiation (membrane CD11b expression), proliferation, and apoptosis were measured using flow cytometry, and data are plotted as mean ± SEM. (A) Percentage of differentiation in NB4 cells, transduced with IGFBP7 shRNAs (#1 and #2) or scrambled (SCR) shRNA, after stimulation with 0.5 µM ATRA. P values were determined using 1-way ANOVA with post hoc Dunnett multiple-comparison test. (B-C) NB4 cells, transduced with control or IGFBP7-expressing (IGFBP7-OE) vectors, were stimulated with 0.01 µM ATRA. (B) Percentage increase in CD11b expression. (C) CFU assay (in duplicate), normalized against untreated control. (D) CD11b expression in HL60 cells, quantified relative to flow count beads. (E) Morphology of HL60 cells after stimulation for 72 hours, analyzed using a bright-field microscope (upper panels) and by May-Grünwald-Giemsa staining (lower panels). (F) Viability of AML cell lines after stimulation for 72 hours (HL60 and OCI-AML3 cells) or 120 hours (THP1 and KG1a cells) with rhIGFBP7, ATRA, or the combination, normalized against untreated control. (G) AnnexinV+ THP1 cells after stimulation for 120 hours. (H) Percentage of apoptotic (AnnexinV+ and 7AAD+) THP1 cells (left panel) or OCI-AML3 cells (right panel) after stimulation for 120 hours, quantified relative to flow count beads. Graphs are representative of ≥3 independent experiments. *P < .05, **P < .01, ***P < .001, ****P < .0001, 1- or 2-way ANOVA with post hoc Tukey’s multiple-comparison test, unless stated otherwise.
Enhanced IGFBP7 expression sensitizes APL cells to physiological concentrations of ATRA, and rhIGFBP7 potentiates ATRA-induced differentiation, inhibition of proliferation, and apoptosis in non-APL AML cells. For all experiments, AML cells were cultured in low serum condition and stimulated with PBS (Control/Ctrl), 300 µg/mL rhIGFBP7, 1.0 µM ATRA, or the combination (Combi) for 96 hours unless stated otherwise. Differentiation (membrane CD11b expression), proliferation, and apoptosis were measured using flow cytometry, and data are plotted as mean ± SEM. (A) Percentage of differentiation in NB4 cells, transduced with IGFBP7 shRNAs (#1 and #2) or scrambled (SCR) shRNA, after stimulation with 0.5 µM ATRA. P values were determined using 1-way ANOVA with post hoc Dunnett multiple-comparison test. (B-C) NB4 cells, transduced with control or IGFBP7-expressing (IGFBP7-OE) vectors, were stimulated with 0.01 µM ATRA. (B) Percentage increase in CD11b expression. (C) CFU assay (in duplicate), normalized against untreated control. (D) CD11b expression in HL60 cells, quantified relative to flow count beads. (E) Morphology of HL60 cells after stimulation for 72 hours, analyzed using a bright-field microscope (upper panels) and by May-Grünwald-Giemsa staining (lower panels). (F) Viability of AML cell lines after stimulation for 72 hours (HL60 and OCI-AML3 cells) or 120 hours (THP1 and KG1a cells) with rhIGFBP7, ATRA, or the combination, normalized against untreated control. (G) AnnexinV+ THP1 cells after stimulation for 120 hours. (H) Percentage of apoptotic (AnnexinV+ and 7AAD+) THP1 cells (left panel) or OCI-AML3 cells (right panel) after stimulation for 120 hours, quantified relative to flow count beads. Graphs are representative of ≥3 independent experiments. *P < .05, **P < .01, ***P < .001, ****P < .0001, 1- or 2-way ANOVA with post hoc Tukey’s multiple-comparison test, unless stated otherwise.
rhIGFBP7 potentiates ATRA-induced differentiation, inhibition of proliferation, and apoptosis in non-APL AML cells
To explore therapeutic strategies that enhance the effects of ATRA in AML, we investigated whether addition of rhIGFBP7 could activate ATRA-driven responses in AML cells from subtypes other than APL. Incubation of the non-APL cell line HL60 with ATRA alone resulted in a small increase in the fraction of HL60 cells expressing membrane CD11b. Treatment with rhIGFBP7 alone did not significantly upregulate CD11b (Figure 1D). However, incubation with the combination of ATRA and rhIGFBP7 resulted in a significant increase in the fraction of cells expressing CD11b (Figure 1D), implicating that rhIGFBP7 sensitized HL60 cells to ATRA-induced differentiation. In addition to induction of CD11b membrane expression, the cells show morphological changes typical of terminal myeloid differentiation, such as elongated cells and nuclear lobulation, after treatment with the combination of ATRA and rhIGFBP7 (Figure 1E). Induction of differentiation was accompanied by a significant reduction in the number of viable HL60 cells after incubation with the combination, whereas the single treatments had little or no effect (Figure 1F, far left panel). In the non-APL AML cell line THP1, containing a MLL-AF9 translocation, ATRA monotherapy induced membrane CD11b expression but addition of rhIGFBP7 did not enhance this effect (data not shown). In the cell lines THP1, KG1a, overexpressing Myc and containing a p53 and PTEN mutation, and OCI-AML3, containing a NPM1 and DNMT3a mutation, incubation with the combination of rhIGFBP7 and ATRA resulted in a significant reduction in viable cells compared with the single treatments (Figure 1F). Moreover, in agreement with previous findings,18,19 ATRA monotherapy reduced the number of viable OCI-AML3 cells, although to a lesser extent than the combination did. Treatment with rhIGFBP7 alone did not result in a reduction in cell viability in any of the 3 cell lines. The reduction in viable THP1 and OCI-AML3 cells after combination treatment was due to induction of apoptosis, as indicated by a significant enhanced binding of Annexin V (example in Figure 1G) and the presence of Annexin V+ and 7-AAD+ cells (Figure 1H). Together, these results indicate that ATRA-driven responses in non-APL AML cells belonging to various molecular subgroups can be activated by treatment with rhIGFBP7.
rhIGFBP7 activates ATRA-driven responses in primary non-APL AML cells
To elucidate whether rhIGFBP7 could activate ATRA-induced responses in human non-APL AML patient cells, we cultured primary AML cells from 28 non-APL AML patients at diagnosis with rhIGFBP7, ATRA, or the combination. Induction of differentiation was investigated by measuring membrane CD11b expression in the CD33+ myeloid blast population (examples in Figure 2A; supplemental Figure 2A), and cell viability was quantified by measuring the number of viable CD45dim blasts and immature CD45dimCD34+ leukemia cells (example in Figure 2B), using flow cytometry. Responsive AML cases were defined as showing a >5% increase in CD11b-expressing CD33+ blasts and/or a >5% reduction in survival of CD45dim blasts after treatment with the combination of rhIGFBP7 and ATRA compared with the single treatments (Figure 2C; supplemental Figure 2B; supplemental Tables 1 and 2). In 8 of the 14 responsive cases, we observed a significant increase in CD11b in the myeloid CD33+ blasts after treatment with the combination (Figure 2D; supplemental Figure 2C). In 10 of the 14 responders, the combination of rhIGFBP7 and ATRA resulted in a significant reduction in the number of viable AML CD45dim blasts (example in Figure 2B, upper panels; Figure 2E; supplemental Figure 2D) and CD45dimCD34+ immature leukemic cells (example in Figure 2B, lower panels; Figure 2F; supplemental Figure 2E) compared with the single treatments. In 3 of the 14 responders there was even enhanced induction of >35% of cell death in the blasts after the combination compared with the single treatments. We also measured induction of the myeloid differentiation marker CD14 in 17 of the 28 primary AML cases after incubation with rhIGFBP7, ATRA, or the combination; however, an increase in CD14 was not observed after combination therapy (supplemental Figure 2F). Notably, some responsive cases (AML5-10) showed a marked reduction in leukemic blast viability but very little induction of differentiation after rhIGFBP7 and ATRA (Figure 2C; supplemental Table 2). To determine whether differentiation happens prior to cell death after combination treatment, we determined the induction of differentiation by measuring membrane myeloid differentiation markers CD11b, CD14, CD15, and CD86, as well as the reduction in cell viability over time in 2 AML cases (AML11 and AML12) that showed both differentiation and reduced cell viability after the combination. We did not observe an induction of these myeloid markers at day 3 or day 5 after treatment with the combination (data not shown), whereas CD11b was clearly upregulated and cell viability was reduced at day 7 (Figure 2C-E), suggesting that, in these cases, the combination directly promoted cell death and the differentiation route is likely parallel to the one inducing cell death, similar to what was observed for LSD1 inhibition.35 Together, these results indicate that primary non-APL AML cases belonging to a variety of molecular subclasses can be sensitized to ATRA-driven responses by rhIGFBP7.

rhIGFBP7 activates ATRA-driven responses in primary non-APL AML cells. For all ex vivo experiments, cells were stimulated with PBS (Control/Ctrl), 100 µg/mL rhIGFBP7, 0.5 µM ATRA, or the combination (Combi) for 7 days. Percentages of CD33+CD11b+, viable CD45dim and CD45dimCD34+ cells were measured using flow cytometry, quantified relative to flow count beads, normalized against untreated control cells, and plotted as mean ± SEM. Patient sample characteristics are summarized in supplemental Table 1. (A) CD11b membrane expression on CD33+ blasts relative to the untreated control sample in AML13. (B) Percentage of viable CD45dim cells (blue; upper panels) and CD45dimCD34+ cells (red; lower panels) in AML7. (C) Heat map of clinical and genetic features of 28 primary AML samples. Responsive AML cases were defined as >5% increase in CD11b-expressing myeloid CD33+ blasts and/or >5% reduction in CD45dim blast survival upon ATRA-rhIGFBP7 combination treatment compared with the single treatments. The fold increase in CD11b and fold decrease in CD45dim cells represent the ratio of CD11b-expressing CD33+ blasts and the ratio of reduction in CD45dim blast survival following combination treatment relative to untreated control or single therapies. Percentages are shown in supplemental Table 2. (D) Induction of differentiation in 8 primary AML samples responsive to rhIGFBP7-ATRA. Percentage of viable CD45dim cells (E) and CD45dimCD34+ cells (F) in 10 primary AML samples responding to rhIGFBP7-ATRA. (G) Schematic overview of the experiment (left panel). After injection of T-cell–depleted primary AML cells, NSG mice were treated with ATRA (10 mg, 21-day-release pellet) in week 2 and/or rhIGFBP7 (12 mg/kg) in week 5 (days 1-3). At week 16, the bone marrow cells of the mice were analyzed for the presence of hCD45+ cells (middle panel) and myeloid hCD45+CD33+ cells (right panel) using flow cytometry. *P < .05, **P < .01, ***P < .001, ****P < .0001, 1-way ANOVA with post hoc Tukey’s multiple-comparison test. BM, bone marrow; N/A, not available; PB, peripheral blood.
rhIGFBP7 activates ATRA-driven responses in primary non-APL AML cells. For all ex vivo experiments, cells were stimulated with PBS (Control/Ctrl), 100 µg/mL rhIGFBP7, 0.5 µM ATRA, or the combination (Combi) for 7 days. Percentages of CD33+CD11b+, viable CD45dim and CD45dimCD34+ cells were measured using flow cytometry, quantified relative to flow count beads, normalized against untreated control cells, and plotted as mean ± SEM. Patient sample characteristics are summarized in supplemental Table 1. (A) CD11b membrane expression on CD33+ blasts relative to the untreated control sample in AML13. (B) Percentage of viable CD45dim cells (blue; upper panels) and CD45dimCD34+ cells (red; lower panels) in AML7. (C) Heat map of clinical and genetic features of 28 primary AML samples. Responsive AML cases were defined as >5% increase in CD11b-expressing myeloid CD33+ blasts and/or >5% reduction in CD45dim blast survival upon ATRA-rhIGFBP7 combination treatment compared with the single treatments. The fold increase in CD11b and fold decrease in CD45dim cells represent the ratio of CD11b-expressing CD33+ blasts and the ratio of reduction in CD45dim blast survival following combination treatment relative to untreated control or single therapies. Percentages are shown in supplemental Table 2. (D) Induction of differentiation in 8 primary AML samples responsive to rhIGFBP7-ATRA. Percentage of viable CD45dim cells (E) and CD45dimCD34+ cells (F) in 10 primary AML samples responding to rhIGFBP7-ATRA. (G) Schematic overview of the experiment (left panel). After injection of T-cell–depleted primary AML cells, NSG mice were treated with ATRA (10 mg, 21-day-release pellet) in week 2 and/or rhIGFBP7 (12 mg/kg) in week 5 (days 1-3). At week 16, the bone marrow cells of the mice were analyzed for the presence of hCD45+ cells (middle panel) and myeloid hCD45+CD33+ cells (right panel) using flow cytometry. *P < .05, **P < .01, ***P < .001, ****P < .0001, 1-way ANOVA with post hoc Tukey’s multiple-comparison test. BM, bone marrow; N/A, not available; PB, peripheral blood.
Comparing clinical features, molecular aberrancies, cytogenetics, and the associated French-American-British classification between responsive and nonresponsive cases revealed that, although not significant, samples with a higher percentage of CD34-expressing blasts at diagnosis (mean, 58.0% for responders and 29.7% for nonresponders) and elevated levels of white blood cells (WBCs; mean, 146.1 × 10⁶ cells per milliliter in responders vs 79.4 × 10⁶ cells per milliliter in nonresponders) respond in general better to the combination treatment than those with lower CD34 or lower WBCs (Figure 2C; supplemental Figure 2G; supplemental Table 1). More specifically, AML cases showing a reduction in cell viability after the combination have a significantly higher percentage of CD34-expressing blasts at diagnosis (mean, 68.4%) and elevated levels of WBCs (mean, 178.6 × 10⁶ cells per milliliter) compared with nonresponders (supplemental Figure 2H). We also observed an increase in CD38 expression after ATRA treatment in 85% of the tested AML cases (supplemental Figure 2I), which was previously shown to be caused by ATRA-induced transcriptional activation of CD38.36
To investigate whether treatment with rhIGFBP7 can add to the ATRA-induced reduction in AML burden in vivo, primary AML cells from an ATRA-sensitive EVI-1+ patient21 were transplanted into NSG mice. Two weeks later, ATRA (release of 10 mg over 21 days) or placebo pellets were implanted in the neck of the mice, followed by 3 treatments with 12 mg/kg rhIGFBP7 or PBS (on days 1 through 3). Analysis of the bone marrow at week 16 revealed that the combination was better at reducing engraftment of human (h)CD45dim leukemia cells (P = .0003) and hCD45dimCD33+ myeloid leukemia cells (P = .0063) compared to ATRA or rhIGFBP7 alone (Figure 2G; supplemental Figure 2J), indicating the potential for rhIGFBP7 to enhance ATRA-driven in vivo depletion of leukemic burden.
Enhanced IGFBP7 expression or treatment with rhIGFBP7 induces sensitivity to ATRA in primary AML stem and progenitor cells
To determine whether an increase in IGFBP7 levels can be a strategy to reduce self-renewal capacity and/or survival of primary AML cells upon ATRA treatment, we overexpressed IGFBP7 in 2 primary AML cases using lentiviral transduction. Immature CD45dim blasts and CD45high mature blast cells were efficiently transduced, whereas the lymphocytes were not (supplemental Figure 3A). First, we investigated the effect of enhanced IGFBP7 on survival of clonogenic leukemia progenitor cells by short liquid culturing and a colony-forming unit (CFU) assay. Although ATRA monotherapy resulted in a reduced number of colonies in 1 case, ATRA treatment of AML cells with enhanced IGFBP7 significantly reduced the colony-forming capacity in both samples (Figure 3A; supplemental Figure 3B), suggesting that IGFBP7 potentiates ATRA-induced elimination of leukemic progenitors. The leukemic phenotype of these cells was confirmed by detection of a leukemia-associated immunophenotype (LAIP)37 on the CD45dim blasts derived from the colonies (Figure 3B). Flow cytometric analysis of AML cells derived from these colonies also showed that CD45dim and CD45high leukemic cells with enhanced IGFBP7 were less viable after treatment with ATRA compared with control cells, whereas the lymphocytes were unaffected (Figure 3C; supplemental Figure 3C), again indicating that IGFBP7 potentiates susceptibility for ATRA-induced cell death in leukemic blasts.

Enhanced IGFBP7 expression or treatment with rhIGFBP7 induces sensitivity to ATRA in primary AML stem and progenitor cells. For all ex vivo experiments, cells were incubated with PBS (Control/Ctrl), 100 µg/mL rhIGFBP7, 0.5 µM ATRA, or the combination (Combi). For CFU progenitor and long-term liquid culture (stem cell) assays, samples (in duplicate) were incubated for 7 days or 4 weeks, respectively, and normalized against untreated controls. Data are plotted as mean ± SEM, unless stated otherwise. Patient sample characteristics are summarized in supplemental Table 1. (A-C) Primary AML samples were lentivirally transduced with control or IGFBP7-OE vectors. (A) CFU progenitor assays of primary AML samples, plotted as mean ± SD. (B) CFU plates, containing all colonies, were harvested, and flow cytometric analysis of AML cells derived from the colonies was performed, showing leukemic CD45dim blasts in the transduced cell population for AML9 (LAIP = CD15; left panels) and AML29 (LAIP = CD56; right panels). (C) Percentage of CD45dimLAIP+ blasts (left panel) and CD45highLAIP+ blasts (middle panel) derived from the colonies, quantified, and normalized against untreated controls. Percentage of lymphocytes (right panel), measured using flow cytometry and plotted as mean ± SD. (D-E) CFU progenitor assays of primary AML samples, with AML cases not responding to combination therapies shown in the right lighter bars. Samples were incubated with rhIGFBP7 and ATRA (D) or with TCP (10 µM) and ATRA (E). (F) CFU stem cell assay (long-term liquid culture) of primary AML samples incubated with rhIGFBP7 and ATRA. (G) Schematic overview of the experiment (left panel). After injection of T-cell–depleted primary AML cells, NSG mice were treated with rhIGFBP7 (10 mg/kg) in week 4 (day 1) and week 8 (day 1-3) and/or ATRA (10 mg, 21-day-release pellet) in week 8 (day 3). Subsequently, equal numbers of human myeloid hCD45+CD33+ cells derived from the first transplant were injected into secondary recipients. At week 16, bone marrow cells from the mice were analyzed for the presence of hCD45+ cells (middle panel) and myeloid hCD45+CD33+ cells (right panel). *P < .05, **P < .01, ***P < .001, 1- or 2-way ANOVA with post hoc Tukey’s multiple-comparison test, unless stated otherwise.
Enhanced IGFBP7 expression or treatment with rhIGFBP7 induces sensitivity to ATRA in primary AML stem and progenitor cells. For all ex vivo experiments, cells were incubated with PBS (Control/Ctrl), 100 µg/mL rhIGFBP7, 0.5 µM ATRA, or the combination (Combi). For CFU progenitor and long-term liquid culture (stem cell) assays, samples (in duplicate) were incubated for 7 days or 4 weeks, respectively, and normalized against untreated controls. Data are plotted as mean ± SEM, unless stated otherwise. Patient sample characteristics are summarized in supplemental Table 1. (A-C) Primary AML samples were lentivirally transduced with control or IGFBP7-OE vectors. (A) CFU progenitor assays of primary AML samples, plotted as mean ± SD. (B) CFU plates, containing all colonies, were harvested, and flow cytometric analysis of AML cells derived from the colonies was performed, showing leukemic CD45dim blasts in the transduced cell population for AML9 (LAIP = CD15; left panels) and AML29 (LAIP = CD56; right panels). (C) Percentage of CD45dimLAIP+ blasts (left panel) and CD45highLAIP+ blasts (middle panel) derived from the colonies, quantified, and normalized against untreated controls. Percentage of lymphocytes (right panel), measured using flow cytometry and plotted as mean ± SD. (D-E) CFU progenitor assays of primary AML samples, with AML cases not responding to combination therapies shown in the right lighter bars. Samples were incubated with rhIGFBP7 and ATRA (D) or with TCP (10 µM) and ATRA (E). (F) CFU stem cell assay (long-term liquid culture) of primary AML samples incubated with rhIGFBP7 and ATRA. (G) Schematic overview of the experiment (left panel). After injection of T-cell–depleted primary AML cells, NSG mice were treated with rhIGFBP7 (10 mg/kg) in week 4 (day 1) and week 8 (day 1-3) and/or ATRA (10 mg, 21-day-release pellet) in week 8 (day 3). Subsequently, equal numbers of human myeloid hCD45+CD33+ cells derived from the first transplant were injected into secondary recipients. At week 16, bone marrow cells from the mice were analyzed for the presence of hCD45+ cells (middle panel) and myeloid hCD45+CD33+ cells (right panel). *P < .05, **P < .01, ***P < .001, 1- or 2-way ANOVA with post hoc Tukey’s multiple-comparison test, unless stated otherwise.
We then evaluated whether the addition of rhIGFBP7 protein to primary AML cells could potentiate ATRA-driven reduction in clonogenic leukemia progenitor cells. Although 3 of the 8 cases responded to rhIGFBP7 monotherapy, the combination of rhIGFBP7 and ATRA significantly reduced the numbers of colonies in 4 of the 8 cases, while the single treatments did not (Figure 3D; supplemental Figure 3D). Incubation of primary AML cells with TCP, an inhibitor of LSD1, in combination with ATRA significantly reduced the clonogenic capacity of leukemia progenitors in 3 of the 5 tested cases (Figure 3E; supplemental Figure 3D). Interestingly, 2 AML samples responded to the combination of ATRA with rhIGFBP7 and ATRA with TCP (AML12 and AML30), whereas 2 other cases only responded to 1 of the combinations (ATRA + rhIGFBP7 [AML29] or ATRA + TCP [AML25]) (Figure 3D-E; supplemental Figure 3D), suggesting that rhIGFBP7 and TCP activate ATRA-driven depletion of leukemic progenitors in a distinct panel of AML cases.
Next, we evaluated whether the combination of rhIGFBP7 and ATRA could reduce the survival of clonogenic long-term surviving leukemia (stem) cells. Although there was already a significant reduction in clonogenic long-term surviving leukemia cells after incubation with the single treatments, the combination led to an even larger reduction in colony number (to nearly 0), in 3 of the 4 tested cases (Figure 3F; supplemental Figure 3E).
To study whether rhIGFBP7 could sensitize LSCs for ATRA-induced cell death in vivo, we equalized the number of human AML cells derived from first transplanted mice that were treated with rhIGFBP7 or ATRA monotherapy or pretreated with rhIGFBP7 and subsequently treated with the combination of rhIGFBP7 and ATRA and retransplanted the cells into secondary recipients (Figure 3G, left panel). The single treatments did not have an effect on leukemic engraftment; however, combining rhIGFBP7 with ATRA resulted in significantly fewer hCD45+ and hCD45+CD33+ leukemia cells in the bone marrow of the secondary recipients (Figure 3G; supplemental Figure 3F), indicating that treatment with rhIGFBP7 enhanced ATRA-induced reduction in LSC activity in vivo.
rhIGFBP7 and ATRA combination treatment does not affect healthy bone marrow cells
Therapeutic approaches targeting LSCs should spare normal healthy hematopoietic stem cells (HSCs) to restore normal hematopoiesis after therapy. Hence, bone marrow cells derived from 4 healthy donors were incubated with rhIGFBP7, ATRA, or the combination, and cell viability was assessed using flow cytometry. The total number of viable cells was not reduced after the single treatments or after rhIGFBP7 and ATRA combination treatment (Figure 4A). The total numbers of CD45dim cells (Figure 4B), myeloid CD45dimCD33+ cells (Figure 4C; supplemental Figure 4A), CD34+ cells (Figure 4D; supplemental Figure 4B), and T and B cells (Figure 4E-F; supplemental Figure 4C) were not affected or were only mildly affected. Incubation with rhIGFBP7 and ATRA monotherapy or the combination resulted in a small increase in differentiated CD11b+ myeloid cells in 1 of the 2 tested NBM samples (supplemental Figure 4D). Moreover, the colony-forming capacity of normal progenitor cells was not significantly affected after rhIGFBP7 and ATRA combination treatment (Figure 4G; supplemental Figure 4E).

rhIGFBP7 and ATRA combination treatment does not affect healthy NBM cells. NBM cells derived from healthy donors were incubated with PBS (Ctrl), 100 µg/mL rhIGFBP7, 0.5 µM ATRA, or the combination (Combi) for 5 to 7 days. The effects of the treatments were normalized against untreated control cells and plotted as mean ± SEM. NBM samples were analyzed for the percentage of viable cells (A), CD45dim cells (B), myeloid CD45dimCD33+ cells (C), CD45dimCD34+ cells (D), CD3+ T cells (E), and CD19+ B cells (F) using flow cytometry and quantified relative to flow count beads. (G) CFU progenitor assays of NBM samples (in duplicate) after 7 days of treatment.
rhIGFBP7 and ATRA combination treatment does not affect healthy NBM cells. NBM cells derived from healthy donors were incubated with PBS (Ctrl), 100 µg/mL rhIGFBP7, 0.5 µM ATRA, or the combination (Combi) for 5 to 7 days. The effects of the treatments were normalized against untreated control cells and plotted as mean ± SEM. NBM samples were analyzed for the percentage of viable cells (A), CD45dim cells (B), myeloid CD45dimCD33+ cells (C), CD45dimCD34+ cells (D), CD3+ T cells (E), and CD19+ B cells (F) using flow cytometry and quantified relative to flow count beads. (G) CFU progenitor assays of NBM samples (in duplicate) after 7 days of treatment.
rhIGFBP7 induces susceptibility to ATRA by reducing GFI1 expression
To elucidate the potential mechanisms through which rhIGFBP7 is enhancing sensitivity to ATRA in primary AML cells, we incubated 3 AML samples with rhIGFBP7 and measured the change in gene expression using RNA sequencing (Figure 5A). Using gene set enrichment analysis, we demonstrated previously that rhIGFBP7 treatment resulted in reversal of expression of LSC genes and induction of differentiation toward the monocytic lineage.31 Pathway analysis, using DAVID, of the top upregulated and downregulated genes after treatment of the 3 samples with rhIGFBP7 revealed enhanced expression of components involved in regulation of differentiation and cell death, as well as factors involved in epigenetic mechanisms, including regulation of transcription and transcription factor activity (Figure 5B). Moreover, the identified transcriptomes revealed several modulated genes after rhIGFBP7 treatment in all 3 cases, including downregulation of GFI1 (Figure 5A; supplemental Table 3). GFI1 is a transcriptional repressor38-40 that is involved in the self-renewal capacity of HSCs and multilineage potential of progenitors.41,42 Deletion of GFI1 results in a block in differentiation, leading to loss of neutrophils and accumulation of immature myelomonocytic cells.43 qRT-PCR confirmed that rhIGFBP7 reduces GFI1 in primary AML (Figure 5C).
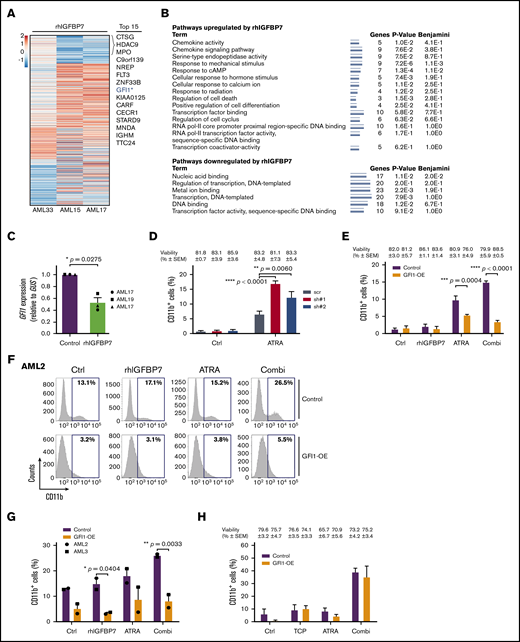
rhIGFBP7 induces susceptibility to ATRA by reducing GFI1 expression. AML cells were stimulated with 100 µg/mL rhIGFBP7, 0.5 µM ATRA, 1.0 µM TCP, or the combination (Combi) for 4 days (HL60 cells) or 7 days (primary AML cells). Induction of differentiation (membrane CD11b expression) and cell viability were measured using flow cytometry and quantified relative to flow count beads. Data are representative of ≥3 independent experiments, plotted as mean ± SEM. Patient sample characteristics are summarized in supplemental Table 1. (A) Heat map of the top 111 differentially expressed genes in CD45dim cells from 3 primary AML samples after treatment with rhIGFBP7 for 48 hours. Genes were selected based on their log2-fold change (FC) in rhIGFBP7-stimulated samples compared with untreated controls (cutoff value = log2FC < −0.5 and > +0.5; P < .01). The top 15 downregulated genes are listed. *Position of GFI1. (B) Pathway analysis of the top upregulated and downregulated genes in response to rhIGFBP7 treatment for 48 hours. The minimum number of overrepresented genes was set to 3, and the Kyoto Encyclopedia of Genes and Genomes pathway and Gene Ontology process were used to perform functional pathway analysis using DAVID (v6.8). (C) GFI1 expression (in triplicate) in primary AML samples after treatment with rhIGFBP7, measured relative to GUS expression using qRT-PCR, and normalized against control sample. P values were determined using a paired Student t test. (D) HL60 cells were lentivirally transduced with GFI1-shRNAs (sh#1 and sh#2) or scrambled (scr) shRNA. The percentage of (Venus+)CD11b+ HL60 cells was measured after 4 days of ATRA treatment, and the percentage of viable cells (blue) for each condition is listed above the graph. P values were determined using 2-way ANOVA with a post hoc Tukey’s multiple-comparison test. (E-H) AML cells were lentivirally transduced with control-YFP (Control) or GFI1-YFP (GFI1-OE)–expressing vectors. (E) Percentage of CD11b+ cells after treatment of HL60 cells. The percentage of viable cells (blue) for each condition is listed above the graph. Example of flow cytometric analysis of AML2 (F) and percentage of membrane CD11b in the transduced (YFP+)CD45dim cell population of 2 primary AML samples, measured 14 days posttransduction (G). (H) Percentage of CD11b+ cells after treatment of HL60 cells with TCP, ATRA, or the combination (Combi). The percentage of viable cells (blue) for each condition is listed above the graph. *P < .05, **P < .01, ***P < .001, ****P < .0001, 2-way ANOVA with post hoc Bonferroni multiple-comparison test, unless stated otherwise.
rhIGFBP7 induces susceptibility to ATRA by reducing GFI1 expression. AML cells were stimulated with 100 µg/mL rhIGFBP7, 0.5 µM ATRA, 1.0 µM TCP, or the combination (Combi) for 4 days (HL60 cells) or 7 days (primary AML cells). Induction of differentiation (membrane CD11b expression) and cell viability were measured using flow cytometry and quantified relative to flow count beads. Data are representative of ≥3 independent experiments, plotted as mean ± SEM. Patient sample characteristics are summarized in supplemental Table 1. (A) Heat map of the top 111 differentially expressed genes in CD45dim cells from 3 primary AML samples after treatment with rhIGFBP7 for 48 hours. Genes were selected based on their log2-fold change (FC) in rhIGFBP7-stimulated samples compared with untreated controls (cutoff value = log2FC < −0.5 and > +0.5; P < .01). The top 15 downregulated genes are listed. *Position of GFI1. (B) Pathway analysis of the top upregulated and downregulated genes in response to rhIGFBP7 treatment for 48 hours. The minimum number of overrepresented genes was set to 3, and the Kyoto Encyclopedia of Genes and Genomes pathway and Gene Ontology process were used to perform functional pathway analysis using DAVID (v6.8). (C) GFI1 expression (in triplicate) in primary AML samples after treatment with rhIGFBP7, measured relative to GUS expression using qRT-PCR, and normalized against control sample. P values were determined using a paired Student t test. (D) HL60 cells were lentivirally transduced with GFI1-shRNAs (sh#1 and sh#2) or scrambled (scr) shRNA. The percentage of (Venus+)CD11b+ HL60 cells was measured after 4 days of ATRA treatment, and the percentage of viable cells (blue) for each condition is listed above the graph. P values were determined using 2-way ANOVA with a post hoc Tukey’s multiple-comparison test. (E-H) AML cells were lentivirally transduced with control-YFP (Control) or GFI1-YFP (GFI1-OE)–expressing vectors. (E) Percentage of CD11b+ cells after treatment of HL60 cells. The percentage of viable cells (blue) for each condition is listed above the graph. Example of flow cytometric analysis of AML2 (F) and percentage of membrane CD11b in the transduced (YFP+)CD45dim cell population of 2 primary AML samples, measured 14 days posttransduction (G). (H) Percentage of CD11b+ cells after treatment of HL60 cells with TCP, ATRA, or the combination (Combi). The percentage of viable cells (blue) for each condition is listed above the graph. *P < .05, **P < .01, ***P < .001, ****P < .0001, 2-way ANOVA with post hoc Bonferroni multiple-comparison test, unless stated otherwise.
To elucidate whether reduced expression of GFI1 is mechanistically involved in rhIGFBP7-induced sensitivity to ATRA, we downregulated GFI1 in HL60 cells using 2 independent shRNAs (supplemental Figure 5A-B). Reduced expression of GFI1 led to a significant increase in the induction of differentiation after treatment with ATRA (Figure 5D; supplemental Figure 5C), indicating that low levels of GFI1 contribute to susceptibility to ATRA-induced differentiation. To investigate whether high GFI1 inhibits rhIGFBP7-induced ATRA responses, we overexpressed GFI1 in HL60 cells (supplemental Figure 5D-E). Elevated levels of GFI1 significantly blocked differentiation induced by combination treatment with rhIGFBP7 and ATRA (Figure 5E; supplemental Figure 5F), suggesting that maintaining the repressive function of GFI1 is involved, at least in part, in resistance to ATRA. To examine whether this also holds true for primary AML, we increased GFI1 expression in 2 primary AML cases (supplemental Figure 5G-H). Similar to in HL60 cells, enhanced GFI1 blocked the induction of membrane CD11b expression on CD45dim blasts after rhIGFBP7 and ATRA treatment (example in Figure 5F-G; supplemental Figure 5I). Interestingly, enhancing GFI1 expression did not affect TCP-induced susceptibility to ATRA-driven differentiation in HL60 cells (Figure 5H; supplemental Figure 5J), suggesting that increased sensitivity to ATRA after LSD1 inhibition is independent of GFI1 levels. Together, these results demonstrated that rhIGFBP7 can potentiate the ability of ATRA to induce differentiation in non-APL AML cells by reducing the transcriptional repressor GFI1.
Previously, we showed that a substantial proportion of EVI-1+ AML cases respond to ATRA by induction of differentiation and decreased clonogenic capacity of myeloid blasts.21 Because we showed here that low GFI1 increased the response to ATRA, we determined GFI1 expression in EVI-1+ and EVI-1− cases using a publicly available data set44 (supplemental Figure 5K) and a panel of cases from the Amsterdam UMC, location VUmc (Figure 6A). GFI1 was expressed at significantly lower levels in EVI-1+ cases compared with EVI-1− cases, suggesting that the sensitivity to ATRA in this group of patients might be correlated with low GFI1. Because the presence of a superenhancer at the RARA gene locus and high RARA messenger RNA levels have been linked to sensitivity to retinoids in a subset of non-APL AML patients,45,46 we also evaluated expression of RARA in these cases. Notably, RARA levels were not significantly different between EVI-1+ and EVI-1− AML patients (supplemental Figure 5L), implicating that low GFI1, and not high RARA, is associated with susceptibility to ATRA in AML with overexpression of EVI-1.

High RARA expression is a biomarker predicting sensitivity for rhIGFBP7-induced ATRA susceptibility in primary AML. Gene expression levels for GFI1 and RARA were measured by qRT-PCR (in triplicate). Patient sample characteristics of responders and nonresponders to rhIGFBP7 and ATRA combination treatment are summarized in supplemental Table 1. (A) Log2-transformed GFI1 gene expression in EVI-1− (n = 50) and EVI-1+ (n = 10) AML samples at diagnosis, measured relative to GUS expression. The relative GFI1 expression of 1 of the EVI-1+ AML samples was set at 1. IGFBP7 (B), GFI1 (C), and RARA (D) expression in responders and nonresponders to rhIGFBP7 and ATRA combination treatment, relative to HMBS expression, as measured by qRT-PCR. (E) GFI1 and RARA gene expression levels in responders and nonresponders to the combination of rhIGFBP7 and ATRA, relative to HMBS, as by qRT-PCR. Spearman’s correlation coefficients were calculated. *P < .05, **P < .01, Student t test, unless stated otherwise.
High RARA expression is a biomarker predicting sensitivity for rhIGFBP7-induced ATRA susceptibility in primary AML. Gene expression levels for GFI1 and RARA were measured by qRT-PCR (in triplicate). Patient sample characteristics of responders and nonresponders to rhIGFBP7 and ATRA combination treatment are summarized in supplemental Table 1. (A) Log2-transformed GFI1 gene expression in EVI-1− (n = 50) and EVI-1+ (n = 10) AML samples at diagnosis, measured relative to GUS expression. The relative GFI1 expression of 1 of the EVI-1+ AML samples was set at 1. IGFBP7 (B), GFI1 (C), and RARA (D) expression in responders and nonresponders to rhIGFBP7 and ATRA combination treatment, relative to HMBS expression, as measured by qRT-PCR. (E) GFI1 and RARA gene expression levels in responders and nonresponders to the combination of rhIGFBP7 and ATRA, relative to HMBS, as by qRT-PCR. Spearman’s correlation coefficients were calculated. *P < .05, **P < .01, Student t test, unless stated otherwise.
High RARA expression is a biomarker predicting sensitivity for rhIGFBP7-induced activation of the ATRA response in primary AML
To investigate whether IGFBP7, GFI1, or RARA levels in AML cell lines and primary AML at diagnosis are predictive for the increase in ATRA sensitivity after rhIGFBP7, we measured their expression in AML cell lines (supplemental Figure 5M-O) and AML samples responsive or nonresponsive to rhIGFBP7-induced ATRA sensitivity (Figure 6B-D). We did not observe a correlation between the expression levels of IGFBP7 and GFI1 and response to ATRA, rhIGFBP7, or the combination in the cell lines. In OCI-AML3 cells, high RARA levels might explain their sensitivity to ATRA monotherapy. In primary AML, we did not observe a significant difference in IGFBP7 and GFI1 expression between responders and nonresponders; however, a significantly higher level of RARA was observed in the responders. This result suggests that an elevated level of RARA is an indicator for sensitivity to rhIGFBP7-induced ATRA responses in primary AML. Notably, there was a significant inverse correlation between GFI1 and RARA expression in AML cases responsive to rhIGFBP7-induced ATRA sensitivity (Figure 6E; for responders, R = −0.706 and P = .0061; for nonresponders, R = −0.265 and P = .428). Thus, our results indicate that rhIGFBP7 reduces GFI1 levels, likely resulting in reduced GFI1 complexes at the chromatin, activation of GFI1 target gene transcription, and an ATRA-susceptible transcriptional program. This effect of rhIGFBP7 might be especially present in non-APL AML cases that have high RARA levels in combination with relatively low GFI1.
Discussion
Defective differentiation of normal hematopoietic cells, resulting in accumulation of immature myeloid cells, is a general feature of AML.1 Over the past decades, AML patients have been treated with standard induction chemotherapy, consisting of cytarabine and an anthracycline, followed in some cases by a stem cell transplantation. Unfortunately, despite high complete remission rates, many AML patients still relapse with these treatment protocols.47 APL is the only AML subtype that is highly curable by an alternative treatment consisting of ATRA and arsenic trioxide.2 ATRA-based treatment has not been very effective for any other AML subtype. However, preclinical studies suggest that a subset of non-APL AML cases are sensitive to ATRA-induced differentiation and cell death,18-21 and inhibition of the epigenetic modifiers LSD1 and GCN5 can enhance sensitivity to ATRA in AML.23,24 Based on these studies, it is believed that AML cells may require a particular transcriptional state to be responsive to ATRA or that transcriptional reprogramming may enhance ATRA sensitivity.
We previously demonstrated that IGFBP7, a tumor suppressor and negative regulator of IGF1R activity, induces differentiation and/or cell death, as well as sensitizes primary AML cells to chemotherapy-induced leukemia cell death.30,31 IGFBP7 is upregulated in APL,33,48 and we showed in this study that IGFBP7 plays a role in sensitivity to retinoic acids in APL. In APL cells, susceptibility to ATRA is dependent on expression, function, and localization of several coactivators, transcription factors, and epigenetic modifiers. The majority of PML-RARα DNA binding sites in APL cells are in close proximity to consensus binding sites for the transcription factors PU.1, ETS, and AP1, indicating that PML-RARα cooperates with these factors to generate an ATRA-susceptible transcriptional program.49 Moreover, PML-RARα interacts with proteins that are important for normal hematopoietic differentiation, such as GFI1, HOXA9A, MEIS1, and RUNX1.48,50 GFI1 is a target gene of the PML-RARα fusion protein and is necessary for the maintenance of APL cells.51 Combined treatment using LSD1 inhibitors and retinoic acids allows differentiation and growth arrest of APL cells without affecting the stability of PML-RARα and its recruitment to chromatin.27
In primary non-APL, rhIGFBP7 treatment reduced GFI1 and led to increased sensitivity for ATRA-induced responses. GFI1 is a transcriptional repressor interacting with the REST corepressor 1 (CoREST) complex and LSD1 to regulate gene expression and inhibit p53 activity, and depletion of LSD1 enhances transcription of GFI1 targets.52,53 We observed that rhIGFBP7 treatment of AML cells activated a gene expression program associated with regulation of cell death pathways, including activation of p53, and reduced GFI1, thereby likely leading to GFI1 transcriptional target activation and induction of an ATRA-susceptible transcriptional program. Previously, GFI1 has been identified as a p53 target gene controlling the quiescence of HSCs,54 and inhibition of GFI1 induced p53-dependent proapoptotic responses and blocked the expansion of leukemia cells.55 Inhibitors of LSD1 disrupt the interaction between LSD1 with GFI1, thereby targeting the GFI1/CoREST complex for disruption and release from the chromatin.27,29 Because disruption of this complex is required for leukemia cells to differentiate,29 rhIGFBP7 is expected to reduce GFI1 levels, leading to fewer GFI1 complexes on the chromatin and enhanced sensitivity for ATRA-induced differentiation. Pharmacological inhibition of LSD1 mimics depletion of GFI1,27 and activation of ATRA-driven responses by rhIGFBP7 might mimic LSD1 inhibition by reducing GFI1. LSD1 interacts with the chromatin, in different cell types, through distinct complexes of epigenetic modifiers and transcription factors,56 and inhibition of LSD1 was demonstrated to interfere with GFI1-mediated repression of PU.1 target gene expression.41 Sensitivity to ATRA after LSD1 inhibition or rhIGFBP7 may require different and similar proteins at the chromatin sites of the target genes, explaining the variation in response profiles in the different AML cases.
In general, AML cases responding to rhIGFBP7-ATRA therapy have greater numbers of CD34-expressing blasts and elevated WBCs. Because these cases contain more immature leukemia cells, these cells may have specific protein complexes at the chromatin of myeloid differentiation genes required for induction of ATRA responses after lowering GFI1. Notably, the transcriptome of low GFI1-expressing human leukemia cells have a resemblance to the transcriptome of LSCs,41 and reduced GFI1 marks AML cases with an adverse prognosis.41,57 Consistent with these findings, we demonstrated that low GFI1 levels are a characteristic of the subgroup of EVI-1+ AML cases. EVI-1+ AML samples are sensitive to ATRA-driven responses,21 have a stem cell phenotype,58,59 and have reduced GFI1 levels, suggesting that low levels of GFI1, or the change in the transcriptome associated with downregulation of GFI1, in the context of an immature AML phenotype may convert cells to an ATRA-susceptible state. AML with low GFI1 has a poor response to chemotherapy,41,57 but it may have an efficient response to ATRA-based treatment. Epigenetic therapies, such as inhibition of HDACs, have become more prevalent for AML patients who are not eligible for standard chemotherapy. However, patients with low GFI1 in their blasts are often resistant to HDAC inhibitors,41 and ATRA-based therapies may be a successful treatment for these patients. Moreover, AML cells that contain a strong superenhancer at the RARA gene locus, and consequently have high RARA expression, are more sensitive to retinoic acid–induced treatment.45 We observed that responders to rhIGFBP7 and ATRA combination therapy have elevated RARA, as well as a significant inverse correlation between GFI1 and RARA expression.
The combination of rhIGFBP7 and ATRA, as well as both monotherapies, did not induce differentiation or cell death in normal hematopoietic cells and HSCs. This result is consistent with previous data showing that inhibition of the retinoic acid receptor results in expansion of normal CD34+CD38− cells and enhances the engraftment potential of normal hematopoietic repopulating cells.60 Moreover, treatment with ATRA antagonized stress-induced activation of HSCs, whereas induction of differentiation or cell death was not affected in HSCs.61
Together, our results demonstrated that IGFBP7 is part of ATRA-driven responses in APL cells. We showed that treatment of primary AML cells with rhIGFBP7 can enhance ATRA-induced differentiation, can reduce AML cell viability, and, importantly, can increase ATRA-driven reduction in AML progenitor and stem cells. These observations suggest that treatment of AML patients with a combination of rhIGFBP7 and ATRA might prove to be an effective therapy in a subset of non-APL AML patients to prevent relapse and improve patient survival, which has to be confirmed in further clinical studies. Moreover, in light of the ongoing clinical trials evaluating the effects of LSD1 inhibition in combination with ATRA, it might be of interest to add rhIGFBP7 to this combination therapy to enhance successful induction of differentiation and/or cell death in a large group of AML patients.
Data sharing requests should be sent to Linda Smit (li.smit@amsterdamumc.nl).
Acknowledgments
The authors thank R. van Oorschot and B. A. van der Reijden (Department of Laboratory Medicine, Radboud University Medical Center, Nijmegen, The Netherlands) for providing the GFI1 plasmids and E. de Miguel (Department of Molecular Cell Biology and Immunology, Amsterdam UMC, location VUmc) for technical assistance with imaging and image analysis.
N.v.G., A.R., and E.V. are supported by a grant from the Dutch Cancer Society (#6868). H.J.M.P.V. is supported by a Cancer Center Amsterdam grant.
Authorship
Contribution: N.v.G., H.J.M.P.V., A.R., M.-L.T., E.V., E.D., F.B., F.D., and F.L.K. conducted the experiments; N.v.G., H.J.M.P.V., and L.S. designed experiments; J.J.W.M.J. and G.J.O. provided AML patient samples; R.X.M. performed data analysis; N.v.G. and L.S. wrote the manuscript; and H.J.M.P.V. and G.J.O. revised the manuscript.
Conflict-of-interest disclosure: The authors declare no competing financial interests.
Correspondence: Linda Smit, Department of Hematology, Amsterdam UMC, Location VUmc, Cancer Center Amsterdam, De Boelelaan 1117, 1081 HV Amsterdam, The Netherlands; e-mail: li.smit@amsterdamumc.nl.

