

Key Points
BCR-ABL–induced senescence accelerates megakaryocyte-lineage differentiation.
Senescent megakaryocyte-lineage cell-derived TGF-β contributes to the maintenance of the CML cell leukemogenic capacity.

Abstract
BCR-ABL, an oncogenic fusion gene, plays a central role in the pathogenesis of chronic myeloid leukemia (CML). Oncogenic signaling induces oncogene-induced senescence and senescence-associated secretory phenotype (SASP), which is characterized by enhanced production of various cytokines. BCR-ABL gene transduction confers senescent phenotype in vitro; however, the in vivo relevance of senescence has not been explored in this context. Transplantation of BCR-ABL–expressing hematopoietic stem/progenitor cells caused CML in mice with an increase in bone marrow BCR-ABL+CD41+CD150+ leukemic megakaryocyte-lineage (MgkL) cells, which exhibited enhanced senescence-associated β-galactosidase staining and increased expression of p16 and p21, key molecules that are crucially involved in senescence. Moreover, knockout of p16 and p21 genes reduced both BCR-ABL–induced abnormal megakaryopoiesis and the maintenance of CML cell leukemogenic capacity, as evidenced by attenuated leukemogenic capacity at secondary transplantation. The expression of transforming growth factor-β1 (TGF-β1), a representative SASP molecule, was enhanced in the leukemic MgkL cells, and TGF-β1 inhibition attenuated CML cell leukemogenic capacity both in vitro and in vivo. Furthermore, BCR-ABL–expressing MgkL cells displayed enhanced autophagic activity, and autophagy inhibition reduced bone marrow MgkL cell number and prolonged the survival of CML mice, which had transiently received the tyrosine kinase inhibitor, imatinib, earlier. Thus, BCR-ABL induced the expansion of senescent leukemic MgkL cells, which supported CML leukemogenesis by providing TGF-β1.
Introduction
Cellular senescence was originally discovered as telomere attrition-induced irreversible cell-cycle arrest in the presence of sustained metabolic activity and viability.1,2 Subsequent studies revealed that cellular senescence can be induced by various other conditions such as irreversible DNA damage and exposure to genotoxic agents.3,4 Moreover, the activation of oncogenes such as Ras and Raf or the inactivation of tumor suppressor genes such as PTEN, also cause senescence, which is called oncogene-induced senescence (OIS).5,6 OIS was initially presumed to exert antitumorigenic activities by preventing abnormal proliferation of cells that are at risk for malignant transformation under oncogenic stress.7 However, OIS can simultaneously activate a distinct set of transcription factors, including nuclear factor-κB and C/EBP-β, and thereby induce senescence-associated secretory phenotype (SASP), which is characterized by the robust expression of pro-inflammatory cytokines such as interleukin-1 (IL-1), IL-6, CXCL8, and transforming growth factor-β1 (TGF-β1), which exert pro-tumorigenic activities.8 Thus, OIS plays distinct roles in tumor development and progression in a context-dependent manner.
Chronic myeloid leukemia (CML) arises from the clonal expansion of leukemia-initiating cells (LICs), which are transformed from hematopoietic stem cells by the action of the BCR-ABL fusion protein, which exhibits constitutive tyrosine kinase activity resulting from a reciprocal translocation between chromosomes 9 and 22.9,10 At the initiation stage of CML, a few BCR-ABL–expressing LICs compete with the large population of normal hematopoietic cells for bone marrow (BM) space. Subsequently, LICs differentiate and generate a large number of various myeloid-lineage cells including neutrophils, basophils, and eosinophils, and, to a lesser extent, megakaryocyte-lineage (MgkL) cells, to overwhelm normal hematopoiesis and occupy BM space.9,11-13 We previously revealed that basophil-like leukemia cells constitutively and abundantly expressed a chemokine, CCL3, which inhibits normal hematopoiesis, thereby promoting predominantly leukemia-tropic hematopoiesis in CML BM.14,15 However, the contribution of the increased MgkL cells to CML pathogenesis remains unclear.
Several lines of evidence indicate an association between SASP-related cytokine expression and CML pathology. Reynaud et al observed that BCR-ABL activity induced the expression of IL-6, which induced CML multipotent progenitor cells to differentiate toward a myeloid lineage, thereby sustaining CML development.16 Moreover, CML BM exhibited increased expression of other SASP-related cytokines, including IL-1α and IL-1β,17 which contribute to the maintenance of CML cell stemness.18 More direct evidence to indicate the association of senescence with CML was provided by Wajepeyee et al, who reported that the BCR-ABL gene induced senescence in fibroblasts and hematopoietic progenitor cells in vitro,19 although they did not evaluate its role in vivo. These observations prompted us to investigate the presence and identity of senescent cells in the BM of a CML mouse model. We reveal that CML BM displays expansion of senescent MgkL cells, which provides the CML cells with TGF-β1 to maintain their leukemogenic capacity, thereby contributing to CML progression rather than its initiation.
Materials and methods
Mice
Specific pathogen-free male C57BL/6J mice (wild-type [WT]; 5-7 weeks old) were purchased from Charles River Japan. p16−/−/p21−/− double knockout mice (DKO mice) were prepared as described in a previous study.20 All mice were maintained under specific pathogen-free conditions. All the animal experiments in this study were approved by the Committee on Animal Experimentation of the Kanazawa University and complied with the Guideline for the Care and Use of Laboratory Animals of the Kanazawa University.
Reagents and antibodies
All the reagents and antibodies used in this study are described in the supplemental Methods.
Cell preparation
Femoral and/or tibial bones were flushed out with cold magnetic-activated cell separation buffer (phosphate-buffered saline supplemented with 2 mM EDTA and 3% fetal bovine serum) to obtain total BM cells. The cells were further separated by density gradient centrifugation using Histopaque-1083 reagent (Sigma-Aldrich), and then the lineage marker (CD4, CD8, CD11b, Gr-1, B220, and TER-119)−c-kit+Sca-1+ cells were sorted using a FACSAria III cell sorter (BD Biosciences) and designated as KLS+ BM cells. Flow cytometric analysis of BM and peripheral blood (PB) was conducted after the erythrocytes were depleted using ammonium chloride lysis buffer containing 0.826% NH4Cl, 0.1% KHCO3, and 0.004% EDTA-4Na.
Preparation of retroviral vector for KLS infection, and induction of the CML model
Retroviral packaging cells (Phoenix 293T) were transiently transfected with MSCV-BCR-ABL–ires-GFP plasmid, which simultaneously drives BCR-ABL and GFP expression, using jetPRIME transfection reagent (Polyplus-transfection) to produce the retroviral vector in the culture supernatant.21 MSCV-ires-GFP retroviral vectors were prepared using the same protocol to transduce the LICs in certain experiments. To obtain LICs, WT- or DKO-derived KLS+ BM cells were purified using a flow cytometer, cultured in serum-free S-Clone SF-03 medium supplemented with 1% bovine serum albumin, 100 ng/mL stem cell factor (Wako Chemicals), 100 ng/mL thrombopoietin, 25 ng/mL FMS-like tyrosine kinase-3 ligand (R&D Systems), 10 ng/mL IL-6 (PeproTech), and 10 ng/mL IL-3 (PeproTech) for 1 day, and thereafter infected with the resulting vector using ViroMag R/L kit (OZ Bioscience). The transduced KLS+ cells were transplanted intravenously into lethally irradiated (7 Gy) WT mice along with 1 × 10⁶ BM mononuclear cells from WT mice. For the secondary transplantation, 5 × 10⁴ GFP+ lineage−c-kit+ BM cells were collected from the CML mice and transplanted into lethally irradiated WT mice along with 1 × 10⁶ normal BM mononuclear cells from WT mice.
Experimental analysis
The experimental procedures for immunohistochemical analysis, extraction of BM-nonhematopoietic cell, colony-forming assay, quantitative reverse transcription polymerase chain reaction (qRT-PCR), flow cytometry, autophagosome staining, generation of culture supernatants, analysis of BM cells in CML patients, cell viability assay, and cell-cycle assay are described in detail in the supplemental Methods.
Statistical analysis
The data were statistically analyzed using the methods indicated in each figure legend. P < .05 was considered statistically significant.
Results
BCR-ABL–induced senescence is indispensable for maintenance of CML cell leukemogenic capacity
The ability of BCR-ABL to induce senescence in vitro19 prompted us to examine whether BCR-ABL induced senescence in vivo in a mouse CML model. BM was obtained 3 weeks after the transplantation of LICs into lethally irradiated WT mice, following the development of CML. The characteristic senescence marker, senescence-associated β-galactosidase (SA-β-Gal) was expressed at a higher level in the BCR-ABL+ cells than in the BCR-ABL− cells (Figure 1A; supplemental Figure 1A). In contrast, control GFP gene transduction did not enhance the expression of SA-β-Gal (Figure 1B; supplemental Figure 1A), indicating that retrovirus transfection alone cannot induce senescence. Moreover, 2 senescence-related molecules, p16 and p21, were detected more abundantly in CML BM, compared with untreated BM (Figure 1C). Consistently, CML mouse-derived total BM cells exhibited enhanced messenger RNA (mRNA) expression of the senescence-related molecules, p16, p21, and p53, compared with the untreated ones (Figure 1D). Thus, BCR-ABL induces senescence in CML mouse BM. To clarify the pathological relevance of senescence in CML development, we transduced BCR-ABL gene into KLS+ cells obtained from p16−/−/p21−/− DKO mice, which cannot undergo senescence.20 Consistently, total BM cells derived from DKO-CML mice exhibited mRNA expression of p53, another driver molecule for senescence than p16 and p21, at a similar level as those derived from untreated DKO mice did (Figure 2A). Additionally, SA-β-Gal activity was expressed in BCR-ABL+ cells purified from DKO-CML BM, to a similar extent in BCR-ABL- cells (Figure 2B; supplemental Figure 1A). Thus, the p16−/−/p21−/− double knockout abrogates BCR-ABL–induced senescence. LIC transplantation progressively increased the number of PB white blood cells, and the number and frequency of BCR-ABL+ cells to similar extent, regardless of whether the LICs were derived from WT or DKO mice (supplemental Figure 2). Consistently, no significant differences were observed in terms of the median survival and LIC numbers in the BM between mice receiving WT- and DKO-derived LICs (Figure 2C,E; supplemental Figure 3). These observations would indicate few effects of BCR-ABL–induced senescence on primary CML development. On the contrary, the survival rates improved remarkably (with reduction in BM LICs, PB white blood cells, BCR-ABL+ cells, and spleen size) in mice that received DKO-derived leukemia cells at the secondary transplantation, compared with those that received WT-derived leukemia cells (Figure 2D,F; supplemental Figure 4). Thus, the lack of senescence markedly impaired maintenance of CML cell leukemogenic capacity, which is indispensable for CML development at the secondary transplantation. In contrast, GFP-transduced WT- and DKO-derived KLS+ cells exhibited similar levels of hematopoietic reconstitution capacity even at secondary transplantation (Figure 2G), indicating a dispensable role of senescence in maintenance of normal hematopoietic capacity.
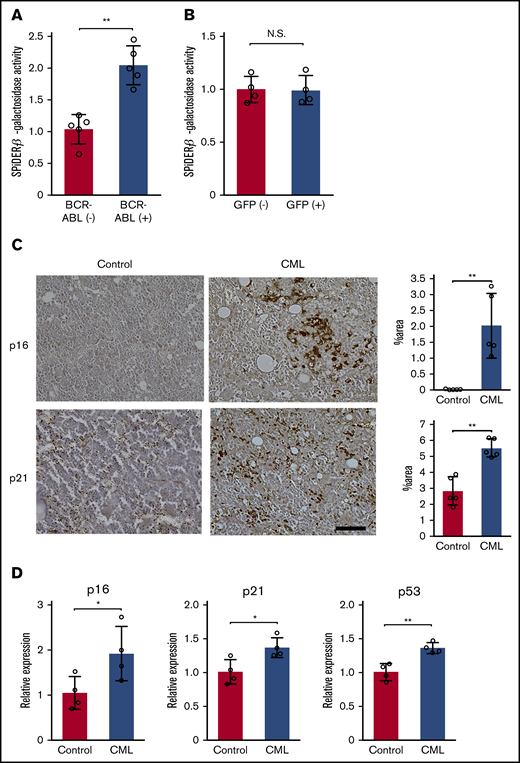
BCR-ABL induces oncogene-induced senescence (OIS) in CML mouse model. (A-B) Quantitative assessment of SPiDER-β-galactosidase activity in BM obtained from CML mice (A) and mice that were transplanted with GFP-transduced KLS+ cells (B). BCR-ABL+ or BCR-ABL− cells were purified from total BM cells obtained from LIC recipients 3 weeks following the BM transplantation (n = 5). GFP+ or GFP− cells were purified from the total BM cells 18 days after the BM transplantation with GFP-transduced KLS+ cells (n = 4). SPiDER-β-galactosidase activity was determined in each purified cell fraction, and normalized to the averaged value of BCR-ABL− cells or GFP− cells. (C) Immunohistochemical analysis of p16 and p21 expression in BM. BMs were obtained from LIC recipients 3 weeks after the transplantation or from age-matched untreated mice, and immunostained with either anti-p16 or anti-p21 antibodies. Representative results from 5 mice are shown on the left (original magnification, ×100; scale bar, 50 μm). Positive areas were quantified in 5 individual animals as described in "Materials and methods" (right). (D) Expression levels of senescence-related genes in BM. Total RNA was extracted from BMs obtained from the LIC recipients 3 weeks after the transplantation or from age-matched untreated mice, and subjected to qRT-PCR (n = 5). The expression level was calculated relative to Gapdh gene and was subsequently normalized to the averaged value of the control. Data are presented as the mean ± standard deviation (SD). Statistical significance was evaluated using the 2-sided Student t test. *P < .05; **P < .01. N.S., not significant.
BCR-ABL induces oncogene-induced senescence (OIS) in CML mouse model. (A-B) Quantitative assessment of SPiDER-β-galactosidase activity in BM obtained from CML mice (A) and mice that were transplanted with GFP-transduced KLS+ cells (B). BCR-ABL+ or BCR-ABL− cells were purified from total BM cells obtained from LIC recipients 3 weeks following the BM transplantation (n = 5). GFP+ or GFP− cells were purified from the total BM cells 18 days after the BM transplantation with GFP-transduced KLS+ cells (n = 4). SPiDER-β-galactosidase activity was determined in each purified cell fraction, and normalized to the averaged value of BCR-ABL− cells or GFP− cells. (C) Immunohistochemical analysis of p16 and p21 expression in BM. BMs were obtained from LIC recipients 3 weeks after the transplantation or from age-matched untreated mice, and immunostained with either anti-p16 or anti-p21 antibodies. Representative results from 5 mice are shown on the left (original magnification, ×100; scale bar, 50 μm). Positive areas were quantified in 5 individual animals as described in "Materials and methods" (right). (D) Expression levels of senescence-related genes in BM. Total RNA was extracted from BMs obtained from the LIC recipients 3 weeks after the transplantation or from age-matched untreated mice, and subjected to qRT-PCR (n = 5). The expression level was calculated relative to Gapdh gene and was subsequently normalized to the averaged value of the control. Data are presented as the mean ± standard deviation (SD). Statistical significance was evaluated using the 2-sided Student t test. *P < .05; **P < .01. N.S., not significant.

BCR-ABL–induced senescence contributes to the maintenance of CML LICs. (A) p53 gene expression in BM. Total RNA was extracted from the BMs obtained from DKO-derived LIC recipients 3 weeks after the transplantation or from age-matched untreated mice and subjected to qRT-PCR (n = 4). The expression level was calculated relative to Gapdh gene and normalized to the averaged value of control. (B) Quantitative assessment of SPiDER-β-galactosidase activity in CML BM. Total BM cells were obtained from the recipients of DKO mouse-derived LICs 3 weeks after the BM transplantation. BCR-ABL+ or BCR-ABL− cells were purified from the total BM cells. SPiDER-β-galactosidase activity was determined in each purified cell fraction, and normalized to the averaged value of BCR-ABL− cells (n = 4). (C) Survival of recipients transplanted with BCR-ABL–transduced WT or DKO LICs. WT mice received 500 LICs from WT or DKO mice, and their survival rates were then evaluated (n = 10). (D) Survival of secondary transplantation recipients. WT mice received 5 × 10⁴ lineage−c-kit+ cells (percentages of LICs in WT and DKO donor cells were 11.9% ± 3.8% and 13.7% ± 3.6%, respectively) obtained from the recipients of the primary transplantation 17 days after the transplantation, and their survival rates were then evaluated (n = 10). LIC numbers in the BM of recipients of the primary (E) and secondary (F) transplantation. LIC numbers in the BM of recipients were determined 20 and 30 days after the primary and secondary transplantation, respectively (n = 4). (G) GFP+KLS+ cell numbers in the BM of recipients 20 days after secondary BM transplantation of control GFP-transduced KL+ cells. (n = 4). Data are presented as the mean ± SD. Statistical significance was evaluated using the 2-sided Student t test (A-B,E-G). Comparison of survival data were performed using log-rank test (C-D). **P < .01.
BCR-ABL–induced senescence contributes to the maintenance of CML LICs. (A) p53 gene expression in BM. Total RNA was extracted from the BMs obtained from DKO-derived LIC recipients 3 weeks after the transplantation or from age-matched untreated mice and subjected to qRT-PCR (n = 4). The expression level was calculated relative to Gapdh gene and normalized to the averaged value of control. (B) Quantitative assessment of SPiDER-β-galactosidase activity in CML BM. Total BM cells were obtained from the recipients of DKO mouse-derived LICs 3 weeks after the BM transplantation. BCR-ABL+ or BCR-ABL− cells were purified from the total BM cells. SPiDER-β-galactosidase activity was determined in each purified cell fraction, and normalized to the averaged value of BCR-ABL− cells (n = 4). (C) Survival of recipients transplanted with BCR-ABL–transduced WT or DKO LICs. WT mice received 500 LICs from WT or DKO mice, and their survival rates were then evaluated (n = 10). (D) Survival of secondary transplantation recipients. WT mice received 5 × 10⁴ lineage−c-kit+ cells (percentages of LICs in WT and DKO donor cells were 11.9% ± 3.8% and 13.7% ± 3.6%, respectively) obtained from the recipients of the primary transplantation 17 days after the transplantation, and their survival rates were then evaluated (n = 10). LIC numbers in the BM of recipients of the primary (E) and secondary (F) transplantation. LIC numbers in the BM of recipients were determined 20 and 30 days after the primary and secondary transplantation, respectively (n = 4). (G) GFP+KLS+ cell numbers in the BM of recipients 20 days after secondary BM transplantation of control GFP-transduced KL+ cells. (n = 4). Data are presented as the mean ± SD. Statistical significance was evaluated using the 2-sided Student t test (A-B,E-G). Comparison of survival data were performed using log-rank test (C-D). **P < .01.
BCR-ABL induces expansion of senescent phenotypic MgkL cells
To identify the types of senescent cells in CML BM, the BMs were immunostained with antibodies against the senescence-related molecules, p16 and p21. The analysis revealed that p16 and p21 proteins were preferentially expressed in large polynuclear cells morphologically recognized as megakaryocytes (Figure 3A). CML-bearing WT mouse BM exhibited an increase in cells expressing the megakaryocyte markers, CD41 and CD150, but this cell population was not increased in the BM of mice transplanted with control GFP gene-transduced KLS+ cells (Figure 3B). Consistently, CD41+CD150+ population selectively expressed a megakaryocyte-specific molecule, platelet factor 4 (supplemental Figure 5) but not a stem cell marker, c-kit (supplemental Figure 6). Thus, we denoted CD41+CD150+ cells as MgkL population in the subsequent animal experiments. Expanding BCR-ABL+CD41+CD150+ MgkL cells displayed increased p16 and p21 mRNA expression, compared with the total cell fraction, CD16/32+ myeloid, KLS+, and BCR-ABL− MgkL cells (Figure 3C). Moreover, BCR-ABL+CD41+CD150+ MgkL cells, but not the other cell populations, arrested in G0 or G1 phase (supplemental Figure 7). These observations indicate that BCR-ABL induced senescence selectively in MgkL cells. Furthermore, an increase in MgkL cell numbers in the BM was attenuated in the DKO-CML mice (Figure 3B), implying an association of BCR-ABL–induced senescence with increased MgkL cells in CML mice. Consistently, the platelet number in the PB was lower in the DKO-CML mice compared with that in the WT CML mice (supplemental Figure 8). We next examined the expression of SASP-related molecules, TGF-β1, IL-6, and IL-1α in CML BMs. As expected, BCR-ABL+ total and myeloid cells in CML BMs showed increased gene expression of IL-6 and IL-1α compared with BCR-ABL− cells, whereas BCR-ABL+ MgkL cells exhibited augmented gene expression of TGF-β1 in addition to IL-6 and IL-1α compared with hematopoietic cells as well as BM stroma cells (Figure 3C; supplemental Figure 9). Consistently, protein expression of p16, p21, and TGF-β1 was detected in the BCR-ABL+ MgkL cells and to a lesser extent in the BCR-ABL− cells in CML BMs (Figure 3D-E). Thus, gene expression of senescence-related molecules and TGF-β1 was increased selectively in BCR-ABL+ MgkL cells in CML BMs.

Expansion of BCR-ABL+senescent MgkL cells expressing TGF-β in BM of CML mouse. (A) Immunohistochemical staining of BM obtained from CML or untreated mice. BMs were obtained from LIC recipients 3 weeks after the transplantation and subjected to immunohistochemical analysis using anti-p16 (upper) or anti-p21 antibodies (lower). Representative results from 5 individual experiments are shown. Arrows indicate the cells which were morphologically identified as megakaryocytes. Original magnification, ×200. Insets indicate high-power magnification images (×400). Scale bars, 50 μm. (B) CD150+CD41+ MgkL cells in the BM from LIC recipient mice or the mice transplanted with control GFP-transduced KLS+ cells. BMs were obtained from WT- or DKO-derived LIC recipients or the mice transplanted with control GFP-transduced KLS+ cells at the indicated time intervals after the transplantation. Flow cytometric analysis was conducted. Upper panels show representative results obtained from 4 WT-derived LIC recipients 3 weeks after the transplantation. Lower panels show the proportion (left) and absolute numbers (right) of CD150+CD41+ MgkL cells in BCR-ABL+ or BCR-ABL− populations (n = 4). (C) Expression of senescence-associated and SASP-related molecules. BM cells were obtained from WT-derived LIC recipients 3 weeks after the transplantation and fractionated according to expression level of BCR-ABL and surface markers. Total RNA was extracted from the obtained cell fractions and subjected into qRT-PCR to determine senescence-associated (upper) and SASP-related molecules (lower) (n = 4 or 5). The expression level was calculated relative to Gapdh gene and normalized to the averaged value of BCR-ABL− total cells. (D) Protein expression of intracellular p16 and intranuclear p21. Mean fluorescence intensities (MFIs) were determined in each fraction (n = 4). (E) Intracellular TGF-β1 expression. MFIs were determined for each fraction (n = 6). Data are presented as the mean ± SD. Statistical significance was evaluated using 1-way analysis of variance (ANOVA) with Tukey’s multiple-comparisons test. *P < .05; **P < .01.
Expansion of BCR-ABL+senescent MgkL cells expressing TGF-β in BM of CML mouse. (A) Immunohistochemical staining of BM obtained from CML or untreated mice. BMs were obtained from LIC recipients 3 weeks after the transplantation and subjected to immunohistochemical analysis using anti-p16 (upper) or anti-p21 antibodies (lower). Representative results from 5 individual experiments are shown. Arrows indicate the cells which were morphologically identified as megakaryocytes. Original magnification, ×200. Insets indicate high-power magnification images (×400). Scale bars, 50 μm. (B) CD150+CD41+ MgkL cells in the BM from LIC recipient mice or the mice transplanted with control GFP-transduced KLS+ cells. BMs were obtained from WT- or DKO-derived LIC recipients or the mice transplanted with control GFP-transduced KLS+ cells at the indicated time intervals after the transplantation. Flow cytometric analysis was conducted. Upper panels show representative results obtained from 4 WT-derived LIC recipients 3 weeks after the transplantation. Lower panels show the proportion (left) and absolute numbers (right) of CD150+CD41+ MgkL cells in BCR-ABL+ or BCR-ABL− populations (n = 4). (C) Expression of senescence-associated and SASP-related molecules. BM cells were obtained from WT-derived LIC recipients 3 weeks after the transplantation and fractionated according to expression level of BCR-ABL and surface markers. Total RNA was extracted from the obtained cell fractions and subjected into qRT-PCR to determine senescence-associated (upper) and SASP-related molecules (lower) (n = 4 or 5). The expression level was calculated relative to Gapdh gene and normalized to the averaged value of BCR-ABL− total cells. (D) Protein expression of intracellular p16 and intranuclear p21. Mean fluorescence intensities (MFIs) were determined in each fraction (n = 4). (E) Intracellular TGF-β1 expression. MFIs were determined for each fraction (n = 6). Data are presented as the mean ± SD. Statistical significance was evaluated using 1-way analysis of variance (ANOVA) with Tukey’s multiple-comparisons test. *P < .05; **P < .01.
BCR-ABL induces in vitro differentiation of TGF-β1–expressing MgkL cells
To further define the role of BCR-ABL–induced senescence in CML MgkL cells, we performed in vitro colony formation assay using BCR-ABL+ and BCR-ABL− KLS+ cells. The CD41+CD150+ proportion progressively increased in WT-derived BCR-ABL+ but not BCR-ABL− colonies and the increment was attenuated in DKO-derived colonies (Figure 4A), similar to that observed in the CML mouse model. Moreover, CD41+CD150+ cells in colony formation assay exhibited enhanced expression of platelet factor 4 (supplemental Figure 10A) and preferentially differentiated into cells resembling typical megakaryocytes with multiple nuclear lobes (supplemental Figure 10B). Thus, CD41+CD150+ cells could be denoted as MgkL cells in colony formation assay also. Consistent with the mouse model, p16 and p21 mRNA expression, and SA-β-Gal staining were selectively enhanced in BCR-ABL+ MgkL cells, compared with the other cell populations (Figures 4B; supplemental Figure 11). In contrast, control GFP gene transduction did not enhance SA-β-Gal staining (supplemental Figures 1B and 12A) and the frequency of MgkL cells (supplemental Figure 12B), irrespective of the presence of p16 and p21 genes. TGF-β1 and IL-6 expression was selectively augmented in BCR-ABL+ MgkL cells, compared with the other cell populations, whereas IL-1α expression was increased in BCR-ABL+ MgkL and CD16/32+ myeloid-lineage cells, compared with BCR-ABL− cells (Figure 4C). However, only increased TGF-β1 expression was abrogated in DKO-derived colonies (Figure 4C). Moreover, TGF-β1 protein was detected in BCR-ABL+ MgkL cells, and to a lesser extent in BCR-ABL− cells (Figures 4D), consistent with a previous report.21 In contrast, increased intracellular TGF-β1 expression was abrogated in DKO-derived MgkL cells (Figure 4D). Altogether, BCR-ABL–induced senescence contributes to the expansion of the TGF-β1–expressing MgkL population.

Expansion of BCR-ABL+senescent MgkL cells expressing TGF-β in colony formation assay. (A) The frequency of CD150+CD41+ MgkL cells of in vitro colony formation assay of BCR-ABL–transduced and nontransduced WT cells or DKO cells. The frequency was determined at the indicated time (n = 4 or 5). Senescence-associated (B) and SASP-related (C) gene expression. Either CD16/32+ myeloid-lineage or CD41+CD150+ MgkL cells were purified from in vitro colony formation assay of BCR-ABL–transduced and nontransduced WT cells or DKO cells on day 9. Total RNA was extracted from each cell population and subjected to qRT-PCR to determine the mRNA expression (n = 3 or 5). The expression level was calculated relative to the Gapdh gene and normalized to the averaged value of BCR-ABL− myeloid-lineage cells. (D) Intracellular TGF-β1 expression. Cells were recovered from in vitro colony formation assay of BCR-ABL–transduced WT- (left) or DKO-derived KLS+ cells (right) on day 9 and subjected to intracellular TGF-β1 staining. Intracellular TGF-β1 expression was determined in each cell population using flow cytometry. MFIs were determined for each cell population (n = 4) and normalized to the averaged value of BCR-ABL− total cells. Data are presented as the mean ± SD. Statistical significance was evaluated using the 1-way ANOVA with Tukey’s multiple-comparisons test. *P < .05; **P < .01.
Expansion of BCR-ABL+senescent MgkL cells expressing TGF-β in colony formation assay. (A) The frequency of CD150+CD41+ MgkL cells of in vitro colony formation assay of BCR-ABL–transduced and nontransduced WT cells or DKO cells. The frequency was determined at the indicated time (n = 4 or 5). Senescence-associated (B) and SASP-related (C) gene expression. Either CD16/32+ myeloid-lineage or CD41+CD150+ MgkL cells were purified from in vitro colony formation assay of BCR-ABL–transduced and nontransduced WT cells or DKO cells on day 9. Total RNA was extracted from each cell population and subjected to qRT-PCR to determine the mRNA expression (n = 3 or 5). The expression level was calculated relative to the Gapdh gene and normalized to the averaged value of BCR-ABL− myeloid-lineage cells. (D) Intracellular TGF-β1 expression. Cells were recovered from in vitro colony formation assay of BCR-ABL–transduced WT- (left) or DKO-derived KLS+ cells (right) on day 9 and subjected to intracellular TGF-β1 staining. Intracellular TGF-β1 expression was determined in each cell population using flow cytometry. MFIs were determined for each cell population (n = 4) and normalized to the averaged value of BCR-ABL− total cells. Data are presented as the mean ± SD. Statistical significance was evaluated using the 1-way ANOVA with Tukey’s multiple-comparisons test. *P < .05; **P < .01.
Maintenance of CML cell leukemogenic capacity by MgkL cell-derived TGF-β
TGF-β1 protein levels were increased in the supernatants derived from in vitro MgkL cell culture but not that derived from other cell populations (Figure 5A). To demonstrate that the secreted TGF-β1 was biologically active, we examined the ability of the culture supernatants to induce SMAD2/3 phosphorylation in WT-derived BCR-ABL+ colony-forming cells. Phosphorylation of SMAD2/3 was induced by BCR-ABL+CD41+CD150+ MgkL cell culture supernatants as well as by recombinant TGF-β1 but not by the culture supernatants from BCR-ABL+ total cells or those of BCR-ABL+CD16/32+ myeloid-lineage cells (Figure 5B). Thus, BCR-ABL+ MgkL cells selectively secrete functionally active TGF-β1 in the colony formation assay. The reported capacity of TGF-β to support CML cell stemness22 prompted us to evaluate the recolonization capacity of cells derived from primary colony formation under various conditions at secondary plating (Figure 5C) because this capacity reflects their leukemogenesis. WT BCR-ABL+ colony-derived cells formed larger number of colonies at secondary plating, compared with DKO-derived ones (Figure 5D). The addition of anti-TGF-β1 to WT BCR-ABL+ primary colony formation reduced the number of colonies formed to similar levels as DKO ones. However, the antibody had limited effect on colony numbers arising from the secondary plating of DKO BCR-ABL+ cells (Figure 5D), probably because of the reduced number of MgkL cells that express active TGF-β1. We next treated CML-bearing mice with or without a TGF-β receptor 1 inhibitor at the primary transplantation and subsequently obtained leukemia cells for the secondary transplantation. Consistent with the in vitro data, survival rates were significantly improved in mice receiving leukemia cells which were treated with a TGF-β receptor 1 inhibitor at the primary transplantation, compared with those that received vehicle-treated mouse-derived leukemic cells (Figure 5E). Thus, BCR-ABL–expressing MgkL cells maintain CML cell leukemogenic capacity by providing TGF-β1, a molecule critical to the maintenance of stemness.
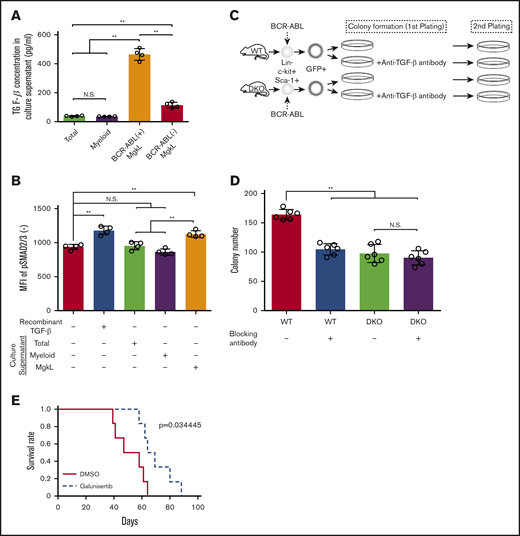
Maintenance of leukemogenic capacity of CML cells by MgkL cell-derived TGF-β1. (A-B) Total, CD41+CD150+ MgkL, or CD16/CD32+ myeloid-lineage cells were purified from BCR-ABL+KLS+-derived colonies on day 9 and incubated for 24 hours to obtain culture supernatants. The supernatants were subjected to enzyme-linked immunoassay for TGF-β1 (A) or added to the culture of total BCR-ABL+ (B) cells to determine the MFIs of intracellular phosphorylated Smad2/3 levels 2 hours later (n = 4). (C) Schematic representation of the experimental procedure of serial colony plating. WT- or DKO-derived BCR-ABL–transduced KLS+ cells were cultured under colony-forming conditions in the presence or absence of a neutralizing anti-TGF-β antibody for 7 days. Ten thousand cells obtained from each colony were subjected to the secondary colony formation assay. (D) Colony formation in the secondary plating. The colonies were counted on day 7 (n = 6). Data are presented as the mean ± SD. (E) Survival of secondary transplantation recipients. WT mice were treated with daily administration of galunisertib or DMSO on days 10 through 16 after the initiation of the primary transplantation. Then, bone marrow cells were obtained from the recipients 17 days after the transplantation. For secondary transplantation, the resultant 5 × 10⁴ lineage−c-kit+ cells were transplanted to other mice, whose survival rates were evaluated (n = 6). Statistical significance was evaluated using the 1-way ANOVA with Tukey’s multiple-comparisons test. Survival rates were compared using the log-rank test. **P < .01.
Maintenance of leukemogenic capacity of CML cells by MgkL cell-derived TGF-β1. (A-B) Total, CD41+CD150+ MgkL, or CD16/CD32+ myeloid-lineage cells were purified from BCR-ABL+KLS+-derived colonies on day 9 and incubated for 24 hours to obtain culture supernatants. The supernatants were subjected to enzyme-linked immunoassay for TGF-β1 (A) or added to the culture of total BCR-ABL+ (B) cells to determine the MFIs of intracellular phosphorylated Smad2/3 levels 2 hours later (n = 4). (C) Schematic representation of the experimental procedure of serial colony plating. WT- or DKO-derived BCR-ABL–transduced KLS+ cells were cultured under colony-forming conditions in the presence or absence of a neutralizing anti-TGF-β antibody for 7 days. Ten thousand cells obtained from each colony were subjected to the secondary colony formation assay. (D) Colony formation in the secondary plating. The colonies were counted on day 7 (n = 6). Data are presented as the mean ± SD. (E) Survival of secondary transplantation recipients. WT mice were treated with daily administration of galunisertib or DMSO on days 10 through 16 after the initiation of the primary transplantation. Then, bone marrow cells were obtained from the recipients 17 days after the transplantation. For secondary transplantation, the resultant 5 × 10⁴ lineage−c-kit+ cells were transplanted to other mice, whose survival rates were evaluated (n = 6). Statistical significance was evaluated using the 1-way ANOVA with Tukey’s multiple-comparisons test. Survival rates were compared using the log-rank test. **P < .01.
Senescence-associated autophagy maintains the survival of BCR-ABL–expressing MgkL cells
Several lines of evidence indicate that senescence ultimately leads to cell death unless senescence-induced autophagy reverses the cell death processes.23,24 Numerous autophagosomes were detected in WT BCR-ABL+ cells, especially in the MgkL cells (supplemental Figure 13), but not in the other types of cells derived from WT or DKO, as revealed by DAPRed staining (Figure 6A-B). The addition of an autophagy inhibitor, SBI-0206965, abrogated DAPRed staining in WT BCR-ABL+ cells, indicating the specificity of the staining. The expression of autophagy-related genes, LC3 and p62, was increased in WT BCR-ABL+ colony-forming cells but not in DKO BCR-ABL+ ones (supplemental Figure 14). In addition to autophagy inhibition, SBI-0206965 reduced MgkL, but not myeloid-lineage cell numbers in WT BCR-ABL+ colony-forming cells (Figure 6C). Moreover, an increased number of MgkL cells died under the culture condition with SBI-0206965 (Figure 6D). Thus, senescence-induced autophagy contributes to in vitro survival of BCR-ABL–expressing MgkL cells. It is well known that CML LICs survive tyrosine kinase inhibitor (TKI) treatment and cause CML recurrence arising from residual LICs even after successive rounds of TKI treatment.25 To examine whether MgkL cells are responsible for the recurrence due to residual LICs, we administered SBI-0206965 to target autophagic MgkL cells after a TKI, imatinib, was discontinued after its brief administration to CML mice (Figure 6E). The treatment with SBI-0206965 following TKI cessation significantly reduced MgkL cell proportion among BCR-ABL+ cells (Figure 6F). Moreover, the interruption of TKI treatment rapidly induced CML progression, leading to death within 16 days after the cessation, but SBI-0206965 administration significantly prolonged the survival (Figure 6G). Thus, BCR-ABL–induced autophagy promotes CML progression following TKI cessation, probably by delaying the cell death of senescent BCR-ABL+ MgkL cells. On the contrary, SBI-0206965 administration alone hardly prevented CML development without TKI treatment (supplemental Figure 15).

MgkL cell survival is maintained by senescence-associated autophagy. (A) DAPRed staining to detect autophagosomes. Cells were purified from the colony formation assay of BCR-ABL–transduced WT- or DKO-derived KLS+ cells on day 5. In some experiments, 5 μM SBI-0206965 was added to the culture. The cells were then subjected to DAPRed staining as described in Materials and methods. Representative results from three independent experiments are shown (original magnification, ×200; scale bar, 50 μm). (B) Flow cytometric analysis of DAPRed staining. Representative results from 4 independent experiments (left). MFIs were determined (right) (n = 4). (C) Number of MgkL and myeloid-lineage cells in the in vitro colony formation assay on day 9. Colonies were formed from 150 BCR-ABL–transduced WT KLS+ cells in the presence or absence of 5 µM SBI-0206965 (n = 4). (D) Number of viable MgkL and c-kit+ progenitor cells. Ten thousand MgkL and progenitor cells purified from the colony formation assay on day 9 were cultured in the presence or absence of 5 µM SBI-0206965 for 1 day (n = 3). (E) Schematic representation of the experimental procedure of the treatment of imatinib (150 mg/kg of body weight/d in a water, oral administration) and SBI-0206965 (20 mg/kg of body weight/d in filter-sterilized vehicle (5% Tween-80, 5% PEG400 in phosphate-buffered saline), intraperitoneal injection). (F) Proportion of CD41+CD150+ MgkL cells in BM. Total BM cells were obtained on day 8 (depicted in panel E) to determine the proportion of CD41+CD150+ MgkL cells among total BM cells (n = 8). Data are presented as the mean ± SD. Statistical significance was evaluated using the 1-way ANOVA with (B) Tukey’s multiple-comparisons test and the (C-D,F) 2-sided Student t test. N.S., not significant; *P < .05; **P < .01. (G) Survival rate of mice following combined treatment with imatinib and SBI-0206965. Survival rates were determined (n = 8). Comparison of survival rates was performed using the log-rank test.
MgkL cell survival is maintained by senescence-associated autophagy. (A) DAPRed staining to detect autophagosomes. Cells were purified from the colony formation assay of BCR-ABL–transduced WT- or DKO-derived KLS+ cells on day 5. In some experiments, 5 μM SBI-0206965 was added to the culture. The cells were then subjected to DAPRed staining as described in Materials and methods. Representative results from three independent experiments are shown (original magnification, ×200; scale bar, 50 μm). (B) Flow cytometric analysis of DAPRed staining. Representative results from 4 independent experiments (left). MFIs were determined (right) (n = 4). (C) Number of MgkL and myeloid-lineage cells in the in vitro colony formation assay on day 9. Colonies were formed from 150 BCR-ABL–transduced WT KLS+ cells in the presence or absence of 5 µM SBI-0206965 (n = 4). (D) Number of viable MgkL and c-kit+ progenitor cells. Ten thousand MgkL and progenitor cells purified from the colony formation assay on day 9 were cultured in the presence or absence of 5 µM SBI-0206965 for 1 day (n = 3). (E) Schematic representation of the experimental procedure of the treatment of imatinib (150 mg/kg of body weight/d in a water, oral administration) and SBI-0206965 (20 mg/kg of body weight/d in filter-sterilized vehicle (5% Tween-80, 5% PEG400 in phosphate-buffered saline), intraperitoneal injection). (F) Proportion of CD41+CD150+ MgkL cells in BM. Total BM cells were obtained on day 8 (depicted in panel E) to determine the proportion of CD41+CD150+ MgkL cells among total BM cells (n = 8). Data are presented as the mean ± SD. Statistical significance was evaluated using the 1-way ANOVA with (B) Tukey’s multiple-comparisons test and the (C-D,F) 2-sided Student t test. N.S., not significant; *P < .05; **P < .01. (G) Survival rate of mice following combined treatment with imatinib and SBI-0206965. Survival rates were determined (n = 8). Comparison of survival rates was performed using the log-rank test.
Pathological contribution of p16- and p21-expressing megakaryocytes in patients with CML
In line with the observations in the mouse CML model, both p16 and p21 were expressed in large polynuclear megakaryocytes, even though the expression of p21 was also observed broadly in mononuclear cells in the BM biopsy specimens obtained from patients with CML (Figure 7A-B). In contrast, few cells expressed p16 and p21 in healthy donor-derived BM biopsy samples (Figure 7C). We next analyzed megakaryocyte numbers at the time of diagnosis in TKI-treated CML patients with regard to their resistance to the TKI treatment, which was assessed as changes in BCR-ABL copy numbers following imatinib or nilotinib treatment. Megakaryocyte numbers were inversely correlated with BCR-ABL copy number changes (Figure 7D), suggesting a possible contribution of megakaryocytes to TKI resistance.
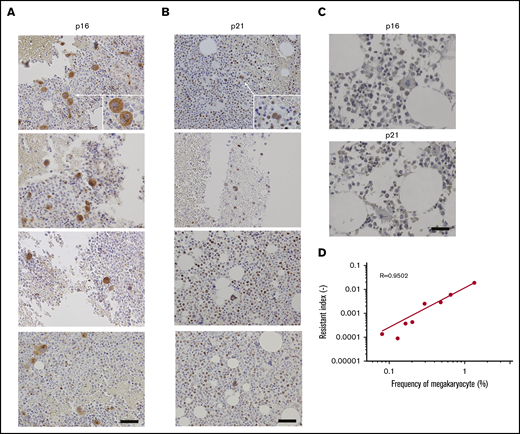
Correlation between TKI resistance and BM megakaryocyte numbers. Immunohistochemical staining for p16 (A) and p21 (B) in the BM biopsy specimens from four individual patients with CML are shown here. Images were obtained using a BX50 microscope using a ×20 objective lens. Scale bars, 20 μm. (C) Immunohistochemical staining for p16 and p21 in the healthy BM biopsy specimens. Representative results from 4 individual samples are shown. Images were obtained with a BZ-X700 microscope. Scale bars, 20 μm. (D) TKI-resistant index and megakaryocyte proportion in total BM cells in CML patients treated with imatinib or nilotinib. Pearson’s correlation coefficient was calculated and the actual R value is shown.
Correlation between TKI resistance and BM megakaryocyte numbers. Immunohistochemical staining for p16 (A) and p21 (B) in the BM biopsy specimens from four individual patients with CML are shown here. Images were obtained using a BX50 microscope using a ×20 objective lens. Scale bars, 20 μm. (C) Immunohistochemical staining for p16 and p21 in the healthy BM biopsy specimens. Representative results from 4 individual samples are shown. Images were obtained with a BZ-X700 microscope. Scale bars, 20 μm. (D) TKI-resistant index and megakaryocyte proportion in total BM cells in CML patients treated with imatinib or nilotinib. Pearson’s correlation coefficient was calculated and the actual R value is shown.
Discussion
The activation of oncogenes such as Ras or B-Raf can induce OIS in fibroblasts and epithelial cells.1 Hematological malignancies arise from the malignant transformation of normal hematopoietic stem/progenitor cells mostly because of the action of oncogenic fusion genes. Cellular senescence can be induced in vitro in fibroblasts and hematopoietic progenitor cells by transfection with several leukemogenic fusion genes including BCR-ABL, CBFB-MYH11, and RUNX-ETO. However, the pathways involved in the induction of senescence in these oncogene-induced leukemia models remain to be elucidated.19 The mixed lineage leukemia fusion gene caused in vivo aberrant expansion of myeloid progenitor cells, which displayed characteristic features of senescence, including SA-β-Gal staining.26 Consistently, we observed that senescence ensued during CML development in mice, as evidenced by enhanced SA-β-Gal expression in BCR-ABL–expressing malignantly transformed cells and enhanced expression of p16 and p21, the master regulatory molecules of senescence, in CML BM. Thus, it is plausible that leukemogenic fusion genes generally induce senescence in the transformed hematopoietic cells.
A hallmark of senescence is irreversible cell-cycle arrest, which is executed mainly by the action of cyclin-dependent kinase (CDK) inhibitors, p16 and p21, encoded by CDKN2A and CDKN1A, respectively. p16 directly interacts with and inhibits CDK4/6 and has a central role in cellular senescence.27 Various senescence-inducing stimuli enhance the expression of p21, which can inhibit a range of CDKs and simultaneously arrest or promote cell-cycle progression in a context-dependent manner.28 Deficiency of p21, but not of p16, induced defects in cell-cycle arrest in response to DNA damage20 or irradiation.29,30 However, p16 and p21 DKO mouse embryonic fibroblasts proliferate without showing any signs of senescence during serial passaging but exhibit senescent phenotype in response to activated Ras transfection.20 On the contrary, BCR-ABL transduction failed to induce cellular senescence in DKO-derived LICs as evidenced by the failure of BCR-ABL to intensify SA-β-Gal staining. These discrepancies may be explained by the differences in the transduced oncogenes and/or the target cell types. Nevertheless, p16 and p21 are required for BCR-ABL–induced senescence in CML BM.
Interestingly, the leukemogenic capacity of DKO-derived LICs was severely impaired at secondary transplantation despite their preserved capacity at the primary transplantation. These observations indicate that DKO-derived LICs with attenuated senescent phenotypes failed to maintain CML cell leukemogenic capacity, which is required for leukemogenesis at secondary transplantation. CML treatment has been revolutionized by the advent of TKIs,31 which target BCR-ABL, the pathogenic protein in CML with constitutive TK activity. However, CML stem cells frequently survive long-term TKI treatment and account for recurrence or relapse even after the so-called molecular remission, when BCR-ABL gene expression is not detectable even with highly sensitive qRT-PCRs.25 Thus, there is an urgent need to develop novel strategies to eradicate CML stem cells to cure the disease. The crucial involvement of senescence in the maintenance of CML cell leukemogenic capacity prompted us to identify the types of cells that display senescent phenotype in BCR-ABL–induced CML. We found that BM transplantation of BCR-ABL–expressing LICs led to MgkL cell expansion in BM, similar to the observation in the BM from CML patients.12 Further, the expanding BCR-ABL–expressing MgkL cells displayed exclusive senescent phenotypes including enhanced SA-β-Gal staining and augmented p16 and p21 expression, in contrast to the observations in primary myelofibrosis (MPN), where the increased megakaryocytes did not exhibit senescent phenotype.32 Augmented megakaryogenesis in MPN patients arises from augmented TPO/MPL signaling resulting from active JAK2 mutation.33 In contrast, the increase in MgkL cells in CML is due to the presence of the oncogene, BCR-ABL. These differences may account for the distinct senescent phenotypes in megakaryocytes between CML and MPN. Nevertheless, the expanding senescent MgkL cells can contribute to CML stem cell maintenance and eventually confer resistance to TKI in CML. This assumption may be supported by the correlation between resistance to the TKIs, imatinib and nilotinib, and BM megakaryocyte numbers at the diagnosis of CML. However, a large-scale clinical study is required to confirm this assumption.
Another hallmark of senescence is SASP, which is characterized by the secretion of numerous inflammatory and growth factors, triggered by the activation of transcription factors including nuclear factor-κB, C/EBPβ, and STATs.8 The WT BCR-ABL–expressing MgkL cells displayed SASP as evidenced by the robust mRNA expression of the SASP-associated molecules, IL-1α, IL-6, and TGF-β1. Accumulating evidence indicates the crucial role of TGF-β1 in the maintenance of stemness of normal hematopoietic stem cells as well as CML stem cells.22,34 Several types of cells have been proposed to be a source of TGF-β1 in normal BM,35,36 but the type of cells that produce TGF-β1 in CML BM remains unclear. In this study, we proved that MgkL cells could maintain CML leukemogenesis by producing TGF-β1, but we cannot completely exclude the possibility that CML cell leukemogenic capacity can be maintained by TGF-β1 or other SASP factors produced by other cell types than MgkL cells. We previously revealed that basophil-like leukemic cells expand in CML BM and abundantly produce the chemokine, CCL3, to inhibit normal hematopoiesis, thereby indirectly favoring leukemogenic hematopoiesis.14,15 Thus, CML cells can remodel a BM microenvironment to facilitate their progression through their differentiation into basophil-like cells or MgkL cells, which produce CCL3 to inhibit normal hematopoiesis and TGF-β1 to support CML stem cell maintenance, respectively.
Macroautophagy, a common form of autophagy, is characterized by the formation of double-membraned cytosolic vesicles, autophagosomes, which sequester cytoplasmic content and deliver it to lysosomes.37 In the Eμ-myc transgenic mouse lymphoma model, autophagy is essential for the maintenance of cell viability under chemotherapy-induced senescence.38 Moreover, autophagy is activated during oncogenic Ras-induced OIS.39 In our model, WT but not DKO BCR-ABL–expressing cells contained a large number of autophagosomes and exhibited enhanced expression of LC3 and p62, molecules with crucial roles in autophagy. Moreover, autophagy inhibition markedly reduced MgkL cell numbers in BM, in line with the following reports. ATG7 KO mice with a defect in autophagy displayed defects in megakaryopoiesis because of enhanced megakaryocyte apoptosis.40 Inhibition of autophagy impaired megakaryocytic differentiation in the CML cell line, K562.41 Given that autophagy sustains cell survival by generating nutrients from degradation products, it may prevent death of BCR-ABL–expressing senescent MgkL cells, that would otherwise succumb, thereby leading to the accumulation of leukemic MgkL cells in CML BM. Thus, the administration of an autophagy inhibitor, after the cessation of imatinib, prolonged the survival of CML mice mainly by depleting senescent MgkL cells, which maintain CML cell leukemogenic capacity. However, the direct effect of the autophagy inhibitor on CML stem cells remains unclear.42 Moreover, MgkL cells expanding in the patients with CML should be characterized more precisely, especially about the roles of autophagy in their cellular physiology.
Send data sharing requets via e-mail to the corresponding author, Tomohisa Baba, at sergenti@staff.kanazawa-u.ac.jp.
Acknowledgments
This work was supported in part by Kakenhi grant number 17K19681 (Japan Society for the Promotion of Science) and Extramural Collaborative Research Grant of Cancer Research Institute, Kanazawa University.
Authorship
Contribution: Y.T. performed and analyzed the experiments in their entirety; S.K. and E.H. provided DKO mice and supervised the experiments on senescence; T.T., S.M., and N.K. collected and analyzed clinical data; A.H. supervised the hematological experiments; N.M. supervised the entire study and helped with manuscript preparation; and T.B. supervised and analyzed the experiments in their entirety, and prepared the manuscript.
Conflict-of-interest disclosure: The authors declare no competing financial interests.
Correspondence: Tomohisa Baba, Division of Molecular Bioregulation, Cancer Research Institute, Kanazawa University, Kakuma-machi, Kanazawa 920-1192, Japan; e-mail: sergenti@staff.kanazawa-u.ac.jp.

