

Key Points
Combining SKY92 with R-ISS results in a superior prognostic marker compared with either marker separately.
SKY-RISS acts as an immunomodulatory agent predictor. A benefit of MPR-R over MPT-T was seen for HR patients only.

Abstract
The standard prognostic marker for multiple myeloma (MM) patients is the revised International Staging System (R-ISS). However, there is room for improvement in guiding treatment. This applies particularly to older patients, in whom the benefit/risk ratio is reduced because of comorbidities and subsequent side effects. We hypothesized that adding gene-expression data to R-ISS would generate a stronger marker. This was tested by combining R-ISS with the SKY92 classifier (SKY-RISS). The HOVON-87/NMSG-18 trial (EudraCT: 2007-004007-34) compared melphalan-prednisone-thalidomide followed by thalidomide maintenance (MPT-T) with melphalan-prednisone-lenalidomide followed by lenalidomide maintenance (MPR-R). From this trial, 168 patients with available R-ISS status and gene-expression profiles were analyzed. R-ISS stages I, II, and III were assigned to 8%, 75%, and 7% of patients, respectively (3-year overall survival [OS] rates: 80%, 65%, 33%, P = 8 × 10⁻³). Using the SKY92 classifier, 13% of patients were high risk (HR) (3-year OS rates: standard risk [SR], 70%; HR, 28%; P < .001). Combining SKY92 with R-ISS resulted in 3 risk groups: SKY-RISS I (SKY-SR + R-ISS-I; 15%), SKY-RISS III (SKY-HR + R-ISS-II/III; 11%), and SKY-RISS II (all other patients; 74%). The 3-year OS rates for SKY-RISS I, II, and III are 88%, 66%, and 26%, respectively (P = 6 × 10⁻⁷). The SKY-RISS model was validated in older patients from the CoMMpass dataset. Moreover, SKY-RISS demonstrated predictive potential: HR patients appeared to benefit from MPR-R over MPT-T (median OS, 55 and 14 months, respectively). Combined, SKY92 and R-ISS classify patients more accurately. Additionally, benefit was observed for MPR-R over MPT-T in SKY92-RISS HR patients only.
Introduction
Multiple myeloma (MM) is a cancer of plasma cells that primarily affects older persons. The median age at diagnosis is 69 years, with 33% of patients older than 75 years.1 Randomized clinical trials and population-based registries indicate that older patients also benefit from novel agents, such as proteasome inhibitors and immunomodulatory agents (IMiDs), although to a lesser extent than do younger patients.2-7 This is partly explained by a higher incidence of comorbidities, subsequent development of side effects, and premature discontinuation of therapy in older patients, negatively affecting outcome. Because of this reduced benefit/risk ratio, upfront identification of high-risk (HR) patients based on disease and patient characteristics is of utmost importance.
The International Staging System (ISS), based on serum levels of albumin and β2-microglobulin (β2m), represents the most widely used method of identifying HR MM patients.8 It was shown that combining ISS with serum levels of lactate dehydrogenase (LDH) and the cytogenetic markers del(17p), t(4;14), and t(14;16) into the so-called “revised ISS” (R-ISS) improved the prognostic value.9 However, the discriminative power still has room for improvement. One possibility is the addition of gene-expression profile (GEP) classifiers; several have been described.10-13 Here, we investigated the EMC92 classifier, which is based on GEPs from MM patients included in the HOVON-65/GMMG-HD4 trial.13,14 The EMC92 classifier has been standardized for use in clinical practice as the SKY92 gene classifier. It was validated in newly diagnosed and relapsed patients who were treated with a range of therapies, including bortezomib and thalidomide.13,15-18 On average, it identified 18% of patients as HR. The median age of patients within the data sets was 62 years, falling short of the median age of 69 years, as indicated above.1 Only 1 of the validation data sets specifically concerned older patients (MRC-IX nonintensive trial).
With that in mind, we set out to validate SKY92 and R-ISS in a homogenously treated population of older newly diagnosed transplant-ineligible MM patients (HOVON-87/NMSG-18 trial; HO87).19 In addition, we show the benefit of adding the SKY92 gene classifier to R-ISS. Finally, we stratify patients by their risk assigned at diagnosis, using the SKY92 and R-ISS combination (SKY-RISS), to observe its potential for treatment prediction.
Methods
Patient characteristics
This analysis concerned patients included in the HO87 trial (EudraCT: 2007-004007-34).19 All measurements were performed at diagnosis. The HO87 trial is a randomized prospective phase 3 trial of patients with previously untreated symptomatic MM who were older than 65 years of age or not eligible for high-dose chemotherapy and peripheral stem cell transplantation. Patients were randomized upfront (randomly assigned 1:1, stratified for hospital and ISS stage) to receive 9 28-day cycles of melphalan-prednisone-thalidomide followed by thalidomide maintenance (MPT-T; n = 317) or melphalan-prednisone-lenalidomide followed by lenalidomide maintenance (MPR-R; n = 319). Details about the trial design and sample collection are shown in supplemental Figures 1 and 2. This trial was conducted in accordance with the Declaration of Helsinki and was approved by the institutional review board of all participating hospitals. Written informed consent was obtained from all patients.
Discovery data
SKY92 gene classification.
For 180 patients, analyses were performed on RNA extracted from CD138+ enriched plasma cells obtained at diagnosis. The MMprofiler gene expression assay (SkylineDx, Rotterdam, The Netherlands) was used to obtain SKY92 classification, as well as GEP-derived immunoglobulin heavy chain translocation status [ie, t(4;14), t(11;14), and t(14;16/20)]. SKY92 enables classification of patients into HR or standard-risk (SR) categories.13 RNA sample collection and workup are detailed in the supplemental Document.
Interphase fluorescent in situ hybridization.
Interphase fluorescent in situ hybridization (FISH) for loss of the TP53 locus on chromosome 17p13, loss of chromosome 13q14, gain of chromosome 1q, and translocations involving the immunoglobulin heavy chain/14q32 locus was obtained using standard techniques, according to the European Myeloma Network guidelines, with positive cutoff levels at 20% for numerical abnormalities and 10% for fusion or break-apart probes.20 For details see the supplemental Document.
R-ISS.
Risk stratification according to the ISS was determined by combining serum levels of albumin and β2m (ISS I: β2m < 3.5 mg/L and albumin ≥ 3.5 g/dL; ISS II: not I or III; ISS III: β2m ≥ 5.5 mg/L).8 Elevated LDH, measured in serum, is defined as LDH levels higher than upper limit of normal. LDH measurements and upper limit of normal were defined in the same laboratory.
R-ISS combines ISS with LDH and HR chromosomal abnormalities, resulting in 3 risk groups. These are R-ISS I, if ISS I and no elevation in LDH, no del(17p), no t(4;14), and no t(14;16); R-ISS III, if ISS III and ≥1 of the following 4 HR characteristics: elevated LDH, del(17p), t(4;14), or t(14;16); and R-ISS II, if not R-ISS I or R-ISS III.9 Although R-ISS was not analyzed in the HO87 trial, all data for R-ISS staging were part of the protocol and could be analyzed in all but 19 patients. For 7 of the 19 patients, R-ISS was obtained by replacing an unknown immunoglobulin heavy chain translocation status by FISH with the MMprofiler GEP-derived equivalent: the presence of t(4;14) or t(14;16/20). Concordance between MMprofiler-derived translocation status and interphase FISH was demonstrated previously (supplemental Table 1).21
Validation data
The publicly available Multiple Myeloma Research Foundation CoMMpass study in newly diagnosed MM (NCT01454297; https://research.mmrf.org; version IA13) was used for validation.22,23 This data set consists of patients for whom molecular evaluations, such as RNA sequencing (RNA-seq) and extensive clinical annotation, are publicly available. We included patients based on the following criteria: age older than 65 years; did not receive transplantation in the first line of treatment; with annotation for R-ISS, overall survival (OS), and progression-free survival (PFS); and with paired-end RNA-seq expression data from CD138+ enriched bone marrow plasma cells at diagnosis (n = 93). For details on the use of the SKY92 gene classifier in this data set, see supplemental Document.
Statistics
Survival analyses.
Survival was measured from study registration. For OS, an event was defined as death from any cause. For PFS, it was progression or death from any cause. Hazard ratios and corresponding log-rank test calculations were performed using Cox regression and the R (v3.6) survival package (v3.2). Because the proportional-hazard assumption was violated for R-ISS vs PFS in the HO87, PFS survival times were censored at 3 years.
Differential expression and GO analyses.
A limma analysis using R Bioconductor limma package (v3.42.2) was performed on all genes that had a log2-transformed MAS5 expression value > 5 in >10% of patients.24 The results were applied to limma gene ontology (GO) enrichment analyses, which used annotation provided by the R annotation package org.Hs.eg.db (v3.10).
Results
GEP data were available for 180 of 636 HO87 patients. The characteristics of patients with and without GEP data are shown in Table 1. Distributions for age, ISS, and occurrence of cytogenetic aberrations were comparable. The median follow-up for all patients included in this trial was 77 months, compared with 81 months for patients with available GEPs.
Comparison between the HO87 trial population and the gene-expression subset analyzed in this study
| Not in analysis (n = 456) | In analysis (n = 180) | Total (N = 636) | P | ||||
|---|---|---|---|---|---|---|---|
| n | % | n | % | N | % | ||
| Age, y | .22* | ||||||
| Median | 73 | 72 | 73 | ||||
| Q1 | 69 | 69 | 69 | ||||
| Q3 | 77 | 76 | 77 | ||||
| Range | 60-91 | 60-84 | 60-91 | ||||
| Sex | .43† | ||||||
| Male | 253 | 55 | 93 | 52 | 346 | 54 | |
| Female | 203 | 45 | 87 | 48 | 291 | 46 | |
| Treatment | .86† | ||||||
| MPT-T | 226 | 50 | 91 | 51 | 317 | 50 | |
| MPR-R | 230 | 50 | 89 | 49 | 319 | 50 | |
| ISS stage | .97† | ||||||
| I | 116 | 26 | 44 | 25 | 160 | 25 | |
| II | 217 | 48 | 87 | 49 | 304 | 48 | |
| III | 118 | 26 | 46 | 26 | 164 | 26 | |
| FISH performed | <.001† | ||||||
| No | 142 | 31 | 13 | 7 | 155 | 24 | |
| Yes | 314 | 69 | 167 | 93 | 480 | 76 | |
| gain(1q) | .82† | ||||||
| No | 143 | 64 | 82 | 62 | 225 | 63 | |
| Yes | 81 | 36 | 50 | 38 | 131 | 37 | |
| del(13q) | .55† | ||||||
| No | 160 | 58 | 85 | 54 | 245 | 56 | |
| Yes | 118 | 42 | 72 | 46 | 190 | 44 | |
| del(17p) | .87† | ||||||
| No | 256 | 90 | 136 | 89 | 392 | 90 | |
| Yes | 28 | 10 | 16 | 11 | 44 | 10 | |
| t(4;14) | 1.0† | ||||||
| No | 280 | 92 | 146 | 91 | 426 | 91 | |
| Yes | 26 | 8 | 14 | 9 | 40 | 9 | |
Genetic aberrations were not assessed for all patients, such that the numbers for these variables do not add to the mentioned totals.
Q1, quartile 1; Q3, quartile 3.
Kruskal-Wallis test.
Fisher’s exact test.
Prognostic markers
The relationship between prognostic markers and survival is shown in Figure 1. The following markers were included: SKY92, ISS, R-ISS, LDH levels, treatment arm, and cytogenetic markers, such as del(17p), t(11;14), t(4;14), t(14;16/20), gain(1q), and del(13q).
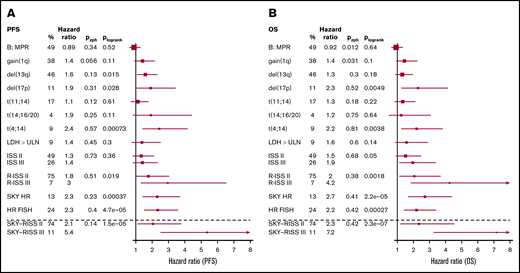
Forest plots for PFS and OS for available markers. The percentage (%) of patients per risk group, the hazard ratios relative to the lowest-risk groups, Pzph (a global P value indicating deviation from the proportional hazards assumption), and Plogrank (log-rank P value) are shown for each marker. The forest plots show the hazard ratios for PFS (A) and OS (B) with corresponding 95% confidence interval as whiskers. For HR FISH, the combination of FISH markers within the R-ISS definition is used. ULN, upper limit of normal.
Forest plots for PFS and OS for available markers. The percentage (%) of patients per risk group, the hazard ratios relative to the lowest-risk groups, Pzph (a global P value indicating deviation from the proportional hazards assumption), and Plogrank (log-rank P value) are shown for each marker. The forest plots show the hazard ratios for PFS (A) and OS (B) with corresponding 95% confidence interval as whiskers. For HR FISH, the combination of FISH markers within the R-ISS definition is used. ULN, upper limit of normal.
The SKY92 gene classifier identified 24 of 180 patients (13%). The 3-year PFS rate was 32% (95% confidence interval [CI], 26-40) for SKY92 SR patients compared with 10% (95% CI, 3-36) for SKY92 HR patients (P < .001, log-rank test; Figure 1A; supplemental Figure 3A). The 3-year OS was 70% (95% CI, 63-74) for SKY92 SR patients compared with 28% for SKY92 HR patients (95% CI, 14-54; P < .0001; Figure 1B; supplemental Figure 3B). This corresponds to a hazard ratio of 2.3 (95% CI, 1.4-3.7) for PFS (P < .001) and a hazard ratio of 2.7 (95% CI, 1.7-4.4) for OS (P < .0001).
R-ISS was known for 168 patients [available values for SKY92, ISS, t(4;14), t(14;16), del(17p), and LDH]. Of these, 30 (18%) were R-ISS I, 126 (75%) were R-ISS II, and 12 (7%) were R-ISS III. The 3-year PFS rates were 47% (95% CI, 32-68), 27% (95% CI, 20-36), and 17% (95% CI, 5-59), respectively (P = .1; Figure 1A; supplemental Figure 3C). The 3-year OS rates were 80% (95% CI, 67-96), 65% (95% CI, 57-74), and 33% (95% CI, 15-74), respectively (P < .01; Figure 1B; supplemental Figure 3D). The risk predicted by the R-ISS was most pronounced for OS: the hazard ratio was 2.0 (95% CI: 1.1-3.7) for R-ISS II vs R-ISS I, and 4.2 (95% CI, 1.8-9.7) for R-ISS III vs R-ISS I. In terms of PFS, the hazard ratios were 1.8 (95% CI, 1.0-3.0) and 3.0 (95% CI, 1.3-6.5), respectively.
Combining SKY92 with R-ISS
R-ISS has been introduced to replace ISS.9 As a logical follow-up to our earlier work on the combination of SKY92 and ISS (for which results in this data set are presented in the supplemental Document), in this article SKY-RISS was analyzed (in 168 patients). Both markers have independent prognostic value for PFS and OS (Table 2). A contrast analysis, based on OS, compared all logical combinations of SKY92 and R-ISS and resulted in an optimal 3-tier risk stratification (supplemental Table 2). Low-risk patients are defined by SKY92 SR and R-ISS I (n = 26, 15%); intermediate-risk patients are defined by SKY92 SR and R-ISS II/III or by SKY92 HR and R-ISS I (n = 124, 74%); and HR patients are defined by SKY92 HR and R-ISS II/III (n = 18; 11%). These groups were termed SKY-RISS I, SKY-RISS II, and SKY-RISS III, respectively. The 3-year PFS rates were 54% (95% CI, 38-77), 27% (95% CI, 21-37), and 7% (95% CI, 1-46), respectively (P < .001; Figure 2A). The respective 3-year OS rates were 88% (95% CI, 77-100), 66% (95% CI, 58-75), and 26% (95% CI, 11-58; P < 1 × 10⁻⁵; Figure 2B). The hazard ratios (relative to SKY-RSS I) are 2.1 (PFS) and 2.3 (OS) for SKY-RISS II, and 5.4 (PFS) and 7.2 (OS) for SKY-RISS III.
Multivariate analysis for PFS and OS in the HO87 and CoMMpass data sets
| Trial | n | PFS | OS | ||||
|---|---|---|---|---|---|---|---|
| Hazard ratio | 95% CI | P | Hazard ratio | 95% CI | P | ||
| HO87 (N = 168) | |||||||
| SKY92 | |||||||
| SR | 146 | 1.0 | 5.1 × 10⁻⁴ | 1.0 | 6.3 × 10−0 | ||
| HR | 22 | 2.6 | 1.6-4.3 | 3.1 | 1.9-5.1 | ||
| R-ISS | |||||||
| I | 30 | 1.0 | 2.0 × 10⁻² | 1.0 | 2.6 × 10⁻³ | ||
| II | 126 | 1.9 | 1.1-3.2 | 2.1 | 1.2-3.8 | ||
| III | 12 | 2.6 | 1.2-5.8 | 4.0 | 1.8-9.3 | ||
| Events = 118; 3 df | 3 × 10⁻⁵ | Events = 107; 3 df | 1 × 10−0 | ||||
| CoMMpass (N = 93) | |||||||
| SKY92 | |||||||
| SR | 69 | 1.0 | 1.7 × 10⁻³ | 1.0 | 2.8 × 10−0 | ||
| HR | 24 | 2.7 | 1.5-4.9 | 4.2 | 1.9-4.2 | ||
| R-ISS | |||||||
| I | 22 | 1.0 | .031 | * | 3.8 × 10−0 | ||
| II | 59 | 2.5 | 1.2-5.5 | ||||
| III | 12 | 2.2 | 0.76-6.5 | ||||
| Events = 53; 3 df | 7 × 10⁻⁴ | Events = 29; 3 df | 2 × 10−0 | ||||
HO87 was used as the discovery set, and CoMMpass was used as the validation set.
df, degrees of freedom.
Hazard ratios could not be determined because the R-ISS I group did not have any event.
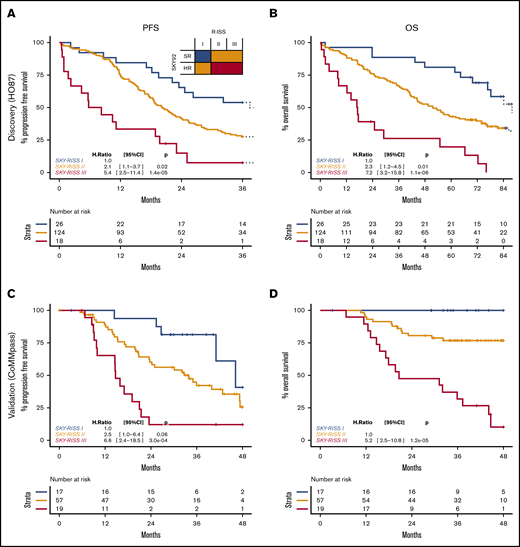
SKY-RISS classifications. Discovery data for PFS (A) and OS (B) and validation data for PFS (C) and OS (D). Because no events were observed for the SKY-RISS I group in the validation data, the SKY-RISS II group was used as a reference group in the Cox model.
SKY-RISS classifications. Discovery data for PFS (A) and OS (B) and validation data for PFS (C) and OS (D). Because no events were observed for the SKY-RISS I group in the validation data, the SKY-RISS II group was used as a reference group in the Cox model.
Validation in independent data from older nontransplanted patients
For validation of SKY-RISS, 93 patients older than 65 years of age from the CoMMpass trial data set were analyzed.22,23 The median follow-up was 41 months. SKY92 and R-ISS were confirmed as independent prognostic markers in this set (Table 2; supplemental Figure 4).
The SKY-RISS classification resulted in 17 (18%) low-risk patients, 57 (61%) intermediate-risk patients, and 19 (21%) HR patients. The 3-year PFS rates were 81% (95% CI, 64-100), 42% (95% CI, 30-59), and 12% (95% CI, 3-44), respectively (P = 1 × 10⁻⁴, log-rank test; Figure 2C), and 3-year OS rates were 100% (95% CI, 100-100), 77% (95% CI, 66-89), and 32% (95% CI, 16-61), respectively (P ≤ 1 × 10⁻⁶, log-rank test; Figure 2D).
Survival relative to R-ISS and SKY92 subgroups
By splitting the SKY-ISS stratification further, relative to R-ISS or SKY92, we demonstrate the improvement obtained by the combined stratification. Within the CoMMpass data, the SKY-RISS III group consisted of R-ISS II/III patients with SKY92 HR status, causing the SKY-RISS III group (20%) to be considerably larger compared with the R-ISS III group (13%), but with comparably poor survival (3-year OS rate, 32% vs 33%). Indeed, 5 of 12 patients (42%) with R-ISS III were SKY92 SR and, as such, were categorized as SKY-RISS II (Figure 3A-B). Similarly, 5 of 24 SKY92 HR patients (21%) were R-ISS I, resulting in a SKY-RISS II classification (Figure 3C-D). Both of these subsets of patients indeed demonstrate longer survival, as shown. Moreover, the SKY-RISS I group consists of patients with R-ISS I and SKY92 SR status. Seventy-seven percent of R-ISS I patients and 25% of SKY92 patients were SKY-RISS I (Figure 3E-H). For R-ISS and SKY92, the remaining 23% and 75% of patients, respectively, were classified as SKY-RISS II and, indeed, demonstrated a shorter survival. For the discovery data, see supplemental Figure 5.
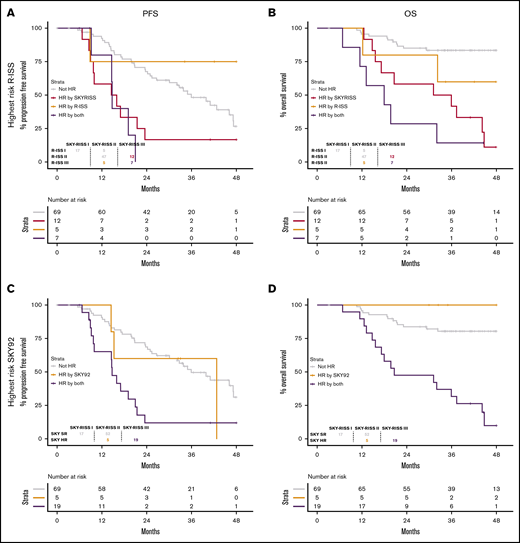
Benefit in terms of PFS and OS in the validation data. Shown is the better correlation with PFS (A,C,E,G) and OS (B,D,F,H) relative to R-ISS and SKY92 alone. (A-B) Highest-risk R-ISS. (C-D) Highest-risk SKY92. (E-F) Lowest-risk R-ISS. (G-H) Lowest-risk SKY92. For the discovery data, see supplemental Figure 5.
Benefit in terms of PFS and OS in the validation data. Shown is the better correlation with PFS (A,C,E,G) and OS (B,D,F,H) relative to R-ISS and SKY92 alone. (A-B) Highest-risk R-ISS. (C-D) Highest-risk SKY92. (E-F) Lowest-risk R-ISS. (G-H) Lowest-risk SKY92. For the discovery data, see supplemental Figure 5.
Multivariate model
As shown above, the SKY-RISS classification presented the strongest prognostic correlation. Of the cytogenetic markers, del(17p) and t(4;14) were the best prognostic markers, with hazard ratios for PFS of 1.9 (95% CI, 1.1-3.4; P = .030) and 2.4 (95% CI, 1.4-4.1; P = 1.1 × 10⁻³), respectively, and hazard ratios for OS of 2.3 (95% CI, 1.3-4.1; P = .006) and 2.2 (95% CI, 1.3-3.8; P = .005), respectively (Figure 1). Together with t(14;16), del(17p) and t(4;14) form the commonly used HR FISH definition. HR FISH is univariately associated with shorter PFS and OS (hazard ratio, 2.3; 95% CI, 1.5-3.6; P = 4.7 × 10⁻⁵ for PFS and hazard ratio, 2.2; 95% CI, 1.4-3.4; P = .00027 for OS).
The multivariate analysis, including ISS and HR FISH, shows that SKY-RISS remains independent from these factors for PFS and OS (Table 3).
Multivariate Cox regression in HO87 of SKY-RISS analyzed together with ISS, SKY92, R-ISS, and HR FISH combination as defined within R-ISS (N = 151)
| N | PFS | OS | |||||
|---|---|---|---|---|---|---|---|
| Hazard ratio | 95% CI | P | Hazard ratio | 95% CI | P | ||
| SKY-RISS | |||||||
| I | 26 | 1.0 | .01 | 1.0 | 1.0 × 10⁻³ | ||
| II | 108 | 1.9 | 1.0-3.5 | 2.2 | 1.1-4.3 | ||
| III | 17 | 3.5 | 1.5-8.1 | 5.1 | 2.1-12.4 | ||
| HR FISH | |||||||
| SR | 114 | 1.0 | .02 | 1.0 | .12 | ||
| HR | 37 | 1.7 | 1.1-2.8 | 1.5 | 0.91-2.4 | ||
| Events = 107 | P = 1 × 10⁻⁵ | Events = 96 | P = 2 × 10⁻⁶ | ||||
After the bidirectional Akaike information criterion–based stepwise selection, only SKY-RISS and HR FISH remain in the model.
Differential treatment effect
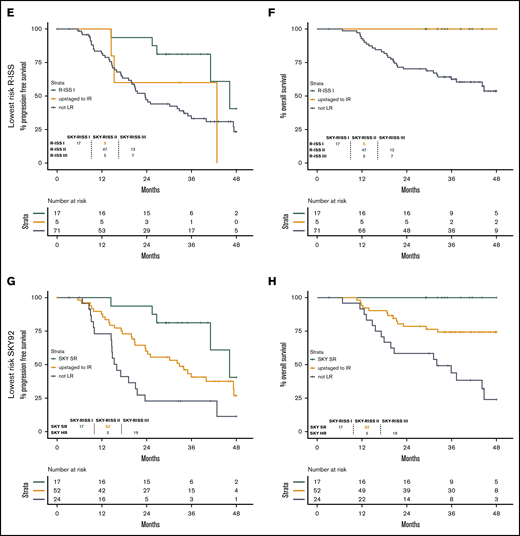
The HO87 trial did not report any survival benefit for the lenalidomide-containing treatment arm or the thalidomide-containing treatment arm. Interestingly, our current analysis of this trial demonstrated a differential treatment effect between risk groups for OS (supplemental Table 3; P = .02) but not for PFS (P = .09). A subgroup analysis indicated a clearly beneficial effect in the SKY-RISS III group of patients specifically (n = 18), for whom MPR-R treatment resulted in a much longer survival compared with MPT-T treatment (3-year OS rate, 57% vs 0%; median OS, 55 vs 14 months), with a hazard ratio of 0.25 (95% CI, 0.09-0.69; P = .007). No difference in OS between arms was found for SKY-RISS I (n = 124) or SKY-RISS II (n = 26), with hazard ratios of 2.5 (95% CI, 0.65-9.7; P = .18) and 0.85 (95% CI, 0.55-1.3; P = .46), respectively (Figure 4). Similar, but less pronounced, effects were seen in the R-ISS III and SKY HR subgroups (supplemental Figures 6 and 7).
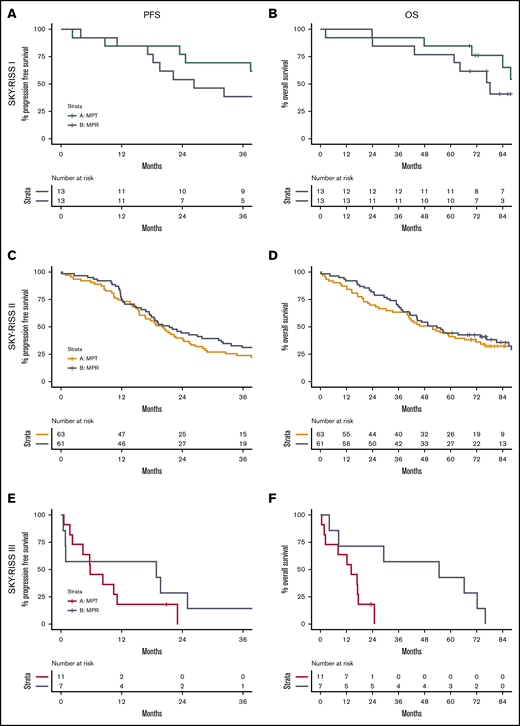
Survival differences in treatment arms per risk group. PFS (A,C,E) and OS (B,D,F) per SKY-RISS risk group. (A-B) SKY-RISS I. (C-D) SKY-RISS II. (E-F) SKY-RISS III. The colored lines indicate MPT-T survival, and the gray lines indicate MPR-R survival.
Survival differences in treatment arms per risk group. PFS (A,C,E) and OS (B,D,F) per SKY-RISS risk group. (A-B) SKY-RISS I. (C-D) SKY-RISS II. (E-F) SKY-RISS III. The colored lines indicate MPT-T survival, and the gray lines indicate MPR-R survival.
Differential expression and GO enrichment analysis
Gene expression analysis was performed in the combined HO87 and older CoMMpass patients to identify differentially expressed genes within the tumor cells between the SKY-RISS risk categories (supplemental Table 5). Comparison of SKY-RISS III with SKY-RISS I/II demonstrated that 53% of genes were differentially expressed (false-discovery rate < 0.05; 5886/11 134), indicating a completely differently regulated subset of patients. SKY-RISS III status combines ISS, del17p, t(14;16), t(4;14) and SKY92 HR status. In line with this, differentially expressed genes included BIRC5, LTBP1, MCM2, MCM3, and TOP2A (all part of the SKY92 classifier). Also, increased expression was found for WHSC1, associated with cytogenetic aberration t(4;14). Other strongly deregulated genes included upregulation of CDC20 and UBE2C (both are involved in cell cycle regulation), as well as PHF19 (described to be a mediator of tumorigenesis in MM)25 and downregulation of CCND1 (cell cycle) and TLR10 (exact function in MM unknown).26 Interestingly, CRBN and IKZF1 are downregulated in this group.
GO enrichment analysis demonstrated proliferation/cell cycle–related GO terms to be upregulated with increasing risk. In contrast, terms such as “cell communication,” “endocytosis,” and “import into cell” become less active, suggesting a reduced dependence on the microenvironment with increasing risk (supplemental Table 6).27 An interesting observation in relation to the observed differential immune modulatory treatment effect in the SKY-RISS III group of patients is that the GO term “immune system process” (GO: 0002376) is ranked at position 15 (of 20 142; false-discovery rate, 3 × 10⁻³) of downregulated terms.
Discussion
In this study, we investigated whether current risk-stratification strategies could be improved to better identify older patients newly diagnosed with MM who would benefit from treatment or in whom treatment should be reconsidered because of dismal prognosis. First, we could confirm that SKY92 and R-ISS have solid prognostic value in older MM patients treated with thalidomide and lenalidomide. Second, combining SKY92 with R-ISS resulted in a marker with improved performance compared with either marker separately. Third, although the outcome with a lenalidomide-based regimen was comparable to that of a thalidomide-based regimen in the entire study population, we showed here that, by using SKY-RISS, an HR population of patients was identified who clearly showed benefit from lenalidomide over thalidomide, suggesting predictive value for this new classifier.
Comparing the proportion of SKY92 HR patients in different older populations highlights variability (ie, 13% for the HO87 trial, 24% for the MRC-IX trial, and 26% for the CoMMpass trial). However, the proportion of ISS III patients was significantly higher in the MRC-IX trial (51%) and the CoMMpass trial (33%) compared with the HO87 trial (26%; supplemental Table 4), and translocation t(4;14) occurred more frequently in MRC-IX patients (18%) and in CoMMpass patients (14%) compared with HO87 patients (9%), indicating clear differences among these studies.
Using the combination of the 2 prognostic tools, the prediction of prognosis is refined. This is explained by our observation that, in group R-ISS I, 23% of patients had HR SKY92 features. In contrast, 42% of patients in group R-ISS III had SR SKY92 features. Hence, the resulting SKY-RISS marker demonstrated a closer correlation with the actual survival in discovery and validation data compared with either marker separately. In this study, hazard ratios for PFS (and OS) increased from 1.4 (1.9) for ISS III to 3.0 (4.2) for R-ISS III and 5.4 (7.2) for SKY-RISS III.
Genome-wide expression profiling or transcriptomics, either by microarray or by RNA-seq, offers a variety of information, in addition to SKY92 HR status. Currently, conventional immunoglobulin heavy chain translocation status [eg, t(4;14)] can be reliably determined, and these aberrations are routinely reported.28 Moreover, expression data for all known expressed genes are generated, which forms a resource for future research, as well as represents a platform to which new markers can be added.
Importantly, we found that SKY-RISS has the ability to predict survival in IMiD treatment, which would move the field forward to personalized treatment. Specifically, SKY-RISS III patients seem to have longer survival when treated with lenalidomide compared with thalidomide. Although we cannot provide the exact biological mechanism underlying this observation, the data suggest that tumor cells in SKY-RISS III patients are generally more proliferative, whereas many other activities are inhibited, specifically immune processing and inter- and intracell communication. Despite the structural similarities between the 2 drugs, potential differences in the mechanism of action have been described.29 Thalidomide and lenalidomide, as well as other IMiDs, such as pomalidomide, act by binding CRBN. CRBN is involved in ubiquitination of proteins, marking the targets for degradation. The binding of IMiDs to CRBN changes the specificity of the E3 ligase complex from physiological targets, such as MEIS2, to IMiD-related targets, including IKZF1, IKZF3, and CK1a. This shift underlies the antiangiogenic, cytotoxic, and immunomodulatory effects of IMiDs.30 Interestingly, CRBN is significantly downregulated in tumor cells in SKY-RISS III patients in our analysis. Also, IKZF1 and CK1α have lower messenger RNA levels. IKZF3 expression was low, irrespective of risk group. CRBN and IKZF1 levels have been shown to be important for IMiD efficacy, which may explain the decreased effectiveness of thalidomide in SKY-RISS III patients. The observed therapy specificity must then be the result of differences between lenalidomide and thalidomide. The binding to CRBN is known to be stronger for lenalidomide,31 possibly rendering it less sensitive to a decrease in its expression. Also, substrate specificities are believed to differ between IMiD analogs. Together, they cause differences in downstream effects (eg, lenalidomide is known to be a more potent inhibitor of angiogenesis by affecting key drivers of angiogenesis and metastasis). In contrast to thalidomide, it inhibits VEGF-induced phosphatidylinositol 3-kinase–Akt pathway signaling, which is known to regulate adherens junction formation, and it strongly downregulates HIF-1α expression, the main mediator of hypoxia-mediated effects.32,33 With regard to immune modulation, better inhibition of tumor necrosis factor-α production in monocytes and macrophages was observed with lenalidomide compared with thalidomide.34,35
In terms of a biological explanation, but more important for clinical usage, validation in a comparable separate patient population is required. However, such a population is lacking, posing a limitation to our study. This is especially true considering the modest number of patients, resulting in small subgroups. In addition, neither MPT-T nor MPR-R is used frequently in the treatment of newly diagnosed nontransplant-eligible patients within the United States and the European Union. The predictive value of the risk groups with regard to more recently implemented drugs would be interesting to know. However, apart from these limitations, this is one of the few tools actually showing a statistically significant predictive value, as well as prognostic value. The effect of risk stratification on outcome has been illustrated previously (eg, absence of a survival benefit with thalidomide maintenance compared with observation in cytogenetic HR patients only).36,37 A reduced overall survival benefit is seen in HR patients, including HR cytogenetics, treated with lenalidomide during maintenance.38 Also, in the MRC-XI trial, lenalidomide maintenance was reported to result in a similar survival compared with observation in patients in the SKY92 HR group and/or in patients who exhibited ≥2 chromosomal HR markers.18 Patients with a single chromosomal HR marker or no risk marker did benefit from lenalidomide maintenance over observation. In conclusion, risk markers used clinically may result in improved outcome, provided that an alternative treatment is available for HR patients. Whether gene-expression profiling is worthwhile in practice is the topic of ongoing studies, such as the MUK9 OPTIMUM trial and the SWOG-1211 trial.39,40
In summary, SKY92 and R-ISS are robust prognostic classifiers in older MM patients. Combining SKY92 with R-ISS into SKY-RISS resulted in a more accurate assignment of patients with a dismal outcome or a favorable outcome. In addition, the SKY-RISS combination demonstrates predictive value for treatment in the HO87 trial.
The MMprofiler-derived HG-U133 Plus2 GEPs for 180 patients in the HO87 trial have been deposited in the Gene Expression Omnibus (accession number GSE87900).
Data-sharing requests should be sent to Pieter Sonneveld (p.sonneveld@erasmusmc.nl).
Acknowledgments
The authors thank Lizanne Bosman and Fanni van den Bosch (SkylineDx) for assistance with MMprofilers.
This work was supported by ZonMw (project number 95103008) and received funding from the European Union’s Horizon 2020 research and innovation programme under grant agreement 701143.
Authorship
Contribution: R.K., M.v.D., M.H.v.V., E.H.v.B., and P.S. designed research; R.K., M.v.D., and M.H.v.V. collected, analyzed, and interpreted the data and wrote the manuscript; B.v.d.H. provided clinical data from the HO87 trial and critically reviewed the manuscript; H.V.-W. performed central data management for the HO87 trial; B.D. performed gene-expression experiments; M.V. and J.K. purified cells; H.B.B. and M.S.-K. performed FISH experiments; A.B., M.-D.L, M.H., A.W.G.v.d.V., A.W., S.Z., and P.S. provided patients included in the HO87 trial and critically reviewed the manuscript; A.W. is the principal investigator for the Nordic part of the HO87 trial and critically reviewed the manuscript; S.Z. is the principal investigator for the Dutch part of the HO87 trial and critically reviewed the manuscript; and P.S is the principal investigator for the performed research and critically reviewed the manuscript.
Conflict-of-interest disclosure: R.K., M.H.v.V., E.H.v.B., and B.D. are employees of and option holders in SkylineDx BV. A.B. is a member of advisory boards and received honoraria from Celgene, Janssen Pharmaceuticals, and Amgen. S.Z. has received research support from Takeda, Celgene, and Janssen Pharmaceuticals. P.S. has received research support from Janssen Pharmaceuticals, Celgene, Takeda, and Amgen. The remaining authors declare no competing financial interests.
Correspondence: Pieter Sonneveld, Erasmus Medical Center, Cancer Institute, Department of Hematology, Na-822, PO Box 2040, 3000 CA Rotterdam, The Netherlands; e-mail: p.sonneveld@erasmusmc.nl.

