

Key Points
Constitutively active Lyn in B cells increases BCR responsiveness, but this effect is partially attenuated in Eµ-TCL1tg mice.
Limited effects of constitutively active Lyn on CLL in vivo suggest that Lyn activation in B cells is not a major driver of CLL progression.

Abstract
The treatment of chronic lymphocytic leukemia (CLL) has been improved dramatically by inhibitors targeting B-cell receptor (BCR)–associated kinases. The tyrosine kinase Lyn is a key modulator of BCR signaling and shows increased expression and activity in CLL. To evaluate the functional relevance of Lyn for CLL, we generated a conditional knockin mouse model harboring a gain-of-function mutation of the Lyn gene (LynY508F), which was specifically expressed in the B-cell lineage (Lynup-B). Kinase activity profiling revealed an enhanced responsiveness to BCR stimulation in Lynup-B B cells. When crossing Lynup-B mice with Eµ-TCL1 mice (TCL1tg/wt), a transgenic mouse model for CLL, the resulting TCL1tg/wt Lynup-B mice showed no significant change of hepatomegaly, splenomegaly, bone marrow infiltration, or overall survival when compared with TCL1tg/wt mice. Our data also suggested that TCL1 expression has partially masked the effect of the Lynup-B mutation, because the BCR response was only slightly increased in TCL1tg/wt Lynup-B compared with TCL1tg/wt. In contrast, TCL1tg/wt Lynup-B were protected at various degrees against spontaneous apoptosis in vitro and upon treatment with kinase inhibitors targeting the BCR. Collectively, and consistent with our previous data in a Lyn-deficient CLL model, these data lend further suggest that an increased activation of Lyn kinase in B cells does not appear to be a major driver of leukemia progression and the level of increased BCR responsiveness induced by Lynup-B is insufficient to induce clear changes to CLL pathogenesis in vivo.
Introduction
The B-cell receptor (BCR) signaling pathway is critical in determining the fate of both normal and malignant B cells. Antigen engagement through the BCR triggers a series of phosphorylation of the BCR-associated kinases, with activation of Src family of tyrosine kinases (SFK) being one of the earliest events. Lyn kinase is the predominant SFK in B cells and was initially appointed the key mediator of B-cell activation.1 Lyn activity is tightly regulated by serial phosphorylation-dependent conformational changes similar to other SFKs.2 Upon BCR engagement, Lyn and other SFKs phosphorylate the immunoreceptor tyrosine-based activation motif in the immunoglobulin α (Ig-α) and Ig-β components of the BCR, leading to the recruitment and phosphorylation of other kinases that form the BCR signalosome complex.3-5 Lyn is different from other SFKs due to its ability to also phosphorylate the immunoreceptor tyrosine-based inhibition motif in inhibitory cell surface receptors, which are important for the recruitment of tyrosine phosphatases such as Shp-1/2 and Ship-1, which in turn attenuate BCR-triggered activation responses.3,5,6 In Lyn knockout mice, the defective recruitment of the phosphatases in B cells results in hyperresponsiveness to BCR stimulation, favoring the inhibitory over activating signaling.7,8 On the other hand, mice having a gain-of-function mutation (Y508F; Lynup/up) develop circulating autoreactive antibodies and a severe autoimmune glomerulonephritis, implying that the enhanced positive signaling overrides negative regulation in Lynup/up mice. B cells of Lynup/up mice show constitutive tyrosine phosphorylation of both positive and negative regulators of BCR signaling.9,10
The malignant transformation of B cells is strongly influenced by the BCR and its response to microenvironmental stimuli. In chronic lymphocytic leukemia (CLL), the most common type of B-cell leukemia, the activation of BCR-stimulated signaling cascades was shown to be a hallmark of malignant cells in proliferation centers.11,12 The remarkable efficacy of drugs inhibiting BCR-associated kinases, such as Btk, has also highlighted the importance of the BCR signaling in CLL pathogenesis.13 In CLL cells, Lyn is overexpressed and highly activated.14,15 The high basal activity of Lyn cannot be increased by IgM stimulation, other than that observed in healthy B cells.14 Since no upregulation of Lyn messenger RNA (mRNA) expression in peripheral CLL cells was found, anomalous Lyn expression in CLL cells was presumably caused by defective protein turnover rate due to the complex formation of Lyn with other docking molecules, such as heat shock protein 90.16 On the other hand, Lyn mRNA levels were found to be significantly increased in bone marrow CLL cells compared with healthy control cells in a small cohort.15 This upregulation of Lyn mRNA in CLL cells was further suggested to potentially correlate with a shorter treatment-free survival in patients.17 Many Lyn substrates including Syk, phosphatidylinositol 3-kinase (PI3K), HS1, procaspase-8, and cortactin are also activated in CLL cells, contributing to the expansion and apoptotic resistance of these leukemic cells.18-22 Downstream phosphatases of Lyn, such as Shp-1 or Ptpn22, can also enhance prosurvival signaling or counteract apoptosis in a localization-dependent manner in CLL.23,24 However, targeting of Lyn in CLL with the clinical agent dasatinib was by far less effective than other BCR inhibitors such as ibrutinib or idelalisib.25,26 Although dasatinib can effectively induce apoptosis in isolated CLL cells,27 this inhibitor hits a very wide spectrum of targets and therefore does not represent a precise tool to evaluate the functional relevance of Lyn in CLL cells.28
Based on the above-mentioned insights regarding the eminent role of BCR-associated kinases such as Lyn for the pathogenesis of B-cell malignancies, we hypothesized that a constitutively active Lyn kinase in B cells should show profound effects on CLL leukemogenesis in vivo. To test this hypothesis, we generated a murine CLL mouse model with a constitutively active Lyn kinase in B cells.
Materials and methods
Mouse experiments
All mouse experiments were approved by the state authorities of North Rhine-Westphalia (Landesamt für Natur, Umwelt und Verbraucherschutz Nordrhein-Westfalen, approvals no. 8.87-50.10.37.09.241, no. 84-02.04.2014.A146 and no. 81-02.04.2019.A009). Only mice hemizygous for transgenic TCL1 from F3 and later generations were used for analyses. Husbandry, procedures for blood, serum, tissue sample collection, differential blood counts, and B-cell purification with CD19 magnetic beads (Miltenyi Biotec, Bergisch Gladbach, Germany) were described previously.29,30
Generation of the conditional LynY508F-IRES-GFP mouse model
The conditional LynY508F-IRES-GFP (LynY508Ffl/fl) mouse model was generated by a contract with Taconic Artemis (Cologne, Germany). Lyn gene harboring a point mutation at the inhibitory phosphorylation tyrosine was tagged with the GFP, placed under the CAGGS promoter, and inserted to the Rosa26 locus using recombination-mediated cassette exchange. To restrict the expression to B cells only, LynY508Ffl/fl mice were crossed with CD19-Crecre/wt mice.31 To study the effects of this gain-of-function mutant Lyn in CLL disease, these mice were further crossed with the Eμ-TCL1 transgenic model.32 CD19-Crewt/wtLynY508Ffl/fl mice are used as wild-type (WT) controls, CD19-Crecre/wtLynY508Ffl/fl are termed Lynup-B, Eµ-TCL1tg/wtCD19-Crewt/wtLynY508Ffl/fl mice are referred as TCL1tg/wt, and Eµ-TCL1tg/wtCD19-Crecre/wtLynY508Ffl/fl mice are referred as TCL1tg/wt Lynup-B.
Tyrosine kinase activity assay
Murine splenic B cells were stimulated for 10 minutes with 20 μg/mL goat F(ab′)2 anti-mouse IgM (Southern Biotech, Birmingham, AL), washed twice with phosphate-buffered saline (PBS), and lysed in M-PER mammalian extraction buffer containing Halt phosphatase and Halt protease inhibitor cocktails (Pierce, Thermo Fisher Scientific, Waltham, MA) on ice for 60 minutes. Cell extracts were cleared by centrifugation, and protein concentrations were determined by bicinchoninic acid assays (Pierce). Five micrograms of protein extract was applied to the tyrosine kinase PamChip array (PamGene, ‘s-Hertogenbosch, the Netherlands). Lysates of these cells were incubated on a chip containing peptides that can serve as substrates for tyrosine kinases present in the sample. Phosphorylation was detected by a fluorescently labeled anti-phosphotyrosine antibody. Measurements were performed on a PamStation12 (PamGene). In principle, kinases in the sample actively phosphorylate substrates on the PamChip, in the presence of adenosine triphosphate. A fluorescein isothiocyanate (FITC)–conjugated PY20 antibody is used to detect the phosphorylated tyrosine to quantify the phosphorylation signal.33 Analysis was performed with the BioNavigator software (PamGene). The log fold change (LFC) between untreated and IgM-stimulated samples from the same mouse was calculated.
Phosphatase activity assay
Murine splenic B cells were stimulated with 20 μg/mL goat F(ab′)2 anti-mouse IgM (Southern Biotech) for 10 minutes, washed twice with PBS, and lysed in M-PER mammalian extraction buffer containing Halt protease inhibitor cocktail (Pierce) on ice for 60 minutes. Cell extracts were cleared by centrifugation, and protein concentrations were determined by bicinchoninic acid assays. 0.5 μg of protein extract were applied to the Phosphatase PamChip Array (PamGene). This chip contains proprietary nitro-phosphotyrosine residues. Phosphatases present in the lysate remove the phosphate, and the nitrotyrosine residue is detected by an anti-nitrotyrosine antibody.34 Measurements were performed at PamGene. Analysis was performed with the BioNavigator software (PamGene). The LFC between untreated and IgM-stimulated samples from the same mouse was calculated.
This phosphatase activity assay from PamGene is not yet commercially available; thus, a detailed list of peptides remains confidential at present.
Cytokine profiling of mouse sera
Mouse serum samples were diluted twofold with PBS and subjected to the Mouse Cytokine Array/Chemokine Array 31-Plex using the Millipore MILLIPLEX (Eve Technologies, Calgary, Canada).
In vivo proliferation assay
Two milligrams of bromodeoxyuridine (BrdU; BD Franklin Lakes, NJ) was injected intraperitoneally into young (4- to 5-month old) and old (8- to 10-month-old) TCL1tg/wt Lynup-B and TCL1tg/wt mice. Mice were euthanized 16 hours after BrdU injection. Splenocytes were purified and fixed (IntraPrep Permeabilization Reagent; Beckman Coulter, Brea, CA). Cell-surface markers were labeled before cell permeabilization and intracellular labeling with anti-BrdU-phycoerythrin antibody, as well as Ki67-allophycocyanin antibody and incubated for 1 hour, washed twice, and analyzed via flow cytometry.
Flow cytometry analysis
Cells were labeled with fluorochrome-conjugated antibodies (supplemental Table 1). Intracellular proteins were stained using the IntraPrep Permeabilization Reagent Kit (Beckman Coulter) according to the manufacturer’s instructions. Labeled samples were run on a Gallios (Beckman Coulter) or MACSQuant VYB (Miltenyi Biotec, Bergisch Gladbach, Germany) flow cytometer. Data were analyzed using Kaluza 2.0 Flow Analysis Software (Beckman Coulter).
Western blot and immunohistochemistry
Inhibitor treatment of murine primary cells
Dasatinib, bosutinib, entospletinib, ibrutinib, and idelalisib were purchased from Selleckchem (Houston, TX). Cells were treated with inhibitors for 24 hours. Cell viability was assessed via flow cytometry by Annexin V-pacific blue (BioLegend, San Diego, CA) and 7-AAD (Thermo Fisher Scientific) staining.
Statistical analysis
All statistical differences were calculated with the Mann-Whitney U test (if not otherwise indicated), and comparison of the survival curves was calculated with the Mantel-Cox log-rank test using Prism 8 (GraphPad Software, San Diego, CA). P values are shown only in cases of statistically significantly differences. Lines in dot plots represent medians, and bar graphs with error bars represent mean ± standard error of the mean (SEM), if not otherwise indicated.
Results
Enhanced responsiveness to BCR stimulation in Lynup-B B cells
To analyze the role of constitutively active Lyn kinase exclusively expressed in B cells, we first generated a conditional GFP expressing Rosa26-knockin mouse model harboring the Lyn gene with a point mutation (Y→F) at the inhibitory phosphorylation tyrosine residue (Y508F). The Y508F mutation prevents the phosphorylation of Lyn kinase by the CSK family of enzymes, leading to loss of kinase inhibition and thus a more constitutively active conformation of this kinase.2,9,36 Upon Cre-mediated recombination, the LynY508F-IRES-GFP construct would be expressed, resulting in a constitutively active conformation of Lyn (Figure 1A). The LynY508F-IRES-GFP mice were crossed with the CD19-Cre line,31 yielding mice that express the active Lyn kinase specifically in B cells (Lynup-B). CD19+ B cells of Lynup-B mice showed high levels of GFP, demonstrating that the construct was expressed (Figure 1B). The introduced Lynup mutation mimics the first step of Lyn activation and leads to a more open conformation of the kinase, thereby causing a constitutively active kinase activity.9,10 The enzymatic activity of LynY508F in global Lynup/up mice was enhanced two- to threefold compared with WT mice.10 Accordingly, we could detect a slightly higher responsiveness of Lynup-B B cells to IgM stimulation when testing for the phosphorylation of the Lyn substrates Syk and Ship1 (Figure 1C; supplemental Figure 1D). However, the BCR signaling response varied considerably between individual mice. Therefore, to determine the global changes of kinase activity in real time, we performed a highly sensitive kinase activity profiling with the PamChip 4 microarray (PamGene) using lysates of untreated and IgM-stimulated B cells from WT and Lynup-B animals. This method measures the tyrosine phosphorylation of peptides immobilized on the chip by kinases present in the lysates. Phosphorylated peptides are detected via a fluorescently labeled anti-phosphotyrosine antibody. In unstimulated B cells, we observed subtly lower levels of tyrosine phosphorylation of multiple peptides in Lynup-B B cells compared with WT controls (supplemental Figure 1A). By calculating the LFC between untreated and stimulated B cells of the same mice, we could observe that IgM treatment increased the activity of tyrosine kinases to a greater extent in Lynup-B B cells than in WT B cells (Figure 1D; supplemental Figure 1B; supplemental Table 4). This suggests a stronger responsiveness of the Lynup-B BCR. The measured peptides and their LFC values upon IgM stimulation are provided in supplemental Table 4. This effect was accompanied by the reduction of phosphatase activity in Lynup-B B cells and increased phosphatase activity in WT B cells after IgM stimulation (Figure 1E; supplemental Table 5). In this experiment, the IgM stimulated and unstimulated B-cell lysates were added on a chip, which contains proprietary nitro-phosphotyrosine residues. Phosphatases present in the lysate remove the phosphate and the nitrotyrosine residue gets detected by an anti-nitrotyrosine antibody. LFC values of the phosphatase activity upon IgM stimulation are provided in supplemental Table 5, the peptide substrates are the property of PamGene. Collectively, these results indicated a hyperresponsive BCR toward the positive signaling in the Lynup-B B cells.
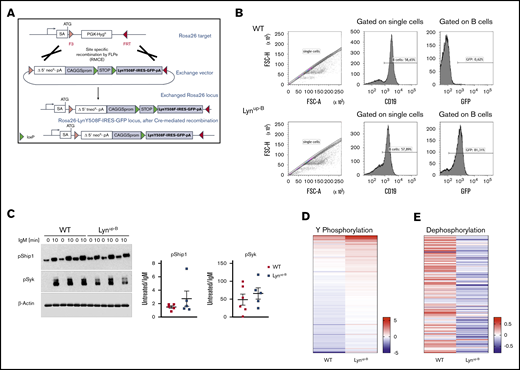
Constitutively active B-cell–specific Lyn enhances signaling upon BCR ligation in normal B cells. (A) Schematic overview of the targeting strategy to establish the LynY508F-IRES-GFP conditional transgene mice using recombinase-mediated cassette exchange (RMCE). (B) Flow cytometric analysis of GFP expression of CD19+ B cells in the spleen of WT and Lynup-B mice. (C) Western blot analysis of purified B cells isolated from spleens of WT and Lynup-B mice. Cells were kept untreated or stimulated with 20 mg/mL IgM for 10 minutes before lysis. The densitometry of the phospho-Syk and phospho-Ship1 bands was normalized to the densitometry of the corresponding β-actin bands. The graph shows the fold changes in densitometry of unstimulated to IgM-stimulated B cells from the same mouse (including samples shown in supplemental Figure 1D). (D) Tyrosine phosphorylation profile of purified B cells from WT (n = 3) and Lynup-B (n = 3) mice upon IgM stimulation. Kinases in B-cell lysates actively phosphorylated substrates on the PamChip. Tyrosine phosphorylation was detected by a FITC-conjugated PY20 antibody to quantify the phosphorylation signal. LFC values between untreated and IgM-stimulated samples were calculated. Each column of the heatmap represents the mean LFC of 3 mice per genotype. A red row indicates higher phosphorylation of the peptides upon IgM treatment, and a blue row implies a lower phosphorylation after IgM treatment. Supplemental Table 4 provides the LFC values for each phosphorylated peptide on the PamChip. (E) Dephosphorylation profile of purified B cells upon IgM stimulation in WT (n = 2) and Lynup-B (n = 2) mice. Phosphatases in the B-cell lysates dephosphorylated proprietary nitrophosphotyrosine residues on a chip. Unphosphorylated nitrotyrosine residues were detected by an anti-nitrotyrosine antibody. LFC values between untreated and IgM stimulated samples were calculated. Each column of the heatmap represents the mean LFC of 2 mice per genotype. A red row indicates higher dephosphorylation of the peptides after IgM treatment, and a blue row implies a lower dephosphorylation after IgM treatment. Supplemental Table 5 provides the LFC values for each dephosphorylated peptide on the phosphatase chip. FSC-A, forward scatter-area; FSC-H, forward scatter-height; SA, splice acceptor sequence.
Constitutively active B-cell–specific Lyn enhances signaling upon BCR ligation in normal B cells. (A) Schematic overview of the targeting strategy to establish the LynY508F-IRES-GFP conditional transgene mice using recombinase-mediated cassette exchange (RMCE). (B) Flow cytometric analysis of GFP expression of CD19+ B cells in the spleen of WT and Lynup-B mice. (C) Western blot analysis of purified B cells isolated from spleens of WT and Lynup-B mice. Cells were kept untreated or stimulated with 20 mg/mL IgM for 10 minutes before lysis. The densitometry of the phospho-Syk and phospho-Ship1 bands was normalized to the densitometry of the corresponding β-actin bands. The graph shows the fold changes in densitometry of unstimulated to IgM-stimulated B cells from the same mouse (including samples shown in supplemental Figure 1D). (D) Tyrosine phosphorylation profile of purified B cells from WT (n = 3) and Lynup-B (n = 3) mice upon IgM stimulation. Kinases in B-cell lysates actively phosphorylated substrates on the PamChip. Tyrosine phosphorylation was detected by a FITC-conjugated PY20 antibody to quantify the phosphorylation signal. LFC values between untreated and IgM-stimulated samples were calculated. Each column of the heatmap represents the mean LFC of 3 mice per genotype. A red row indicates higher phosphorylation of the peptides upon IgM treatment, and a blue row implies a lower phosphorylation after IgM treatment. Supplemental Table 4 provides the LFC values for each phosphorylated peptide on the PamChip. (E) Dephosphorylation profile of purified B cells upon IgM stimulation in WT (n = 2) and Lynup-B (n = 2) mice. Phosphatases in the B-cell lysates dephosphorylated proprietary nitrophosphotyrosine residues on a chip. Unphosphorylated nitrotyrosine residues were detected by an anti-nitrotyrosine antibody. LFC values between untreated and IgM stimulated samples were calculated. Each column of the heatmap represents the mean LFC of 2 mice per genotype. A red row indicates higher dephosphorylation of the peptides after IgM treatment, and a blue row implies a lower dephosphorylation after IgM treatment. Supplemental Table 5 provides the LFC values for each dephosphorylated peptide on the phosphatase chip. FSC-A, forward scatter-area; FSC-H, forward scatter-height; SA, splice acceptor sequence.
Subtle changes in the phenotype of Lynup-B mice
Since global Lynup/up mice have lower B-cell counts,10 we monitored B-cell counts in blood samples of WT and Lynup-B mice and observed a slight reduction in the percentage of B cells in Lynup-B mice as early as 2 months after treatment, and this reduction was retained throughout the mouse lifespan (Figure 2A). The reduction of B cells was less apparent in the spleens of Lynup-B mice (Figure 2B). We did not detect any clear difference in immune composition between groups when comparing the percentages of T cells and monocytes, or the red blood cell count (supplemental Figure 2A-C). Similarly, the composition of immune cells in the spleens of both cohorts was comparable (supplemental Figure 2D-E). The increased BCR responsiveness did not affect the secretion and amount of critical cytokines in serum samples of Lynup-B and WT mice (Figure 2C). The median survival Lynup-B mice (710 days; n = 28) was significantly reduced by 51 days compared with WT mice (761 days; n = 28) (Figure 2D). This survival difference might be partially due to the development of anti-nuclear autoantibodies in some Lynup-B mice as early as 3 months of age (supplemental Figure 2F), which was also reported in global Lynup/up mice.10
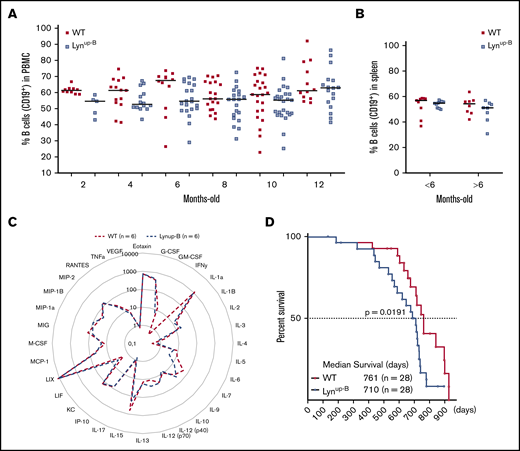
Lynup-Bmutation leads to subtle phenotypic changes. (A) Flow cytometric analysis of CD19+ cells in the peripheral blood of WT and Lynup-B mice over 1 year. (B) Flow cytometric analysis of CD19+ B cells in the spleens of young (<6 months) and old (>6 months) WT and Lynup-B mice. (C) Cytokine profile in sera of WT (n = 6) and Lynup-B (n = 6) mice. Data represent mean values (pg/mL). IL, interleukin. (D) Kaplan-Meier curves representing the overall survival of WT and Lynup-B mice from birth to moribund; P value was calculated by Mantel-Cox log-rank test. PBMC, peripheral blood mononuclear cell.
Lynup-Bmutation leads to subtle phenotypic changes. (A) Flow cytometric analysis of CD19+ cells in the peripheral blood of WT and Lynup-B mice over 1 year. (B) Flow cytometric analysis of CD19+ B cells in the spleens of young (<6 months) and old (>6 months) WT and Lynup-B mice. (C) Cytokine profile in sera of WT (n = 6) and Lynup-B (n = 6) mice. Data represent mean values (pg/mL). IL, interleukin. (D) Kaplan-Meier curves representing the overall survival of WT and Lynup-B mice from birth to moribund; P value was calculated by Mantel-Cox log-rank test. PBMC, peripheral blood mononuclear cell.
No clear difference in CLL burden in TCL1tg/wt Lynup-B mice compared with TCL1tg/wt mice
Since Lyn and the BCR were reported to be hyperactive in CLL cells,11,14 it was postulated that Lyn activation might contribute to disease progression in CLL. To test this hypothesis, Lynup-B mice were crossbred with a well-established CLL model, Eµ-TCL1 transgenic mice,32 yielding TCL1tg/wt Lynup-B mice. Expression of the Lynup-B mutation in B cells of all TCL1tg/wt Lynup-B mice could be confirmed with GFP expression (data not shown). The CLL burden in TCL1tg/wt Lynup-B and TCL1tg/wt mice was examined in the peripheral blood over 1 year. A trend toward increased proportions of CLL cells could be observed in blood of TCL1tg/wt Lynup-B mice starting at month 6 (TCL1tg/wt Lynup-B 35.41% vs TCL1tg/wt 26.00%) and even more pronounced at months 8 (TCL1tg/wt Lynup-B 57.07% vs TCL1tg/wt 44.21%) and 10 (TCL1tg/wt Lynup-B 69.58% vs TCL1tg/wt 50.86%). This difference diminished in the blood at 12 months of age when CLL manifested in both genotypes (Figure 3A). CLL infiltration into the spleens and bone marrow showed no difference in 3-month-old and 6- to 8-month-old mice and only a marginal increase in moribund TCL1tg/wt Lynup-B mice compared with TCL1tg/wt counterparts (Figure 3B-C). We did not detect differences in the weight of spleens and livers in both genotypes (Figure 3D-E), and serum cytokine profiles did not differ between both genotypes (Figure 3F). To examine potential influence of the Lynup-B mutation on the CLL cell turnover rate, we investigated CLL cell proliferation via BrdU incorporation and Ki67-expressing CLL cells in the spleen of young (4- to 5-month old) and old (8- to 10-month old) TCL1tg/wt Lynup-B and TCL1tg/wt mice; again, no clear difference between both genotypes could be found (Figure 3G-H). TCL1tg/wt Lynup-B CLL cells also showed no significant change in their spontaneous cell death rate as observed with cleaved caspase-3 labeling in spleen tissues (Figure 3I). Finally, the Lynup-B mutation did not affect the overall survival of CLL mice, as TCL1tg/wt mice lived 381 days (n = 39) and TCL1tg/wt Lynup-B mice lived 388 days (n = 37) on average (Figure 3J).
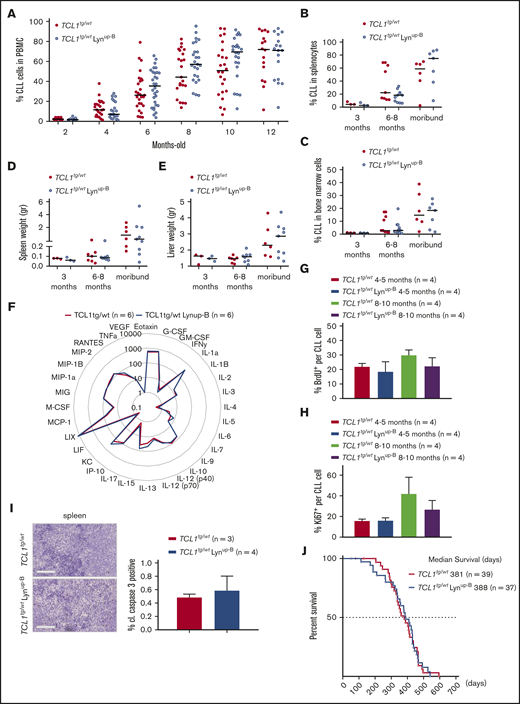
TCL1tg/wtLynup-Bmice show no clear difference in CLL burden compared with TCL1tg/wtmice. (A) Flow cytometric analysis of CD19+ CD5+ CLL cells in the peripheral blood of TCL1tg/wt and TCL1tg/wt Lynup-B mice over 1 year. (B) Flow cytometric analysis of CLL cells in spleens of age-matched and moribund mice. (C) Flow cytometric analysis of CLL cells in bone marrow samples of age-matched and moribund mice. (D) Spleen weights of age-matched and moribund TCL1tg/wt and TCL1tg/wt Lynup-B mice. (E) Liver weights of age-matched and moribund TCL1tg/wt and TCL1tg/wt Lynup-B mice. (F) Cytokine profile in sera of 6 TCL1tg/wt and TCL1tg/wt Lynup-B mice. Data represent mean values (pg/mL). (G) Flow cytometric analysis of in vivo BrdU incorporation rate in splenic CLL cells of mice at 4 to 5 months and 8 to 10 months 16 hours after injection of BrdU. (H) Flow cytometric analysis of Ki67+ splenic CLL cells of young (4- to 5-month old) and old (8- to 10-month old) mice. (I) Representative immunohistochemical staining of cleaved caspase-3 (cl. casp. 3) from sections of spleens from TCL1tg/wt and TCL1tg/wt Lynup-B mice. Scale bars represent 100 µm. Quantification of cleaved caspase-3–positive cells represent means ± SEM of 3 TCL1tg/wt and 4 TCL1tg/wt Lynup-B mice. (J) Kaplan-Meier curves representing the overall survival of TCL1tg/wt and TCL1tg/wt Lynup-B mice from birth to moribund.
TCL1tg/wtLynup-Bmice show no clear difference in CLL burden compared with TCL1tg/wtmice. (A) Flow cytometric analysis of CD19+ CD5+ CLL cells in the peripheral blood of TCL1tg/wt and TCL1tg/wt Lynup-B mice over 1 year. (B) Flow cytometric analysis of CLL cells in spleens of age-matched and moribund mice. (C) Flow cytometric analysis of CLL cells in bone marrow samples of age-matched and moribund mice. (D) Spleen weights of age-matched and moribund TCL1tg/wt and TCL1tg/wt Lynup-B mice. (E) Liver weights of age-matched and moribund TCL1tg/wt and TCL1tg/wt Lynup-B mice. (F) Cytokine profile in sera of 6 TCL1tg/wt and TCL1tg/wt Lynup-B mice. Data represent mean values (pg/mL). (G) Flow cytometric analysis of in vivo BrdU incorporation rate in splenic CLL cells of mice at 4 to 5 months and 8 to 10 months 16 hours after injection of BrdU. (H) Flow cytometric analysis of Ki67+ splenic CLL cells of young (4- to 5-month old) and old (8- to 10-month old) mice. (I) Representative immunohistochemical staining of cleaved caspase-3 (cl. casp. 3) from sections of spleens from TCL1tg/wt and TCL1tg/wt Lynup-B mice. Scale bars represent 100 µm. Quantification of cleaved caspase-3–positive cells represent means ± SEM of 3 TCL1tg/wt and 4 TCL1tg/wt Lynup-B mice. (J) Kaplan-Meier curves representing the overall survival of TCL1tg/wt and TCL1tg/wt Lynup-B mice from birth to moribund.
Lynup-B -induced BCR responsiveness is masked in the Eµ-TCL1 transgenic background
The surprising lack of a clear effect of Lynup-B phenotype in the CLL mouse model prompted us to examine the effect of Lyn inhibition in their purified B cells ex vivo. Here, TCL1tg/wt Lynup-B B cells exhibited slightly higher basal viability than TCL1tg/wt B cells and remained more viable after treatment with the Lyn/SFK inhibitors dasatinib and bosutinib, but their sensitivity and inhibitor-induced apoptosis rate were comparable to those of TCL1tg/wt B cells (Figure 4A). The equal apoptosis rate upon Lyn inhibition was also observed when murine B cells were stimulated with IgM (Figure 4B). Similarly, treatment of TCL1tg/wt Lynup-B and TCL1tg/wt B cells with high concentrations of various kinase inhibitors of the BCR including dasatinib, entospletinib (Syk inhibitor), ibrutinib (Btk inhibitor), and idelalisib (PI3Kδ inhibitor) exerted similar apoptosis inducing effects to both unstimulated and IgM-stimulated B cells (Figure 4C-D). To examine whether the enhanced BCR responsiveness was retained in TCL1tg/wt Lynup-B B cells, the phosphorylation levels of Lyn’s substrates Syk and Ship1 after BCR stimulation were assessed by western blot. We could not detect clear differences in the BCR signaling of both genotypes, largely due to the enormous variation in each individual mouse regardless of the Lyn mutant (Figure 4E; supplemental Figure 3A-C). Thus, we used the tyrosine kinase and phosphatase activity assays again with unstimulated and IgM-stimulated TCL1tg/wt Lynup-B and TCL1tg/wt B cells. Although a higher phosphorylation of tyrosine peptides was observed upon IgM stimulation in TCL1tg/wt Lynup-B B cells than in TCL1tg/wt B cells (Figure 4F; supplemental Figure 1C; supplemental Table 6), the differences were less prominent than those observed between WT and Lynup-B B cells (Figure 1D). In general, TCL1tg/wt B cells showed higher levels of baseline tyrosine phosphorylation of multiple phosphoproteins than WT B cells (supplemental Figure 1A). Regarding phosphatase activity, the stimulated phosphatase activity in response to IgM of TCL1tg/wt Lynup-B B cells (Figure 4G; supplemental Table 7) showed no difference compared with TCL1tg/wt B cells, in contrast to the situation in Lynup-B B cells (Figure 1E), possibly owing to the greater phosphatase activity of TCL1tg/wt B cells compared with WT B cells (supplemental Figure 4). Altogether, the results suggest that the presence of the TCL1 oncogene enhances positive BCR signaling in the CLL mouse model, masking some of the effects of Lynup-B on BCR signaling.
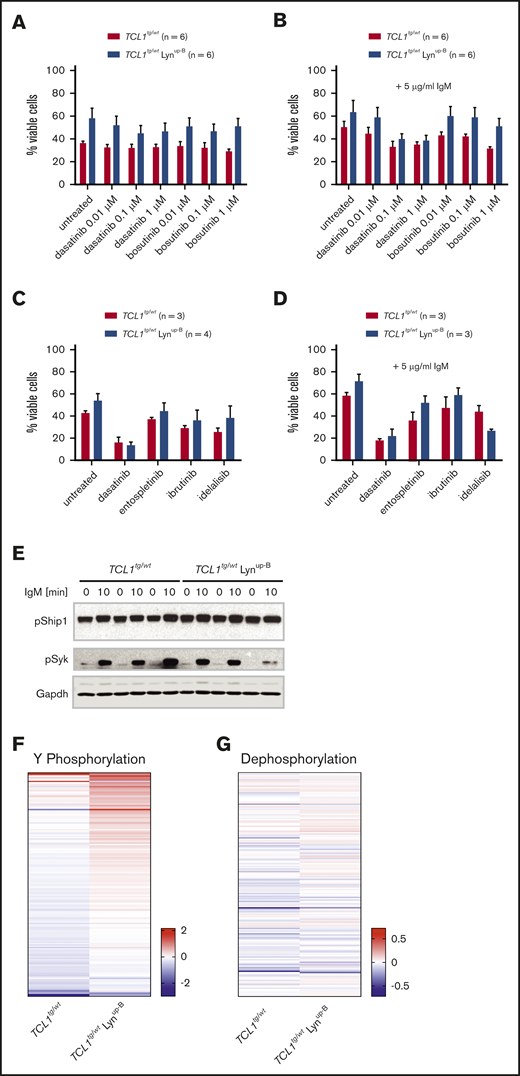
Lynup-Bslightly enhances ex vivo viability of murine CLL cells, but Lynup-B-induced BCR responsiveness is masked in the Eµ-TCL1 transgenic background. (A) Flow cytometry analysis of viable (Annexin V−) B cells upon treatment with the Lyn/Src inhibitors dasatinib and bosutinib at stated concentrations for 24 hours. (B) Flow cytometry analysis of viable (Annexin V−), IgM-stimulated B cells upon treatment with the Lyn/Src inhibitors dasatinib and bosutinib at stated concentrations for 24 hours. (C) Flow cytometry analysis of viable (7-AAD− Annexin V-) B cells upon treatment with BCR inhibitors dasatinib, entospletinib, ibrutinib and idelalisib at 5 µM for 24 hours. (D) Flow cytometry analysis of viable (7-AAD− Annexin V−), IgM-stimulated B cells upon treatment with BCR inhibitors dasatinib, entospletinib, ibrutinib, and idelalisib at 5 µM for 24 hours. (E) Western blot analysis of purified B cells isolated from spleens of TCL1tg/wt and TCL1tg/wt Lynup-B mice. Cells were kept untreated or stimulated with 20 mg/mL IgM for 10 minutes before lysis. (F) Tyrosine phosphorylation profile of purified B cells from TCL1tg/wt (n = 3) and TCL1tg/wt Lynup-B (n = 3) mice upon IgM stimulation. Kinases in B-cell lysates actively phosphorylated substrates on the PamChip. Tyrosine phosphorylation was detected by a FITC-conjugated PY20 antibody to quantify the phosphorylation signal. LFC values between untreated and IgM-stimulated samples were calculated. Each column of the heatmap represents the mean LFC of 3 mice per genotype. A red row indicates higher phosphorylation of the peptides upon IgM treatment, and a blue row implies a lower phosphorylation after IgM treatment. Supplemental Table 4 provides the LFC values for each phosphorylated peptide on the PamChip. (G) Dephosphorylation profile of purified B cells from TCL1tg/wt (n = 2) and TCL1tg/wt Lynup-B (n = 2) mice upon IgM stimulation. Phosphatases in the B-cell lysates dephosphorylated proprietary nitrophosphotyrosine residues on a chip. Unphosphorylated nitrotyrosine residues were detected by an anti-nitrotyrosine antibody. LFC values between untreated and IgM-stimulated samples. Each column of the heatmap represents the mean LFC of 2 mice per genotype. A red row indicates higher dephosphorylation of the peptides after IgM treatment, and a blue row implies a lower dephosphorylation after IgM treatment. Supplemental Table 5 provides the LFC values for each dephosphorylated peptide on the phosphatase chip.
Lynup-Bslightly enhances ex vivo viability of murine CLL cells, but Lynup-B-induced BCR responsiveness is masked in the Eµ-TCL1 transgenic background. (A) Flow cytometry analysis of viable (Annexin V−) B cells upon treatment with the Lyn/Src inhibitors dasatinib and bosutinib at stated concentrations for 24 hours. (B) Flow cytometry analysis of viable (Annexin V−), IgM-stimulated B cells upon treatment with the Lyn/Src inhibitors dasatinib and bosutinib at stated concentrations for 24 hours. (C) Flow cytometry analysis of viable (7-AAD− Annexin V-) B cells upon treatment with BCR inhibitors dasatinib, entospletinib, ibrutinib and idelalisib at 5 µM for 24 hours. (D) Flow cytometry analysis of viable (7-AAD− Annexin V−), IgM-stimulated B cells upon treatment with BCR inhibitors dasatinib, entospletinib, ibrutinib, and idelalisib at 5 µM for 24 hours. (E) Western blot analysis of purified B cells isolated from spleens of TCL1tg/wt and TCL1tg/wt Lynup-B mice. Cells were kept untreated or stimulated with 20 mg/mL IgM for 10 minutes before lysis. (F) Tyrosine phosphorylation profile of purified B cells from TCL1tg/wt (n = 3) and TCL1tg/wt Lynup-B (n = 3) mice upon IgM stimulation. Kinases in B-cell lysates actively phosphorylated substrates on the PamChip. Tyrosine phosphorylation was detected by a FITC-conjugated PY20 antibody to quantify the phosphorylation signal. LFC values between untreated and IgM-stimulated samples were calculated. Each column of the heatmap represents the mean LFC of 3 mice per genotype. A red row indicates higher phosphorylation of the peptides upon IgM treatment, and a blue row implies a lower phosphorylation after IgM treatment. Supplemental Table 4 provides the LFC values for each phosphorylated peptide on the PamChip. (G) Dephosphorylation profile of purified B cells from TCL1tg/wt (n = 2) and TCL1tg/wt Lynup-B (n = 2) mice upon IgM stimulation. Phosphatases in the B-cell lysates dephosphorylated proprietary nitrophosphotyrosine residues on a chip. Unphosphorylated nitrotyrosine residues were detected by an anti-nitrotyrosine antibody. LFC values between untreated and IgM-stimulated samples. Each column of the heatmap represents the mean LFC of 2 mice per genotype. A red row indicates higher dephosphorylation of the peptides after IgM treatment, and a blue row implies a lower dephosphorylation after IgM treatment. Supplemental Table 5 provides the LFC values for each dephosphorylated peptide on the phosphatase chip.
Discussion
In this study, we showed that the LynY508F mutation in B cells could induce an enhanced BCR signaling responsiveness. Lynup-B mice exhibited mild phenotypic changes with slightly reduced B-cell number and shortened overall survival. However, LynY508F-induced BCR responsiveness was mitigated in Eµ-TCL1 transgenic CLL mice. Overall, Lynup-B mutation had a very limited effect on leukemic development in vivo.
Our analyses of kinase and phosphatase activities using a highly sensitive profiling platform in the B-cell–specific Lynup-B mouse model is congruent with previous findings in global Lynup/up mice that showed higher phosphorylation of Lyn substrates in Lynup/up B cells than WT B cells upon BCR stimulation, including both tyrosine kinases and phosphatases.9,10 Moreover, our profiling approach has provided an extended view of the equilibrium between positive and negative BCR signaling controlled by Lyn kinase. In the absence of a stimulus, the activation of phosphatases was more prominent in Lynup-B B cells, and this magnified negative signaling overpowered the positive signaling (supplemental Figure 4).5,10 Upon IgM stimulation, the kinase phosphorylation status of Lynup-B B cells increased to a greater extent than phosphatase activation, shifting their BCR activation further toward the positive signaling than in WT samples (Figure 1D; supplemental Figure 1; visual abstract).
Our observation that Lynup-B mice had somewhat lower B-cell counts in the peripheral blood (Figure 2A) is in agreement with the lower B-cell counts previously reported in Lynup/up mice.10 The decreased numbers of peripheral B cells were suggested to be a defect in proliferation despite the hyperresponsive BCR.10 Moreover, several reports have shown that Lyn can interact with checkpoint molecules of the DNA damage response pathway and induce apoptosis.37,38 In CLL patients, the elevated kinase activity of Lyn displayed in CLL cells was also linked to apoptosis defects by its interaction with SHP-124 or procaspase-8.22 Both Lynup/up and Lynup-B mice had a shorter overall survival compared with their WT counterparts (Figure 2D). However, our Lynup-B mice seemed to have a milder phenotype and a longer overall survival than Lynup/up mice,10 corroborating the important role of the LynY508F mutation in non-B cells that strongly influences the Lynup/up mouse phenotype. Myeloid cells of Lynup/up mice were shown to exhibit differential recruitment of phosphatases to the cell membrane.9 In concordance, Lynup/up dendritic cells are hypersensitive to endotoxin challenge that in turn provokes a robust natural killer (NK) cell response.39 Other defects in the immune system of Lynup/up mice, such as anemia, can be attributed to alterations in Epo signaling in erythroid cells.40 These innate immune defects seem to be absent in our Lynup-B mice, in which no clear changes to the myeloid compartment could be observed, and the erythrocyte count was comparable to WT mice, even in 12-month-old mice (supplemental Figure 2B-C).
Given the pivotal role of the BCR signaling in CLL development11,12 and the accumulating evidence for the role of Lyn in CLL cells,14,24 it was surprising that we did not observe any significant change in CLL development in TCL1tg/wt Lynup-B mice, although we still detected a higher global phosphorylation of TCL1tg/wt Lynup-B B cells upon BCR stimulation compared with TCL1tg/wt B cells by kinase activity profiling (Figure 4F). Notably, the increase in BCR responsiveness in TCL1tg/wt Lynup-B vs TCL1tg/wt B cells was clearly attenuated compared with the increase in Lynup-B vs WT B cells, suggesting a diminished activity of the Lynup-B mutation in the presence of the TCL1 oncogene. This finding might be explained at least in part by the amplification of BCR signaling by TCL1 in TCL1tg/wt mice (supplemental Figure 1A,C). The BCR signaling of TCL1tg/wt mice seems somewhat reminiscent of the more aggressive forms of CLL,41 where TCL1 acts as a coactivator of AKT.42,43 By activating AKT, TCL1 strongly enhances the PI3K signaling pathway. PI3K inhibitors and dual inhibitors were shown to exhibit antitumor efficacy in the Eµ-TCL1-induced CLL mouse models.44,45 PI3K inhibition also induced apoptosis in primary CLL cells in vitro, which is mediated by PKCδ activation.46 Furthermore, BCR-induced growth of CLL cells strongly correlates with TCL1 and phospho-AKT activation.47 Having considered the already strong activation of the PI3K/AKT pathway in CLL cells of TCL1tg/wt mice, it seems plausible that additional enhancement of BCR responsiveness did not introduce a clear effect in our TCL1tg/wt Lynup-B model.
In addition, the Eµ-TCL1 transgene was shown to induce murine CLL via its activity in the nucleus and its interactions with diverse nuclear factors, including ATM and IκB.48,49 TCL1 can inhibit de novo DNA methylation50 and regulate transcription by enhancing NF-κB activity and inhibiting AP-1.51 These results suggest that TCL1 is a powerful oncogene, inducing malignant transformation of B cells by interacting with and enhancing the activities of many BCR downstream effectors or transcriptional factors independent of the BCR. Therefore, it seems possible that TCL1 may have overridden some of the effects of the constitutively active Lyn in the TCL1tg/wt Lynup-B mouse model shown in our study.
A unique feature of the BCR of human and murine CLL cells is the antigen-independent autonomous signaling that represents a precondition for malignant transformation, whereas signals induced by external antigen were suggested to increase the aggressiveness of CLL.52,53 Our results showing that a higher responsiveness of the BCR in TCL1tg/wt Lynup-B B cells may increase CLL expansion at later disease stages in the peripheral blood are in agreement with this hypothesis (Figure 3A), while more substantial effects on survival or organ infiltration were not detectable. This result is in full agreement with our previous findings showing that TCL1tg/wtLyn−/− B cells could transform effectively into CLL cells, even in the complete absence of Lyn kinase, at the early stage of disease despite their reduced BCR responsiveness.30
Another point to consider is the particular mode of kinase activation in our Lynup-B mouse model. Lyn kinase, like other Src family kinases, is activated in a “graded” manner.2 The dephosphorylation of the regulatory Y508 represents the first step in Lyn activation, which is followed by a cascade of additional events such as the trans-autophosphorylation of Lyn within the activation loop and the binding of exogenous ligands to the SH2 and SH3 domains. The later steps are required to create the fully active form of the enzyme.2,6 Therefore, the degree of Lyn activation introduced by the Y508F mutation in our experiments may have been insufficient to induce more significant changes toward a more aggressive CLL phenotype in TCL1tg/wt mice.
On the other side, targeting BCR-associated kinases such as Btk, a downstream effector of Lyn signaling,30 in TCL1tg/wt mice has been proven highly effective. As a matter of fact, the marked efficacy of several BCR inhibitors, particularly Btk inhibitors, has been repeatedly demonstrated in this model. Ibrutinib treatment of Eµ-TCL1 mice prolonged their overall survival for ∼2 months54 and reduced overall CLL burden in blood, spleen, and liver of recipient mice after adoptive transfer of murine CLL cells.55 Ibrutinib was also very effective in Eµ-TCL1 mice harboring a Tp53 mutation leading to a more aggressive form of CLL.56 These results were fully reflective of the excellent therapeutic activity of ibrutinib in CLL patients.13 A second generation of Btk inhibitors, such as acalabrutinib and spebrutinib, also induced delays of CLL development in the adoptive transfer Eµ-TCL1 mouse model.57,58 However, Btk inhibition also causes substantial changes in the interaction between CLL cells and their tumor microenvironment, in agreement with our findings showing that the modulation of a kinase that activates Btk, namely Lyn, may exert therapeutic effects outside the B-cell context.3 We previously showed by transplanting CLL cells from Eµ-TCL1 mice into Lyn−/− and Btk−/− recipient mice that the absence of these kinases delayed leukemic progression significantly and prolonged survival of the knockout recipients.30 A similar observation was also reported for PI3Kδ inactive mutant recipients, which also showed a delayed leukemia pathogenesis in TCL1tg/wt mice and after adoptive transplantation.59 Here, PI3Kδ activity in CD4+ and CD8+ T cells was determined to be critical for leukemia resistance.59 In CLL patients, agents that are supposed to exclusively target BCR-associated kinases, such as Btk, seem to modulate the leukemia-supportive capacity of bystander cells in the leukemic microenvironment.3,60
Taken together, our studies demonstrate that B cells of Lynup-B mice with enhanced BCR responsiveness, like Lyn−/− mice with defective BCR signaling,30 had only a moderate effect on the development and aggressiveness of leukemic B cells in the Eµ-TCL1 transgenic mouse model of CLL. Hence, the findings lend further support to the concept that the clinical efficacy of kinase inhibitors targeting the BCR signaling pathway in CLL therapy may depend to some extent on the remodeling of the leukemic environment and interruption of the dialog between tumor cells and bystander cells.3,61
Data sharing requests should be sent via e-mail to M.H. (michael.hallek@uni-koeln.de) and P.-H.N. (hien.nguyen@uk-koeln.de).
Acknowledgment
This study was supported by the German Research Council (grants SFB 832 and KFO 286) (M.H.).
Authorship
Contribution: V.K. and P.-H.N. designed and performed experiments, analyzed data, and wrote the manuscript; and M.H. initiated and supervised the study and critically revised the manuscript.
Conflict-of-interest disclosure: This study was partially supported by research funding from Gilead Sciences to M.H. The remaining authors declare no competing financial interests.
Correspondence: Michael Hallek, Department I of Internal Medicine, Center for Integrated Oncology, University of Cologne, Building 70, Kerpener Str 62, 50937 Cologne, Germany; e-mail: michael.hallek@uni-koeln.de; and Phuong-Hien Nguyen, Department I of Internal Medicine, CECAD Research Center, University of Cologne, Building 69, Joseph-Stelzmann Str 26, 50931 Cologne, Germany; e-mail: hien.nguyen@uk-koeln.de.

