

Key Points
Sixty-two percent (1450/2334) of newly diagnosed MM patients have unchanged renal function at 12 months.
The proportion of renal function change from baseline at 12 months comprised 38%: 22% improved and 16% had a decline in renal function.

Abstract
Renal injury is a common complication of multiple myeloma (MM) and is associated with adverse outcome. Despite this, the natural history of renal injury in patients with MM remains uncertain especially in the context of intensive therapy and novel therapies. To address the lack of data, we evaluated the renal function of 2334 patients from the UK National Cancer Research Institute Myeloma XI trial at baseline and at 12 months to assess renal function over time and the factors associated with change. Patients who had severe acute kidney injury or a requirement for dialysis were excluded. At 12 months of the 1450 evaluable patients planned for autologous transplantation; 204 (14%) patients had a decline in estimated glomerular filtration rate (eGFR) ≥25% from baseline, 341 (23.5%) had an improvement and 905 (62%) had no significant change in eGFR. Renal outcome at 12 months for the 884 evaluable patients who were not planned for transplant was similar. Improved renal function was more likely if patients were <70 years old, male, had an average eGFR <60 mL per minute per 1.73 m2 and a higher baseline free light chain level >1000 mg/L, and/or a free light chain response of >90%. It did not correlate with monoclonal–protein response, transplantation, or use of a bortezomib-based regimen. We show that with current therapies the proportion of patients who have a significant decline in renal function in the first 12 months is small. The greatest relative improvement in eGFR is seen in patients with high free light chain at baseline and a high light chain response. This trial was registered at http://www.isrctn.com as #49407852.
Introduction
Around 50% of patients with multiple myeloma (MM) have renal impairment (RI) at presentation as defined by an estimated glomerular filtration rate (eGFR) <60 mL per minute per 1.73 m2. Severe RI (eGFR <30 mL per minute per 1.73 m2) affects up to 20% and is associated with poorer outcomes.1-4 Many patients with severe RI have severe acute kidney injury (AKI; stage 3); some of these patients are dialysis dependent at or shortly after presentation: in this group of patients, 1-year survival improves if there is recovery of renal function.5-7 Many of these patients have myeloma cast nephropathy (MCN) caused by high levels of serum free light chain (sFLC). With rapid reduction of sFLC, many patients with MCN will recover kidney function. However, most patients with a low eGFR have chronic kidney disease (CKD) and mild to moderate RI (eGFR, 30-59 mL per minute); in this group, the effect of RI on long-term outcomes is uncertain. In addition, it is not known what proportion of patients with mild to moderate RI have MCN as a component of their RI.
Understanding the natural history of renal function in patients with myeloma, including the impact of mild to moderate RI on clinical outcomes in patients with MM, will become increasingly important as long-term outcomes continue to improve. In many long-term diseases, the baseline level of kidney function is a major determinant of patient survival. Defining the contribution of kidney disease stratified by severity on outcomes will inform discussions around future therapy choices and overall long-term prognosis. In addition, there has been no large-scale assessment of the relationship between renal function change postinduction and sFLC at presentation and the change in sFLC postinduction in patients with mild to moderate RI at presentation.
To address this lack of knowledge on the impact of renal disease on outcomes in the era of novel therapies and transplantation, we used data from the Myeloma XI trial; the largest trial of newly diagnosed MM (NDMM) patients to assess the renal function at presentation and sFLC pre- and postinduction on 12-month renal function and patient survival.
Methods
Myeloma XI trial patients
Myeloma XI was a phase 3, randomized, multicenter, parallel group design, open-labeled trial of thalidomide, lenalidomide, carfilzomib, and bortezomib induction combinations, with maintenance lenalidomide ± vorinostat in NDMM patients with symptomatic myeloma. A multicenter research ethics committee and local ethics committees approved the protocol and all patients gave written informed consent in accordance with the Declaration of Helsinki. The main trial results have been published elsewhere.8-10
The trial had 2 distinct treatment pathways: the intensive pathway, which included younger patients in whom high-dose therapy with stem cell support was deemed appropriate, and the nonintensive pathway that included patients who were deemed unsuitable for a transplant. In both pathways, patients were randomized to induction therapy with cyclophosphamide, thalidomide, and dexamethasone (CTD) or cyclophosphamide lenalidomide and dexamethasone (CRD) and ± cyclophosphamide, bortezomib, dexamethasone (CVD) intensification in patients with suboptimal response to CRD or CTD and treated to maximum response. In a modification of the trial carfilzomib, cyclophosphamide, lenalidomide, and dexamethasone was used as induction compared with the response adapted approach with CTD or CRD ± CVD. Posttransplant (or after the completion of induction if transplant ineligible) patients were randomized to lenalidomide, lenalidomide and vorinostat, or no maintenance treatment.
Patients aged 18 years or older with symptomatic new myeloma were eligible to participate. Patients who required dialysis on presentation or those with AKI, characterized by creatinine >500 µmol/L or urine output <400 mL per day, that was unresponsive following 72 hours of rehydration were excluded.8 The treatment pathway was decided on an individual basis based on a combination of the patient’s performance status, clinical judgment, and participant preference.
Baseline characteristics
The baseline variables included age, ethnicity, gender, paraprotein type (Sebia), serum creatinine (Roche) at baseline and at 12 ± 3 months, and sFLC (Freelite assay from The Binding Site Ltd, Birmingham, United Kingdom) at baseline and at 12 ± 3 months. eGFR was calculated using the Modification of Diet in Renal Disease formula. Renal function was stratified according to level of eGFR; eGFR >59 mL per minute per 1.73 m2, eGFR 30 to 59 mL per minute per 1.73 m2, or an eGFR <30 mL per minute per 1.73 m2.11
Renal outcome and hematological response assessments
Patients who had baseline and 12-month eGFR results available at the central laboratory database were included in the renal response assessment (n = 2334) (Figure 1). If a 12-month eGFR was not available, then the closest sample taken within ±3 months of 12 months was regarded as 12-month eGFR. Patients who did not have a baseline eGFR (n = 265) or a 12-month follow-up sample (n = 1768) were excluded from this analysis (Figure 1). Any positive or negative change in eGFR <25% at 12 months compared with baseline was considered no change; change in eGFR ≥25% at 12 months compared with baseline was considered significant.12
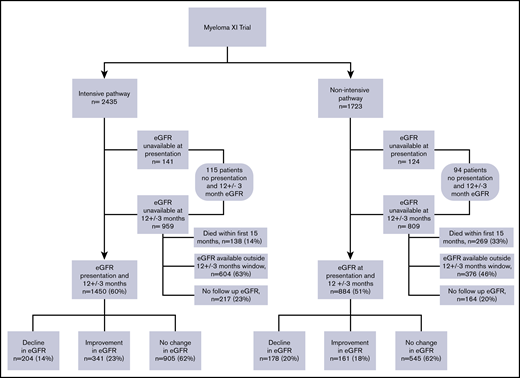
National Cancer Research Institute Myeloma XI trial consort diagram showing patient distribution with a baseline and 12 ± 3-month eGFR.
National Cancer Research Institute Myeloma XI trial consort diagram showing patient distribution with a baseline and 12 ± 3-month eGFR.
Patients were categorized into 3 renal outcome groups; patients who had a decline in eGFR (≥25%), those who had an improvement in eGFR (≥25%), and patients who maintained their renal function at 12 months (<25% change). Patients starting with normal renal function (ie, eGFR ≥90 mL per minute per 1.73 m2) were not included in the analysis of improvement.
Polyclonal sFLC concentrations increase progressively with declining renal function.13 To provide a meaningful assessment of the hematological disease response, only patients who had a difference between the involved and the uninvolved free light chain serum levels (dFLC) level >100 mg/L were included in the measurement of the serum dFLC response.14 Patients with progression of their myeloma were not excluded from analyses.
Statistical methods
Statistical analysis was performed using SPSS for Windows, version 21.0 (SPSS Inc, Chicago, IL). Categorical variables were summarized as frequencies and percentages. Comparison for categorical variables among different groups was made with χ2 test and Fisher’s exact test where appropriate. Continuous variables were expressed as median with interquartile range (IQR) for data that was not normally distributed.
The Mann-Whitney U test was used to compare differences in age, baseline eGFR, and baseline dFLC. The Kruskal-Wallis test was used to compare differences in age, baseline eGFR, 12-month eGFR, and baseline dFLC level in the 3 renal outcome groups defined on the basis of change in eGFR. The association between different baseline dFLC categories, dFLC response level, and the 3 renal outcome groups defined by change in eGFR was assessed by χ2 test.
Kaplan-Meier analyses were used to report patient survival, and the curves were compared using the log-rank test. Logistic regression analysis was used to determine factors associated with renal outcome. The outcome categories were based on changes in eGFR from baseline to 12 months; therefore, problems associated with mathematical coupling would have been introduced had baseline eGFR level been included as an explanatory variable. For continuous variables, under the assumption of equality of variances of initial and final values, change and initial value are correlated, but change and mean of initial and final values are not.15 For this reason, eGFR levels based on an average of baseline and 12-month eGFR were used in the regression model.
Results
Baseline characteristics
The Myeloma XI study enrolled 4420 patients; for 4158 patients, the central laboratory analyses for these patients have been used in the study. In total, 55% of patients presented with an eGFR ≥60 mL per minute per 1.73 m2. A total of 2435 (58.5%) patients were assigned to the intensive pathway and 1723 (41.4%) to the nonintensive pathway (Figure 1). Baseline characteristics are shown (Table 1). Compared with the nonintensive pathway, patients in the intensive pathway were younger, with a median age of 65 years (IQR, 70-59) vs 79 years (IQR, 75-83) (P < .001), and had better renal function at presentation, median eGFR 68 mL per minute per 1.73 m2 (IQR, 54-85) vs 58 mL per minute per 1.73 m2 (IQR, 44-75) (P < .001). Patients in the intensive pathway had a significantly better dFLC response at 12 months; dFLC response >90% of 36% compared with 21% in the nonintensive pathway (P < .001).
Baseline characteristics of patients recruited to Myeloma XI by treatment pathway
| Characteristics | Total | Intensive pathway | Nonintensive pathway | P |
|---|---|---|---|---|
| N or n (%) | 4158 | 2435 (58.5) | 1723 (41.4) | |
| Age, y | ||||
| Median (IQR) | 71 (78-64) | 65 (70-59) | 79 (83-75) | <.001 |
| Sex, n (%) | ||||
| Male:female | 2439 (59):1719 (41) | 1462 (60):973 (40) | 977 (57):746 (43) | .031 |
| Ethnicity, n (%) | ||||
| White: others | 3880 (93):278 (7) | 2255 (93):180 (7) | 1625 (94):98 (6) | .199 |
| Myeloma type, n (%) | ||||
| IgG | 2252 (54) | 1296 (53) | 956 (55.5) | .001 |
| IgA | 919 (22) | 519 (21) | 400 (23.2) | |
| LCO | 491 (12) | 325 (13) | 166 (9.6) | |
| No paraprotein | 32 (0.8) | 20 (0.8) | 12 (0.7) | |
| IgD | 42 (1) | 33 (1.4) | 9 (0.5) | |
| IgM | 8 (0.2) | 6 (0.2) | 2 (0.1) | |
| Missing | 414 (10) | 236 (9.7) | 178 (10.4) | |
| FLC isotype, n (%) | ||||
| κ | 2449 (59) | 1421 (58.4) | 1028 (60) | .177 |
| λ | 1260 (30) | 757 (31) | 503 (29) | |
| Missing | 449 (11) | 257 (10) | 192 (11) | |
| dFLC κ, mg/L | ||||
| Median (IQR) | 320 (44-984) | 292 (40-901) | 370 (72.5-1124) | .008 |
| dFLC λ, mg/L | ||||
| Median (IQR) | 406 (69-1127) | 429 (69-1143) | 380 (63-1098) | .575 |
| Baseline eGFR, mLper min per 1.73 m2 | ||||
| Median (IQR) | 64 (49-81) | 68 (54-85) | 58 (44-75) | <.001 |
| Baseline eGFR, n (%), mL per min per 1.7 3 m2 | ||||
| eGFR >59 | 2271 (55) | 1514 (62) | 757 (44) | <.001 |
| eGFR 30-59 | 1366 (33) | 658 (27) | 708 (41) | |
| eGFR <30 | 256 (6.2) | 122 (5) | 134 (7.7) | |
| Missing | 265 (6.4) | 141 (6) | 124 (7) | |
| Baseline dFLC, n (%), mg/L | ||||
| <500 | 2314 (56) | 1379 (57) | 935 (54) | <.001 |
| 500-1000 | 596 (14) | 356 (15) | 240 (14) | |
| ≥1001 | 995 (24) | 559 (23) | 436 (25) | |
| Missing | 253 (6) | 141 (6) | 112 (6.5) | |
| dFLC response, n (%) | ||||
| <50% | 125 (3) | 34 (1.4) | 91 (5.2) | <.001 |
| 50%-90% | 290 (7) | 86 (3.5) | 204 (12) | |
| >90% | 1239 (30) | 879 (36.1) | 360 (21) | |
| Baseline dFLC <100 | 1160 (28) | 718 (29.4) | 442 (25.6) | |
| Missing | 1344 (32) | 718 (29.4) | 626 (36.3) |
Boldface P values signify statistical significance (P < .05).
Ig, immunoglobulin; LCO, light chain only.
For this analysis, the patients in the intensive and nonintensive pathways were analyzed separately because of the significant differences in baseline renal assessments. Overall RI defined by eGFR <60 mL per minute per 1.73 m2 at presentation was reported in 39%; 32% patients in the intensive arm and 49% patients in the nonintensive pathway (Table1). Eighty-nine (2.4%) patients died with renal failure (myeloma related) as the primary cause of death and 52% of these had an eGFR ≥45 mL per minute per 1.73 m2 at diagnosis. Exact detailing required to clarify whether these patients were offered dialysis or not was not available.
Renal function at recruitment for patients in the intensive pathway, stratified according to eGFR were as follows; 1514 (62%) patients had eGFR >59 mL per minute, 658 (27%) had eGFR of 30 to 59 mL per minute, and 122 (5%) patients had an eGFR <30 mL per minute. In the nonintensive pathway, 757 (44%) patients had eGFR >59 mL per minute, 708 (41%) had eGFR of 30 to 59 mL per minute, and 134 (7.7%) had an eGFR <30 mL per minute (Table 1).
Renal outcome
Baseline and 12-month eGFR results were available for 2334 patients: 1450 in the intensive pathway and 884 in the nonintensive pathway (Table 2).
Baseline characteristics stratified by renal outcome in patients in the intensive and nonintensive pathway of the Myeloma XI trial
| Intensive pathway | Nonintensive pathway | |||||||
|---|---|---|---|---|---|---|---|---|
| Characteristic | Decline in eGFR (≥25%) | No change in eGFR (<25%) | Improvement in eGFR (≥25%) | P | Decline in eGFR (≥25%) | No change in eGFR (<25%) | Improvement in eGFR (≥25%) | P |
| N (%) | 204 (14) | 905 (62) | 341 (23.5) | 178 (20) | 545 (62) | 161 (18) | ||
| Age, y | 66 (70-59) | 65 (70-58) | 66 (70-60) | .184 | 78 (75-82) | 78 (75-82) | 78 (75-82) | .706 |
| Median (IQR) | ||||||||
| Baseline GFR, median (IQR), mL per min per 1.73 m2 | 80 (68-90) | 75 (62-89) | 51 (38-59.5) | <.001 | 72 (58-87) | 62 (48-77) | 45 (33-57) | <.001 |
| 12-mo GFR, median (IQR), mL per min per 1.73 m2 | 51 (43-57) | 73 (60-89) | 76 (60-90) | <.001 | 44 (35-52) | 60 (47-76) | 67 (51-83) | <.001 |
| Baseline dFLC, n (%), mg | <.001 | .07 | ||||||
| <500 | 142 (70) | 575 (64) | 163 (48) | 114 (64) | 332 (61) | 86 (53) | ||
| 500-1000 | 25 (12) | 143 (16) | 51 (15) | 27 (15) | 86 (16) | 20 (12) | ||
| >1000 | 36 (18) | 181 (20) | 124 (37) | 36 (20) | 124 (23) | 55 (34) | ||
| Missing | 1 (0.5) | 6 (0.7) | 3 (0.9) | 1 (0.6) | 3 (0.6) | |||
| Baseline dFLC κ, median (IQR), mg/L (in κ patients) | 241 (26-637) | 264 (37-817) | 426 (83-1531) | <.001 | 240 (33-781) | 374 (80-1027) | 477 (103-1483) | .017 |
| Baseline dFLC λ, median (IQR), mg/L (in λ patients) | 289 (49-694) | 294 (47-801) | 689 (174-2629) | <.001 | 213 (25-782) | 279 (47-755) | 450 (131-2131) | .07 |
| dFLC response, n (%) | .001 | .002 | ||||||
| <50% | 9 (4.4) | 15 (1.6) | 6 (1.8) | 28 (15.6) | 48 (8.7) | 11 (6.8) | ||
| 50%-90% | 9 (4.4) | 58 (6.4) | 17 (5) | 28 (15.7) | 128 (23.5) | 41 (25.5) | ||
| >90% | 109 (53.4) | 516 (57) | 236 (69.2) | 57 (32) | 216 (39.6) | 72 (44.7) | ||
| Baseline dFLC <100 | 75 (37) | 310 (34) | 79 (23) | 63 (35) | 152 (27.8) | 36 (22.3) | ||
| Missing | 2 (1) | 6 (0.66) | 3 (0.9) | 2 (1) | 1 (0.1) | 1 (0.6) | ||
Boldface P values signify statistical significance (P < .05).
In the intensive pathway at 12 months, 204 (14%) patients of the 1450 evaluable patients had a decline in eGFR (≥25%) with a median decline of 26 mL per minute per 1.73 m2 (IQR, 22-32), 341 (23.5%) had an improvement in eGFR (≥25%) with a median rise of 24 mL per minute per 1.73 m2 (IQR, 18-29), and 905 (62%) did not have a significant change (Table 2). Patients who had an improvement in eGFR at 12 months had a significantly lower baseline eGFR (51 mL per minute per 1.73 m2 vs 80 mL per minute per 1.73 m2 in the decline group and 75 mL per minute per 1.73 m2 in the no change group, P < .001). Patients who had improvement in eGFR also had a significantly higher proportion of patients with baseline dFLC of more than 1000 mg/L (37% vs 18% in the decline group and 20% with no change; P < .001), and significantly more patients achieved >90% dFLC response (69.2% vs 53% in the decline group and 57% in the no change group; P = .001) (Table 2). Age was not significantly different in the 3 renal outcome groups in the intensive arm. In the 14% of patients who had a significant decline in their renal function, the majority (70%) had a baseline dFLC <500 mg/L (Table 2) and the decline was not associated with higher FLC levels or a lack of FLC response (Table 2).
In the nonintensive pathway, the changes in renal function identified at 12 months were similar to those in the intensive pathway (Table 2). A total of 178 (20%) of 884 evaluable patients had a decline in their eGFR, with a median decline of 26 mL per minute per 1.73 m2 (IQR, 19-33), 161 (18%) had an improvement in their eGFR with a median rise in this group of 19 mL per minute per 1.73 m2 (IQR, 15-25), and in 545 (62%), patients’ renal function was maintained. The factors associated with renal outcome in the nonintensively treated patients were also similar to those in the intensive pathway. Patients who had an improvement in their eGFR at 12 months had a lower starting eGFR (45 mL per minute per 1.73 m2 compared with 72 mL per minute per 1.73 m2 in the decline group, and 62 mL per minute per 1.73 m2 in the no change group, P < .001), a higher proportion of patients with baseline dFLC of more than 1000 mg/L (34% vs 20% in the decline group and 23% in the no change group, P = .07), and had a higher proportion of patients achieving >90% dFLC response (44.7% in the improvement group compared with 32% in the decline group and 39.6% in the no change group, P = .002) (Table 2). In the 20% of patients who had a significant decline in their renal function, the majority (64%) had a baseline dFLC <500 mg/L (Table 2).
Multivariate analysis
In a multivariate analyses using a logistic regression model (Table 3) patients were more likely to have had an improvement in renal function if they were; <70 years of age (odds ratio [OR], 1.58; 95% confidence interval [CI], 1.23-2.04; P < .001), male (OR, 1.62; 95% CI, 1.26-2.09; P < .001), had an average eGFR <60 mL per minute (OR, 2.23; 95% CI, 1.73-2.87; P < .001) compared with eGFR ≥60 mL per minute, baseline dFLC >1000 mg/L (OR, 1.69; 95% CI, 1.28-2.22; P < .001) compared with baseline dFLC <500 mg/L and dFLC response >90% (OR, 1.92; 95% CI, 1.11-3.34; P = .02) compared with dFLC response <50%. Factors associated with a decline in eGFR at 12 months were dFLC response <50% (OR, 2.54, 95% CI, 1.64-3.94; P < .001) and female sex (OR, 1.42; 95% CI, 1.08-1.88; P = .01).
Univariate and multivariate analysis of factors associated with improvement and decline in renal function at 12 mo
| Variables | Univariate analysis | Multivariable analysis | ||||
|---|---|---|---|---|---|---|
| OR (95% CI) | P | OR (95% CI) | P | |||
| Improvement | ||||||
| Age, y | .007 | <.001 | ||||
| <70 | 1.31 (1.07-1.60) | 1.58 (1.23-2.04) | ||||
| ≥70 | Reference | Reference | ||||
| Sex | .009 | <.001 | ||||
| Male | 1.37 (1.08-1.75) | 1.62 (1.26-2.09) | ||||
| Female | Reference | Reference | ||||
| Baseline dFLC, mg/L | ||||||
| >1000 | 1.98 (1.53-2.57) | <.001 | 1.69 (1.28-2.22) | <.001 | ||
| 500-1000 | 1.06 (0.77-1.46) | <.001 | 0.98 (0.70-1.36) | <.001 | ||
| <500 | Reference | .70 | Reference | .91 | ||
| Average eGFR, mL/min | ||||||
| <30 | 2.90 (1.82-4.64) | <.001 | 3.35 (1.96-5.73) | <.001 | ||
| 30-59 | 1.69 (1.37-2.08) | <.001 | 2.23 (1.73-2.87) | <.001 | ||
| ≥60 | Reference | <.001 | Reference | <.001 | ||
| dFLC response, % | ||||||
| >90 | 2.01 (1.18-3.42) | .012 | 1.92 (1.11-3.34) | .04 | ||
| 50-90 | 1.53 (0.84-2.75) | .010 | 1.55 (0.84-2.84) | .02 | ||
| <50 | Reference | .15 | Reference | .15 | ||
| Decline | ||||||
| Age, y | .001 | .05 | ||||
| <70 | 0.70 (0.54-0.84) | 0.74 (0.55-1.00) | ||||
| ≥70 | Reference | Reference | ||||
| Sex | .002 | .01 | ||||
| Female | 1.41 (1.12-1.75) | 1.42 (1.08-1.88) | ||||
| Male | Reference | Reference | ||||
| Baseline dFLC, mg/L | .14 | |||||
| <500 | 1.37 (0.99-1.88) | .05 | 1.33 (0.95-1.86) | .22 | ||
| 500-1000 | 1.18 (0.80-1.73) | .39 | 1.23 (0.82-1.83) | .08 | ||
| >1000 | Reference | Reference | .30 | |||
| Average eGFR, mL/min | ||||||
| <30 | 1.17 (0.65-2.13) | .15 | 1.12 (0.55-2.26) | .78 | ||
| 30-59 | 1.25 (0.99-1.58) | .59 | 1.10 (0.82-1.49) | .74 | ||
| ≥60 | Reference | .05 | Reference | .50 | ||
| dFLC response, % | ||||||
| >90 | 0.34 (0.22-0.52) | <.001 | 0.39 (0.20-0.60) | <.001 | ||
| 50-90 | 0.32 (0.19-0.55) | <.001 | 0.34 (0.20-0.57) | <.001 | ||
| <50 | Reference | <.001 | Reference | <.001 | ||
All ORs have been quoted relative to the reference categories. Boldface P values signify statistical significance (P < .05).
In a univariate analysis, we found that patients who underwent stem cell transplantation, were less likely to have a decline in kidney function at 12 months (OR, 0.637; 95% CI, 0.50-0.81; P < .001) compared with those who did not. However, this was not of significance in a multivariate analysis.
Survival analysis
The median follow-up for the series as a whole cohort was 30.5 months (95% CI, 29.38-31.658). The median overall survival for the series as a whole was 60 months (95% CI, 57-63); 407 (10%) died in the first 12 months. Median survival was longer in patients recruited to the intensive arm compared with the nonintensive arm, 64 months (95% CI, 61-67) vs 44 months (95% CI, 41-48), P < .01, respectively. The median survival by baseline eGFR was 64 months (95% CI, 61-67) for baseline eGFR >59 mL per minute; 64 months (95% CI, 59-69) for eGFR 30 to 59 mL per minute; 44 months (95% CI, 34-53) for eGFR <30 mL per minute, P < .001 (Figure 2). The median survival in patients stratified by eGFR level at 12 months was significantly better in those with eGFR ≥30 mL per minute compared with patients with eGFR <30 mL per minute; 64 months (95% CI, 57-72) vs 55 months (95% CI, 43-67), P < .001 (Figure 3).

Kaplan-Meier plot comparing overall survival between patients with different eGFR levels at baseline. Overall survival was significantly longer among those with baseline eGFR ≥30 mL per minute compared with those with eGFR <30 mL per minute (P < .001).
Kaplan-Meier plot comparing overall survival between patients with different eGFR levels at baseline. Overall survival was significantly longer among those with baseline eGFR ≥30 mL per minute compared with those with eGFR <30 mL per minute (P < .001).

Kaplan-Meier plot comparing overall survival between patients with different eGFR levels at 12 months. Overall survival was significantly longer among those with 12-month eGFR ≥30 mL per minute compared with those with eGFR <30 mL per minute (P < .001).
Kaplan-Meier plot comparing overall survival between patients with different eGFR levels at 12 months. Overall survival was significantly longer among those with 12-month eGFR ≥30 mL per minute compared with those with eGFR <30 mL per minute (P < .001).
Missing data
A full dataset was not available for 1824 patients, and 411 patients died within the first 15 months and hence were not evaluable for renal outcome analysis. Of the 1413 remaining patients without a 12-month or baseline eGFR, 1005 (71%) patients had a follow-up eGFR recorded outside the window of 9 to 15 months and were therefore not included in the 12-month follow-up dataset.
In the intensive pathway, 985 patients did not have a baseline or 12-month eGFR results and were excluded from analysis (Figure 1). There were 242 (24.5%) deaths in this group. A total of 236 (24%) of 985 patients in the intensive pathway had an available eGFR at more than 15 months; in this group, there were 37 (17%) deaths; 199 were censored. Of the 236 patients, 203 had both a baseline and an eGFR result at >15 months compared with baseline, 60% had no change in renal function, 19% had a decline, and 22% had an improvement. In the 749 patients who did not have a >15-month available eGFR, there were 205 (27%) deaths; 544 were censored.
In the nonintensive pathway, 839 patients did not have a baseline or 12-month eGFR (Figure 1). There were 401 (48%) deaths in this group. A total of 155 of 839 patients had an available eGFR at more than 15 months; in this group, there were 42 (27%) deaths and 113 were censored. Of the 155 patients, 110 had a baseline and an available eGFR at >15 months; compared with baseline, 60% had no change in renal function, 20% had a decline, and 20% had an improvement. In the 684 patients who did not have >15-month eGFR, there were 359 (52%) deaths; 325 were censored.
Hematological response and renal outcome
There was no difference in the proportion of patients achieving complete response vs partial response vs no change in the 3 renal response groups (supplemental Table 1). Of the 1450 evaluable patients in the intensive pathway, 890 (61%) underwent autologous stem cell transplant (ASCT). The proportion of patients who had a renal decline vs no change vs renal improvement was no different in patients who underwent ASCT compared with no ASCT in those treated in the intensive pathway (supplemental Table 2).
Value of proteasome inhibitor bortezomib
Patients with a suboptimal response to standard induction treatment (CTD(a)/CRD(a)) were randomized to CVD vs nothing.
Of the 2334 evaluable patients, 367 were randomized to CVD, 226 from the intensive pathway and 141 from the nonintensive pathway. The response post-CVD and renal outcome in 121 patients in the intensive pathway and in 65 from the nonintensive pathway was similar and not statistically significant (supplemental Table 3).
Discussion
Overall, we show that the renal prognosis at 12-months for patients presenting with MM is good, with a relatively small proportion having a significant decline. Change in renal function at 12 months does not appear to affect patient survival; patients who recover renal function are more likely to be <70 years of age, male, have a lower mean GFR, higher baseline dFLC levels, and >90% clonal response, suggesting that this group are more likely to have myeloma cast nephropathy.
This large study, which included patients with all levels of renal function down to an eGFR of 15 mL per minute, showed that renal impairment (eGFR <60 mL per minute per 1.73 m2) is common in NDMM affecting around one-half of all patients.16 We show that 62% (1450/2334) of NDMM patients had unchanged renal function at 12 months; 38% had significant change from baseline, with 22% (502/2334) of patients had an improvement and 16% (382/2334) had a decline.
The variables associated with improvement in renal function at 12 months were younger patients (age <70 years), male sex, higher baseline free light chain levels (>1000 mg/L), lower average glomerular filtration rate (<60 mL per minute per 1.73 m2), and >90% clonal response. There was no correlation with M-protein response, transplantation, or use of a bortezomib-based regimen.
The analysis took account of patients in the 2 treatment pathways separately because there were significant differences in the approach to treatment and difference in overall patient survival. When comparing the 3 renal outcome groups, no advantage in overall survival was found for patients with improvement in renal function. The current findings enhance the results of a study that looked at the effect of RI on outcomes after ASCT in MM, which reported no difference in overall and progression-free survival in the 3 groups.17 In this study, patients were categorized into 3 groups: no RI at diagnosis and ASCT, RI at diagnosis with normalization before ASCT, and RI both at time of diagnosis and ASCT.
Analysis of renal outcome at 12 months from the start of treatment showed that for the majority of patients (62%) renal function did not change. Patients presenting with light chains >500 mg/L are more likely to develop cast nephropathy.18,19 This occurs because of a heavy load of filtered free light chains that escape tubular reabsorption and coprecipitate with Tamm–Horsfall protein in the distal nephron causing intratubular obstruction, but rapid treatment can result in improvement in renal function.20 In our study, patients who had an improvement in renal function at 12 months started with higher baseline dFLC and had lower mean eGFR, suggesting that these patients were more likely to have reversible myeloma cast nephropathy. In addition, there was an independent relationship between improvement in kidney function and the strength of disease remission as measured by dFLC response.
Decline in eGFR at 12 months was seen in relatively few patients (16% overall). Lack of timely clonal response is known to result in accelerated renal fibrosis.21 Our study showed that lack of dFLC response was independently associated with worse renal outcome. Being female was the other factor; however, gender differences are not explained because the clonal responses were not different between men and women. The Myeloma IX study reported on sex-dependent differences in the prevalence of the primary genetic events of myeloma, and secondary genetic events were more frequent in women. Female sex was also associated with inferior overall survival. The study concluded that higher prevalence of lesions associated with poor prognosis in the female myeloma population may adversely affect clinical outcome.22
There are several potential limitations of this study, which may affect conclusions about the proportion of patients affected by CKD. The current criteria for renal response have been defined by the International Myeloma Working Group (IMWG).23-27 Using the IMWG criteria, a complete renal response is defined as a sustained (ie, ≥2 months) improvement of baseline eGFR from <50 mL per minute to ≥60 mL per minute, renal partial response as sustained improvement of baseline eGFR from <15 mL per minute to 30 to 59 mL per minute, renal minor response as an improvement from <15 mL per minute to 15 to 29 mL/min or if baseline eGFR was 15 to 29 mL per minute and improved to 30 to 59 mL per minute.23 By IMWG criteria, only 5% in the intensive and 4.5% in the nonintensive pathway met the criteria for a complete response renal. Because patients with severe RI and patients on dialysis were excluded from the trial, we could not make conclusions regarding the proportion of patients with partial response renal and minor response renal. Therefore, we chose a ≥25% change in eGFR as the definition for change in renal function.12 The definition of a renal response may change with time as the relationship between renal function and long-term outcomes are better defined, and this study may contribute to this.
A shortfall is that current diagnostic guidelines for MM do not include the presence of proteinuria, which was not available for this study. Proteinuria data may help to differentiate between AKI resulting from cast nephropathy and CKD and would be valuable to correlate with outcomes and renal responses in future studies.
The strengths of this study comprised broad inclusion criteria ensuring that the data are useful for the interpretation of the natural history of myeloma patients on a population basis, biochemical data derived from a single central laboratory ensuring the accuracy and reproducibility of the results generated, and detailed sFLC data.
The majority of NDMM patients present with mild to moderate RI. The aim of this study was to investigate renal outcomes at 12 months from myeloma presentation. We show that renal prognosis in patients who present with MM and an eGFR >15 mL per minute is good. In patients with an eGFR of ≥30 mL per minute, renal function is not an independent determinant of 12-month outcome. Improvement in renal function is more likely in patients who present with very high light chains, suggesting reversibility of kidney disease in those patients with cast nephropathy. Depth of light chain response is independently associated with both renal response and renal progression. Further work is now required to assess the effect of RI on longer term outcomes and to reassess renal response criteria in patients with MM.
For original data, please contact graham.jackson@newcastle.ac.uk. Deidentified participant data will be made available on request. Any requests for trial data and supporting material (data dictionary, protocol, and statistical analysis plan) will be reviewed by the trial management group in the first instance. Only requests that have a methodologically sound proposal and whose proposed use of the data have been approved by the independent trial steering committee will be considered. Proposals should be directed to Graham Jackson at graham.jackson@newcastle.ac.uk; to gain access, data requestors will need to sign a data access agreement.
Acknowledgments
The authors are grateful to Robert Waller for his technical help with merging of databases. The support of the Clinical Trials Research Unit at The University of Leeds was essential to the successful running of the Myeloma XI study, and the authors thank all their staff who have contributed, past and present. The authors are also grateful to Peter Nightingale for his statistical expertise. They are grateful to all patients and their clinical teams at centers throughout the United Kingdom whose participation made this study possible.
Myeloma XI was funded by Cancer Research UK (C1298/A10410).
Authorship
Contribution: R.R., J.H.P., M.D., and P.C. conceived and designed the study; R.R., J.H.P., M.D., P.C., D.A.C., and C.P. collected and assembled the data; R.R., J.H.P., P.C., and M.D. analyzed and interpreted the data; R.R., J.H.P., P.C., and M.D. wrote the manuscript; G.M., M.D., F.D., and G.H.J designed the Myeloma XI trial; and all authors commented on or approved the manuscript.
Conflict-of-interest disclosure: M.D. owns shares in Abingdon Health, which manufactures immunodiagnostic tests to quantify free light chain levels. P.C. is a medical advisor to the Binding site, which produces the Freelite assay. The remaining authors declare no competing financial interests.
Correspondence: Ritika Rana, Department of Renal Medicine, Queen Elizabeth Hospital, University Hospitals Birmingham NHS Foundation Trust, Birmingham B15 2TH, United Kingdom; e-mail: ritika.rana@uhb.nhs.uk.

