

Key Points
Genetic factors, namely cytogenetic alternations and TP53 mutation status, predict outcomes of HCT in MPN-BP.
No meaningful benefit of HCT was observed in patients with mutated TP53 status.

Abstract
There is a limited understanding of the clinical and molecular factors associated with outcomes of hematopoietic cell transplantation (HCT) in patients with BCR-ABL–negative myeloproliferative neoplasms in blast phase (MPN-BP). Using the Center for International Blood and Marrow Transplant Research database, we evaluated HCT outcomes in 177 patients with MPN-BP. Ninety-five (54%) had sufficient DNA for targeted next-generation sequencing of 49 genes clinically relevant in hematologic malignancies. At 5 years, overall survival (OS), cumulative incidence of relapse, and nonrelapse mortality of the study cohort was 18%, 61%, and 25%, respectively. In a multivariable model, poor-risk cytogenetics was associated with inferior OS (hazard ratio [HR], 1.71; 95% CI, 1.21-2.41) due to increased relapse (HR, 1.93; 95% CI, 1.32-2.82). Transplants using mobilized peripheral blood (PB) were associated with better OS (HR, 0.60; 95% CI, 0.38-0.96). No difference in outcomes was observed in patients undergoing HCT with PB/BM blasts <5% vs those with active leukemia. Among the 95 patients with molecular data, mutation of TP53, present in 23%, was the only genetic alteration associated with outcomes. In a multivariate model, TP53-mutant patients had inferior OS (HR, 1.99; 95% CI, 1.14-3.49) and increased incidence of relapse (HR, 2.59; 95% CI, 1.41-4.74). There were no differences in the spectrum of gene mutations, number of mutations, or variant allele frequency between patients undergoing HCT with PB/BM blasts <5% vs those with active leukemia. Genetic factors, namely cytogenetic alterations and TP53 mutation status, rather than degree of cytoreduction predict outcomes of HCT in MPN-BP. No meaningful benefit of conventional HCT was observed in patients with MPN-BP and mutated TP53.
Introduction
The Philadelphia-negative myeloproliferative neoplasms (MPNs), including essential thrombocythemia (ET), polycythemia vera (PV), and primary myelofibrosis, are a group of phenotypically related clonal hematopoietic cell diseases characterized by overproduction of mature myeloid cells and variable rates of progression, depending on the MPN subtype. Transformation to acute myeloid leukemia (AML), defined as ≥20% myeloblasts in peripheral blood (PB) or bone marrow (BM), occurs in ∼5% to 20% of patients with MPN. This progression is also referred to as the “blast phase,” as proposed by the International Working Group for Myelofibrosis Research and Treatment.1 Patients with MPN with blasts <10%, 10% to 19%, and ≥20% are termed chronic, accelerated, and blast phase, respectively. Several single-center and multicenter retrospective studies have reported poor survival in MPN in blast phase (MPN-BP) in the range of 3 to 6 months, even with intensive chemotherapy.2-6 A long-term benefit of intensive chemotherapy is only observed in select patients able to undergo allogeneic hematopoietic cell transplantation (HCT).2,3,5
There is limited understanding of the clinical and molecular factors associated with outcomes of HCT in MPN-BP. Published data on HCT outcomes are limited to small descriptive studies with short follow-up.7-10 Careful review of cohorts reported in these studies reveals center-dependent biases in candidate selection for HCT in patients with MPN-BP. Some centers offer HCT to patients who achieve a response to therapy such as complete remission or complete remission with incomplete count recovery or return to a second chronic phase,2 whereas others have offered transplantation to patients with active leukemia.11,12 From these studies, it is unclear which patients with MPN-BP are likely to benefit from HCT. Moreover, genetic data are available for only a small proportion of patients in these studies.
Cytogenetic abnormalities and somatic mutations are common in chronic phase MPNs and occur at much higher frequency in patients with MPN-BP.3,13,14 Mutations in genes including ASXL1/EZH2/SRSF2/IDH1/IDH2/TP53 have been implicated in the transformation of chronic phase MPNs to blast phase.15-20 Variant allele frequency (VAF) of mutations such as TP53 is much higher in MPN-BP than in chronic phase.17,18,21 Cytogenetics and mutations in certain genes are predictive of HCT outcomes in myelofibrosis,22-24 although their impact on outcomes of HCT in MPN-BP is unknown.
We therefore sought to determine the outcomes of patients with MPN-BP reported to the Center for International Blood and Marrow Transplant Research (CIBMTR). In a subgroup of patients with DNA available for targeted next-generation sequencing, we assessed the efficacy of HCT in molecularly defined subgroups of MPN-BP.
Patients and methods
Data source
The CIBMTR is a research program of the Medical College of Wisconsin and the National Marrow Donor Program, forming a voluntary network of >500 transplantation centers worldwide that contribute detailed data on allogeneic and autologous HCTs to a centralized statistical center. Observational studies conducted by the CIBMTR are performed in compliance with all applicable federal regulations pertaining to the protection of human research participants. Protected health information used in such studies is collected and maintained in CIBMTR’s capacity as a public health authority under the regulations of the Health Insurance Portability and Accountability Act of 1996.
Study cohort
The study cohort included patients aged ≥40 years who underwent first HCT between 2001 and 2015 for MPN-BP. MPN diagnoses were ET, PV, primary myelofibrosis, post-ET myelofibrosis, post-PV myelofibrosis, or MPN-unclassifiable. BP was defined as ≥20% myeloblasts in PB and/or BM. Due to concerns related to significant differences in disease biology, patients aged <40 years (n = 12) were excluded. In addition, patients with Philadelphia chromosome– or BCR-ABL–positive MPN, autologous transplants, transplants from syngeneic donors, cord blood transplants, or those receiving ex vivo T cell–depleted donor cells were excluded. Unrelated donor transplant recipients and the intensity of conditioning regimens were defined as previously described.25,26 Results of cytogenetic testing were classified as “favorable,” “intermediate,” “poor-risk,” or “missing.”27 Disease status at HCT was defined as follows: patients who had PB and BM blasts <5% before HCT were grouped as “PB/BM blasts <5%”; and those with PB and/or BM blasts ≥5% were considered as having “active leukemia.”
Targeted sequencing
Genomic DNA was sheared and library capture by hybridization was performed by using a pool of custom probes targeting hotspot sequences or exonic coding regions and flanking intronic sequences of 49 genes considered clinically relevant in hematologic malignancies (supplemental Table 1). Libraries were visualized (TapeStation, Agilent Technologies), and sequencing was performed by using the Illumina Next-Generation Sequencing platform (paired-end sequencing, MiSeq version 2). Bioinformatics analyses included alignment to the human genome reference build GRCh37/hg19 using the Burns-Wheeler Alignment, processing and quality metrics using the Genome Analysis Toolkit and Picard, and variant calling using VarScan2. Variants not meeting laboratory-defined quality metrics (read depth <100, population frequency >1% in the gnomAD database, or VAF <2%) were removed from further analysis. Variant filtering was performed by using the Alissa Clinical Informatics Platform (Agilent Technologies). Variants lying outside of coding sequences or canonical splice sites were filtered out, along with synonymous alterations. The remaining variants were classified as oncogenic or variants of uncertain significance, as previously described.3,28 Annotation was based on established criteria29 together with evidence gathered from published literature (eg, PubMed: ncbi.nlm.nih.gov/pubmed/), as well as cancer-wide (eg, COSMIC: cancer.sanger.ac.uk/cosmic) and gene-specific (eg, TP53 IARC: http://p53.iarc.fr/) repositories. Oncogenic variants included the following: (1) variants affecting hotspot codons (eg, V617F in exon 14 of JAK2); (2) variants occurring at critical gene regions or protein functional domains in which other deleterious variants have been reported in myeloid neoplasms (eg, DNA-binding domain of TP53); and (3) variants predicted to disrupt the normal activity of the encoded protein (eg, truncating variants in exon 13 of ASXL1). Variants not meeting any of the aforementioned criteria were classified as variants of uncertain significance and were not included in downstream analyses. The complete list of variants is reported in supplemental Table 2. Landscape plots were prepared by using the GenVisR R package.30
End points and statistical analysis
The primary end point of the study was overall survival (OS), defined as time from HCT to death from any cause. Patients were censored at last follow-up. Other end points of interest were relapse, nonrelapse mortality (NRM), and progression-free survival (PFS). Relapse was as reported by the transplantation center, with NRM considered a competing event. NRM was defined as death from any cause without evidence of disease relapse, and relapse was considered a competing event. PFS was defined as time from HCT to progression/relapse or death. Descriptive statistics tables of patient-, disease-, and transplant-related factors were prepared. The univariate probability of OS and PFS was calculated by using the Kaplan-Meier estimator, with the variance estimated according to the Greenwood formula and P values from the log-rank test. Univariate probabilities of NRM and relapse were calculated based on cumulative incidence rates to accommodate competing risks. The Gray’s test was used to evaluate differences across cumulative incidence functions. Multivariable regression analysis was performed by using the Cox proportional hazards model and the patient-, disease-, and transplant-related variables outlined in the Appendix. A forward stepwise selection procedure was used to identify significant covariates. For patients with targeted sequencing, each gene that was mutated in ≥10 patients (oncogenic mutation present vs absent) was assessed in separate multivariate analyses, alongside the aforementioned clinical variables.
Results
Patient, disease, and transplantation characteristics
A total of 177 patients with MPN-BP met the study eligibility criteria. Of these 177 patients, 97 had PB samples in the CIBMTR sample repository, and sufficient DNA was isolated in 95 individuals (98%). Molecular profiling of these 95 patients was performed by using a targeted next-generation sequencing panel of 49 genes clinically relevant in hematologic malignancies (supplemental Table 1). Detailed patient-, disease-, and transplantation-related characteristics of the study cohorts are displayed in Table 1. Poor-risk cytogenetics was observed in 38% of patients in the whole study cohort and 41% of the patients with molecular samples; 43% of patients in both cohorts had active leukemia at the time of HCT. A higher proportion of patients with molecular data underwent HCT using unrelated donors. The median follow-up of survivors was 71 months (range, 14-169 months).
Clinical and molecular characteristics of the MPN-BP study cohort
| Characteristic | Sample DNA obtained | No sample/DNA not obtained | Total |
|---|---|---|---|
| No. of patients | 95 | 82 | 177 |
| No. of centers | 43 | 51 | 73 |
| Patient related | |||
| Age at HCT | |||
| Median (minimum-maximum), y | 59.9 (41.05-81.55) | 58.48 (40.29-74.04) | 58.75 (40.29-81.55) |
| Age group, no. (%) | |||
| 40-49 y | 16 (16.8) | 14 (17.1) | 30 (16.9) |
| 50-59 y | 33 (34.7) | 40 (48.8) | 73 (41.2) |
| 60-69 y | 36 (37.9) | 23 (28) | 59 (33.3) |
| a≥70 y | 10 (10.5) | 5 (6.1) | 15 (8.5) |
| Sex, no. (%) | |||
| Male | 64 (67.4) | 52 (63.4) | 116 (65.5) |
| Female | 31 (32.6) | 30 (36.6) | 61 (34.5) |
| Karnofsky performance score, no. (%) | |||
| 90-100 | 46 (48.4) | 42 (51.2) | 88 (49.7) |
| <90 | 47 (49.5) | 37 (45.1) | 84 (47.5) |
| Missing | 2 (2.1) | 3 (3.7) | 5 (2.8) |
| HCT-CI, no. (%) | |||
| 0 | 16 (16.8) | 17 (20.7) | 33 (18.6) |
| 1-2 | 19 (20) | 12 (14.6) | 31 (17.5) |
| ≥3 | 31 (32.6) | 19 (23.2) | 50 (28.2) |
| NA, before 2007 | 28 (29.5) | 33 (40.2) | 61 (34.5) |
| Missing | 1 (1.1) | 1 (1.2) | 2 (1.1) |
| Disease related | |||
| Type of MPN at original diagnosis, no. (%) | |||
| PV | 26 (27.4) | 20 (24.4) | 46 (26) |
| ET | 25 (26.3) | 26 (31.7) | 51 (28.8) |
| Primary myelofibrosis | 32 (33.7) | 28 (34.1) | 60 (33.9) |
| MPN-unclassifiable | 12 (12.6) | 8 (9.8) | 20 (11.3) |
| Time between diagnosis of MPN to transformation to BP | |||
| Median (minimum-maximum) | 4.02 (0-27.3) | 2.55 (0-30.14) | 3.12 (0-30.14) |
| Age groups, no. (%) | |||
| <2 y | 36 (37.9) | 34 (41.5) | 70 (39.5) |
| 2-5 y | 16 (16.8) | 12 (14.6) | 28 (15.8) |
| >5 y | 36 (37.9) | 27 (32.9) | 63 (35.6) |
| Missing | 7 (7.4) | 9 (11) | 16 (9) |
| WBC at diagnosis of MPN-BP, no. (%) | |||
| ≤30 × 109/L | 64 (67.4) | 57 (69.5) | 121 (68.4) |
| 30-100 × 109/L | 18 (18.9) | 13 (15.9) | 31 (17.5) |
| >100 × 109/L | 5 (5.3) | 4 (4.9) | 9 (5.1) |
| Missing | 8 (8.4) | 8 (9.8) | 16 (9) |
| Cytogenetics, no. (%) | |||
| Favorable | 1 (1.1) | 0 | 1 (0.6) |
| Intermediate | 50 (52.6) | 46 (56.1) | 96 (54.2) |
| Poor-risk | 39 (41.1) | 28 (34.1) | 67 (37.9) |
| Not tested | 2 (2.1) | 3 (3.7) | 5 (2.8) |
| Missing | 3 (3.2) | 5 (6.1) | 8 (4.5) |
| Blast percentage in BM before HCT | |||
| Median (minimum-maximum) | 2 (0-50) | 2 (0-60) | 2 (0-60) |
| Blast % in PB before HCT | |||
| Median (minimum-maximum) | 0 (0-56) | 0 (0-96) | 0 (0-96) |
| Disease status at HCT, no. (%) | |||
| PB/BM blasts <5% | 54 (56.8) | 47 (57.3) | 101 (57.1) |
| Active leukemia* | 41 (43.2) | 35 (42.7) | 76 (42.9) |
| No. of mutations, no. (%) | |||
| 0 | 4 (4.2) | — | |
| 1 | 20 (21.1) | — | |
| 2 | 22 (23.2) | — | |
| 3 | 19 (20) | — | |
| 4 | 15 (15.8) | — | |
| 5 | 7 (7.4) | — | |
| 6 | 5 (5.3) | — | |
| 7 | 1 (1.1) | — | |
| 8 | 2 (2.1) | — | |
| Mutations, no. (%) | |||
| ASXL1 | 21 (22.1) | — | |
| BCOR | 2 (2.1) | — | |
| CALR | 12 (12.6) | — | |
| CBL | 6 (6.3) | — | |
| CEBPA | 1 (1.1) | — | |
| CUX1 | 5 (5.3) | — | |
| DNMT3A | 13 (13.7) | — | |
| EZH2 | 3 (3.2) | — | |
| GATA2 | 2 (2.1) | — | |
| GNAS | 2 (2.1) | — | |
| IDH1 | 2 (2.1) | — | |
| IDH2 | 6 (6.3) | — | |
| JAK2 | 52 (54.7) | — | |
| KRAS | 1 (1.1) | — | |
| MPL | 1 (1.1) | — | |
| NRAS | 4 (4.2) | — | |
| PHF6 | 8 (8.4) | — | |
| PPM1D | 3 (3.2) | — | |
| RAD21 | 1 (1.1) | — | |
| RUNX1 | 13 (13.7) | — | |
| SETBP1 | 4 (4.2) | — | |
| SF3B1 | 10 (10.5) | — | |
| SH2B3 | 4 (4.2) | — | |
| SRSF2 | 15 (15.8) | — | |
| STAG2 | 2 (2.1) | — | |
| TET2 | 18 (18.9) | — | |
| TP53 | 22 (23.2) | — | |
| U2AF1 | 6 (6.3) | — | |
| ZRSR2 | 1 (1.1) | — | |
| Therapy related | |||
| Induction therapy, no. (%) | |||
| 7 + 3 ± other | 49 (51.6) | 51 (62.2) | 100 (56.5) |
| Cytarabine based | 9 (9.5) | 9 (11) | 18 (10.2) |
| Hypomethylating | 6 (6.3) | 1 (1.2) | 7 (4) |
| Other | 2 (2.1) | 1 (1.2) | 3 (1.7) |
| No therapy given | 1 (1.1) | 10 (12.2) | 11 (6.2) |
| Missing | 28 (29.5) | 10 (12.2) | 38 (21.5) |
| Transplant related | |||
| Time from diagnosis of BP to HCT | |||
| Median, mo | 5.23 | 5.28 | 5.26 |
| Time frame, no. (%) | |||
| <6 mo | 55 (57.9) | 50 (61) | 105 (59.3) |
| 6-12 mo | 17 (17.9) | 21 (25.6) | 38 (21.5) |
| ≥12 mo | 23 (24.2) | 11 (13.4) | 34 (19.2) |
| Graft source, no. (%) | |||
| BM | 14 (14.7) | 8 (9.8) | 22 (12.4) |
| PB | 81 (85.3) | 74 (90.2) | 155 (87.6) |
| Donor type, no. (%) | |||
| HLA-identical sibling | 7 (7.4) | 47 (57.3) | 54 (30.5) |
| Other related | 3 (3.2) | 10 (12.2) | 13 (7.3) |
| Well-matched URD | 66 (69.5) | 17 (20.7) | 83 (46.9) |
| Partially matched/mismatched URD | 19 (20) | 8 (9.8) | 27 (15.3) |
| D–R sex match, no. (%) | |||
| M-M | 47 (49.5) | 29 (35.4) | 76 (42.9) |
| M-F | 19 (20) | 17 (20.7) | 36 (20.3) |
| F-M | 16 (16.8) | 23 (28) | 39 (22) |
| F-F | 12 (12.6) | 13 (15.9) | 25 (14.1) |
| Missing | 1 (1.1) | 0 | 1 (0.6) |
| D-R CMV status, no. (%) | |||
| +/+ | 18 (18.9) | 31 (37.8) | 49 (27.7) |
| +/− | 9 (9.5) | 4 (4.9) | 13 (7.3) |
| −/+ | 37 (38.9) | 21 (25.6) | 58 (32.8) |
| −/− | 29 (30.5) | 24 (29.3) | 53 (29.9) |
| Missing | 2 (2.1) | 2 (2.4) | 4 (2.3) |
| Conditioning regimen, no. (%) | |||
| MAC, TBI-based | 8 (8.4) | 13 (15.9) | 21 (11.9) |
| MAC, chemotherapy-based | 46 (48.4) | 26 (31.7) | 72 (40.7) |
| RIC/NST | 41 (43.2) | 43 (52.4) | 84 (47.5) |
| GVHD prophylaxis, no. (%) | |||
| CNI + MMF ± others | 26 (27.4) | 21 (25.6) | 47 (26.6) |
| CNI + MTX ± others | 57 (60) | 42 (51.2) | 99 (55.9) |
| CNI ± others | 8 (8.4) | 11 (13.4) | 19 (10.7) |
| Post-CY | 3 (3.2) | 7 (8.5) | 10 (5.6) |
| Other | 1 (1.1) | 0 | 1 (0.6) |
| Missing | 0 | 1 (1.2) | 1 (0.6) |
| In vivo T-cell depletion, no. (%) | |||
| No | 69 (72.6) | 62 (75.6) | 131 (74) |
| Yes | 26 (27.4) | 20 (24.4) | 46 (26) |
| Planned G-CSF/GM-CSF within 7 d post-HCT, no. (%) | |||
| No | 72 (75.8) | 57 (69.5) | 129 (72.9) |
| Yes | 21 (22.1) | 25 (30.5) | 46 (26) |
| Missing | 2 (2.1) | 0 | 2 (1.1) |
| Year of transplant, no. (%) | |||
| 2001-2005 | 13 (13.7) | 26 (31.7) | 39 (22) |
| 2006-2010 | 42 (44.2) | 30 (36.6) | 72 (40.7) |
| 2011-2015 | 40 (42.1) | 26 (31.7) | 66 (37.3) |
| Follow-up of survivors, median (minimum-maximum), mo | 70.63 (13.55-143.16) | 68.82 (22.2-169.38) | 70.63 (13.55-169.38) |
CMV, cytomegalovirus; CNI, calcineurin inhibitor; D–R, donor–recipient; G-CSF, granulocyte colony stimulating factor; GM-CSF, granulocyte-macrophage colony stimulating factor; GVHD, graft-versus-host disease; HCT-CI, HCT comorbidity index; HLA, human leukocyte antigen; D-R, donor-recipient; F, female; M, male; MAC, myeloablative conditioning; MMF, mycophenolate mofetil; MTX, methotrexate; post-CY, posttransplant cyclophosphamide; RIC/NST, reduced-intensity/non-myeloablative conditioning; TBI, total body irradiation; URD, unrelated donor; WBC, white blood cell.
Active leukemia, blasts in PB and/or BM ≥5%.
Mutational data are summarized in Table 1 and Figure 1. Of the 95 patients with available molecular samples, 91 (96%) had mutations in one or more genes: 1 mutation, 20 patients (21%); 2 to 3 mutations, 41 patients (43%); and ≥4 mutations, 30 patients (32%). The most frequently mutated genes in the study cohort were: JAK2 (55%), TP53 (23%), ASXL1 (22%), TET2 (19%), SRSF2 (16%), DNMT3A (14%), RUNX1 (14%), CALR (13%), and SF3B1 (11%). Mutations in the TP53 gene were second most common after JAK2 mutations. This mutational distribution is distinct from de novo AML and comparable to what has been observed in previous studies of MPN-BP.3,14,18
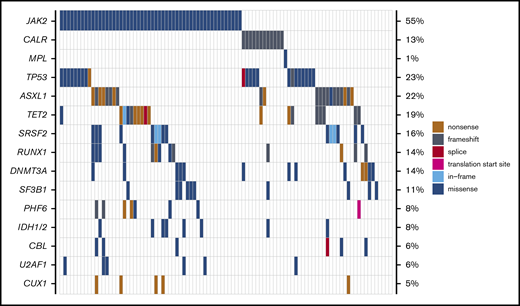
Mutational landscape of patients with MPN-BP undergoing HCT (n = 95). Genes mutated in ≥5% of study patients are displayed, with the frequencies listed along the right side of the figure.
Mutational landscape of patients with MPN-BP undergoing HCT (n = 95). Genes mutated in ≥5% of study patients are displayed, with the frequencies listed along the right side of the figure.
Transplantation outcomes in the whole study cohort
At 5 years, the whole study cohort (N = 177) had an OS of 18% (95% CI, 12-24) and a PFS of 12% (95% CI, 7-17), with a cumulative incidence of relapse of 66% (95% CI, 59-73) and an NRM of 22% (95% CI, 16-28). In a multivariate analysis of clinically relevant pretransplant variables (Table 2), poor-risk cytogenetics was associated with inferior OS (HR, 1.71; 95% CI, 1.21-2.41) (Figure 2A), inferior PFS (HR, 1.78; 95% CI, 1.27-2.50), and a higher relapse rate (HR, 1.93; 95% CI, 1.32-2.82) (Figure 2B) compared with favorable/intermediate-risk alterations. Patients undergoing HCT using PB progenitor cells had better OS (HR, 0.60; 95% CI, 0.38-0.96) due to lower NRM (HR, 0.28; 95% CI, 012-0.62). Notably, there was no difference in OS (HR, 1.34; 95% CI, 0.96-1.87) or relapse (HR, 1.34; 95% CI, 0.96-2.02) between MPN-BP patients with PB/BM blasts <5% at the time of HCT and those with active leukemia. However, PFS was inferior in patients undergoing HCT with active leukemia (HR, 1.45; 95% CI, 1.05-2.01; P = .02).
Multivariate analysis of patients undergoing HCT for MPN-BP (N = 177)
| Variable | n | HR (95% CI) | P |
|---|---|---|---|
| OS | |||
| Cytogenetics | .01 | ||
| Favorable*/intermediate | 97 | 1.00 | — |
| Adverse | 67 | 1.71 (1.21-2.41) | .002 |
| Not tested/missing | 13 | 1.27 (0.67-2.39) | .47 |
| Graft source | |||
| BM | 22 | 1.00 | — |
| PB | 155 | 0.60 (0.38-0.96) | .03 |
| Relapse | |||
| Cytogenetics | .003 | ||
| Favorable†/intermediate | 97 | 1.00 | — |
| Adverse | 67 | 1.93 (1.32-2.82) | .0007 |
| Not tested/missing | 13 | 1.09 (0.50-2.40) | .82 |
| In vivo T-cell depletion | |||
| No | 131 | 1.00 | — |
| Yes | 46 | 0.64 (0.42-0.98) | .04 |
| NRM | |||
| Graft source | |||
| BM | 22 | 1.00 | — |
| PB | 155 | 0.28 (0.12-0.62) | .002 |
| PFS | |||
| Cytogenetics | .003 | ||
| Favorable†/intermediate | 97 | 1.00 | — |
| Adverse | 67 | 1.78 (1.27-2.50) | .0008 |
| Not tested/missing | 13 | 1.11 (0.58-2.10) | .76 |
| Disease status at HCT | |||
| PB/BM blasts <5% | 101 | 1.00 | — |
| Active leukemia | 76 | 1.45 (1.05-2.01) | .02 |
| In vivo T-cell depletion | |||
| No | 131 | 1.00 | — |
| Yes | 46 | 0.63 (0.44-0.91) | .01 |
Factors tested in multivariate analysis are summarized in the Appendix.
Only one patient had favorable cytogenetics.
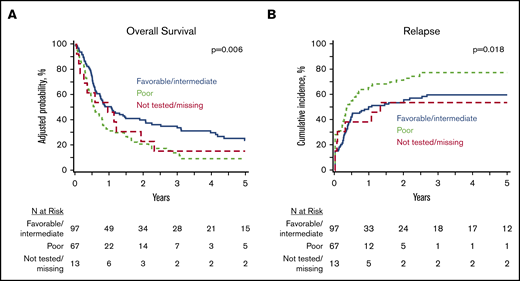
Impact of cytogenetics on HCT outcomes in MPN BP. Adjusted OS (A) and cumulative incidence of relapse (B) in the whole MPN-BP cohort (n = 177).
Impact of cytogenetics on HCT outcomes in MPN BP. Adjusted OS (A) and cumulative incidence of relapse (B) in the whole MPN-BP cohort (n = 177).
Transplantation outcomes in patients with molecular data
In patients with analyzable molecular samples (n = 95), at 5 years the OS and PFS were 16% (95% CI, 9-25) and 11% (95% CI, 6-19), respectively, with a cumulative incidence of relapse of 66% (95% CI, 56-75) and NRM of 23% (95% CI, 15-32). These outcomes were comparable between this subcohort of patients and individuals without sequencing data (supplemental Table 3). All genes mutated in ≥10 patients were tested individually in multivariate analysis alongside clinically relevant variables (Table 3), and only the presence of TP53 mutations had an independent impact on transplant outcomes. No adverse impact of MPN driver mutations (JAK2/CALR/MPL), other myeloid malignancy mutations, or the number of mutations was observed. The 3-year OS and cumulative incidence of relapse of patients with mutated vs unmutated TP53 were 4% vs 33% (P < .001) and 91% vs 58% (P < .001) (Figure 3). After adjusting for TP53 mutation status, there was no difference in adjusted OS or relapse between MPN-BP patients with PB/BM blasts <5% and those with active leukemia at the time of HCT (Figure 4).
Clinical significance of individual genetic mutations in multivariate analysis*
| NRM | Relapse | PFS | OS | ||||||
|---|---|---|---|---|---|---|---|---|---|
| Oncogenic variant | n | HR (95% CI) | P | HR (95% CI) | P | HR (95% CI) | P | HR (95% CI) | P |
| TP53 | |||||||||
| No | 73 | 1.00 | 1.00 | 1.00 | 1.00 | ||||
| Yes | 22 | 0.66 (0.14-3.00) | .59 | 2.59 (1.41-4.74) | .002 | 2.18 (1.25-3.82) | .006 | 1.99 (1.14-3.49) | .02 |
| JAK2 | |||||||||
| No | 43 | 1.00 | 1.00 | 1.00 | 1.00 | ||||
| Yes | 52 | 0.89 (0.37-2.15) | .79 | 0.93 (0.56-1.56) | .79 | 0.90 (0.57-1.41) | .63 | 0.75 (0.47-1.19) | .22 |
| ASXL1 | |||||||||
| No | 74 | 1.00 | 1.00 | 1.00 | 1.00 | ||||
| Yes | 21 | 1.69 (0.66-4.32) | .27 | 0.94 (0.51-1.74) | .84 | 1.08 (0.62-1.88) | .78 | 1.42 (0.85-2.38) | .18 |
| TET2 | |||||||||
| No | 77 | 1.00 | 1.00 | 1.00 | 1.00 | ||||
| Yes | 18 | 0.80 (0.26-2.43) | .69 | 0.81 (0.41-1.60) | .54 | 0.91 (0.50-1.66) | .77 | 0.63 (0.33-1.19) | .15 |
| SRSF2 | |||||||||
| No | 80 | 1.00 | 1.00 | 1.00 | 1.00 | ||||
| Yes | 15 | 1.13 (0.41-3.16) | .81 | 0.68 (0.32-1.45) | .32 | 0.75 (0.39-1.42) | .37 | 0.95 (0.50-1.79) | .87 |
| DNMT3A | |||||||||
| No | 82 | 1.00 | 1.00 | 1.00 | 1.00 | ||||
| Yes | 13 | 1.31 (0.35-4.93) | .69 | 1.04 (0.48-2.23) | .92 | 0.85 (0.43-1.69) | .65 | 1.22(0.63-2.33) | .56 |
| RUNX1 | |||||||||
| No | 82 | 1.00 | 1.00 | 1.00 | 1.00 | ||||
| Yes | 13 | 0.74 (0.20-2.71) | .64 | 0.65 (0.31-1.39) | .27 | 0.64 (0.32-1.29) | .21 | 0.71 (0.37-1.37) | .31 |
| CALR | |||||||||
| No | 83 | 1.00 | 1.00 | 1.00 | 1.00 | ||||
| Yes | 12 | 0.63 (0.08-4.90) | .66 | 1.49 (0.75-2.98) | .26 | 1.19 (0.60-2.35) | .62 | 1.00 (0.52-1.94) | 1.00 |
| SF3B1 | |||||||||
| No | 85 | 1.00 | 1.00 | 1.00 | 1.00 | ||||
| Yes | 10 | 1.56 (0.50-4.86) | .44 | 0.73 (0.29-1.84) | .50 | 0.92 (0.44-1.93) | .83 | 0.96 (0.46-1.99) | .90 |
| No. of gene mutations* | — | — | 1.02 (0.83-1.24) | .88 | 1.02 (0.85-1.22) | .82 | 1.04 (0.87-1.25) | .64 | |
Each gene present in ≥10 patients was individually tested in multivariate analysis with the factors listed in the Appendix.
Tested as continuous variable.
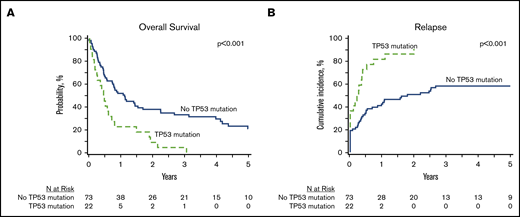
Impact of TP53 mutations HCT outcomes in MPN-BP. OS (A) and relapse (B) in the subset of patients with DNA available for targeted sequencing (n = 95).
Impact of TP53 mutations HCT outcomes in MPN-BP. OS (A) and relapse (B) in the subset of patients with DNA available for targeted sequencing (n = 95).
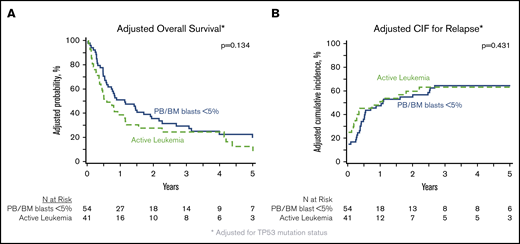
Impact of degree of blast reduction on HCT outcomes in MPN-BP. Adjusted OS (A) and adjusted cumulative incidence of relapse (B), both adjusted for TP53 mutation status, in the subset of patients with DNA available for targeted sequencing (n = 95).
Impact of degree of blast reduction on HCT outcomes in MPN-BP. Adjusted OS (A) and adjusted cumulative incidence of relapse (B), both adjusted for TP53 mutation status, in the subset of patients with DNA available for targeted sequencing (n = 95).
Exploratory analyses
Genetic comparison of patients in remission vs active leukemia
Because we did not observe any impact of remission status on OS or relapse after HCT, we performed several exploratory analyses to compare mutational patterns between patients with active leukemia and those with PB/BM blasts <5% at the time of transplant. There were no genes enriched for mutations in either cohort (Figure 5; supplemental Table 4), and there was no difference in the median number of mutations between the 2 groups (2.5 vs 3; P = .67) (Figure 6). We also compared mutational VAFs between the 2 cohorts (Figure 7). As expected based on recent data from AML,31-34 genes associated with clonal hematopoiesis, such as DNMTA3, ASXL, and TET2 (DAT), were frequently present at high VAF in remission samples; however, genes other than DAT were also present at high VAF in many remission samples, indicating a significant residual disease burden in these patients. Notably, there was no significant difference in the VAFs of MPN driver genes (JAK2, CALR, and MPL) or TP53 between patients in remission and those with active leukemia at HCT. Together, these data indicate that mutational burden remains high in patients with BP-MPN despite blast reduction therapy.
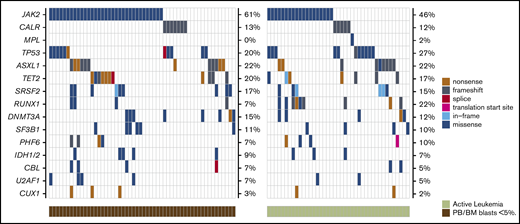
Comparison of the genetic landscape of MPN-BP patients with active leukemia vs those with PB/BM blasts <5% at the time of HCT. Mutation frequencies are displayed on the right side of each plot.
Comparison of the genetic landscape of MPN-BP patients with active leukemia vs those with PB/BM blasts <5% at the time of HCT. Mutation frequencies are displayed on the right side of each plot.
![Comparison of number of mutations seen in MPN-BP patients with PB/BM blasts <5% vs those with active leukemia at the time of transplant. Each patient is represented by a single dot, with the horizontal line showing the median number of mutations in each group (2.5 [PB/BM blasts <5%] vs 3 [active leukemia]; P = .67, Mann-Whitney U test).](https://ash.silverchair-cdn.com/ash/content_public/journal/bloodadvances/4/21/10.1182_bloodadvances.2020002727/6/m_advancesadv2020002727f6.png?Expires=1769079679&Signature=bOSjO5MErgCJO9BuWiOJZDgQa3DMPOjuTWumGyu9S17hII5OJi7jbTWxsXvlQCXcHzqlCEMvL9xWzgC17~TiwIIZ52SYsThQkdCPUp2o3m59wrNFoijIvRJVXVMcY9tZyzj9hq~atHvAGesQgEi3GXKlXkQas5PILEBqSkZmZ5~wDocjsHbuBcPyE2TJXG~RyQDCLjqlxpSWwGqouUff2iH6AKWiItxeN1~YR8j-EQrDPyZQ81rIjW1oGf7KznOalw5XhZa9v~uhINmuHAgUbPFiA4Zhtur3kYBcLz9l7DOAUVNHc2ci30q0TWLACHrIxy4nyopvlp-~F7PRaClOrA__&Key-Pair-Id=APKAIE5G5CRDK6RD3PGA)
Comparison of number of mutations seen in MPN-BP patients with PB/BM blasts <5% vs those with active leukemia at the time of transplant. Each patient is represented by a single dot, with the horizontal line showing the median number of mutations in each group (2.5 [PB/BM blasts <5%] vs 3 [active leukemia]; P = .67, Mann-Whitney U test).
Comparison of number of mutations seen in MPN-BP patients with PB/BM blasts <5% vs those with active leukemia at the time of transplant. Each patient is represented by a single dot, with the horizontal line showing the median number of mutations in each group (2.5 [PB/BM blasts <5%] vs 3 [active leukemia]; P = .67, Mann-Whitney U test).
![Comparison of the VAF of mutations in patients with MPN-BP undergoing HCT with PB/BM blasts <5% vs those with active leukemia. Individual patients are ordered along the horizontal axis, with the VAFs for each mutation in that individual displayed along the vertical axis. Data points for MPN driver genes (JAK2, CALR, and MPL) are displayed in red, TP53 variants in blue, clonal hematopoiesis genes (DAT [DNMT3A, ASXL1, and TET2]) in green, and all other genes in black. The median VAF for MPN drivers, TP53, and DAT genes did not differ between patients with PB/BM blasts <5% vs those with active leukemia (drivers, 39.0 vs 30.3 [P = .64]; TP53, 9.7 vs 32.4 [P = .39]; DAT, 31.9 vs 27.2 [P = .47]; all, Mann-Whitney U test). In instances in which a gene was mutated more than once in a patient, the variant with the higher VAF was used for statistical analyses.](https://ash.silverchair-cdn.com/ash/content_public/journal/bloodadvances/4/21/10.1182_bloodadvances.2020002727/6/m_advancesadv2020002727f7.png?Expires=1769079679&Signature=jluJr1U2KR86M27ORpR0o3pKmWVxiNaVX-l-n42VqkELbbg~JXnDcMiNbEzUaLqQtYrIgHF-0Uu-rEGPhIOz2vm4503XpdjBexxOJvc7M8h7ihHshWzLpkHZ9TfzYQ9dF~XQb1zP~FMBqavAeMiJsl5GyICxhGxYDftShTf9A5BhlMYh2S7Fk-ggDDfrdjELLv9lNtwRvx8IoQWdN6m-G0Q-N28lg~ORK3b7EJXr5YR0~2j3dDW6yUqpANbydt1dMlSXeD3px3b2-1CyhnoQNxwImIt8wSkzC32JXMGWKxvfab423J25RMkoC8b9k17Ei5yAmMF93xrZvLjms~Mi4g__&Key-Pair-Id=APKAIE5G5CRDK6RD3PGA)
Comparison of the VAF of mutations in patients with MPN-BP undergoing HCT with PB/BM blasts <5% vs those with active leukemia. Individual patients are ordered along the horizontal axis, with the VAFs for each mutation in that individual displayed along the vertical axis. Data points for MPN driver genes (JAK2, CALR, and MPL) are displayed in red, TP53 variants in blue, clonal hematopoiesis genes (DAT [DNMT3A, ASXL1, and TET2]) in green, and all other genes in black. The median VAF for MPN drivers, TP53, and DAT genes did not differ between patients with PB/BM blasts <5% vs those with active leukemia (drivers, 39.0 vs 30.3 [P = .64]; TP53, 9.7 vs 32.4 [P = .39]; DAT, 31.9 vs 27.2 [P = .47]; all, Mann-Whitney U test). In instances in which a gene was mutated more than once in a patient, the variant with the higher VAF was used for statistical analyses.
Comparison of the VAF of mutations in patients with MPN-BP undergoing HCT with PB/BM blasts <5% vs those with active leukemia. Individual patients are ordered along the horizontal axis, with the VAFs for each mutation in that individual displayed along the vertical axis. Data points for MPN driver genes (JAK2, CALR, and MPL) are displayed in red, TP53 variants in blue, clonal hematopoiesis genes (DAT [DNMT3A, ASXL1, and TET2]) in green, and all other genes in black. The median VAF for MPN drivers, TP53, and DAT genes did not differ between patients with PB/BM blasts <5% vs those with active leukemia (drivers, 39.0 vs 30.3 [P = .64]; TP53, 9.7 vs 32.4 [P = .39]; DAT, 31.9 vs 27.2 [P = .47]; all, Mann-Whitney U test). In instances in which a gene was mutated more than once in a patient, the variant with the higher VAF was used for statistical analyses.
Genetic characteristics of patients with TP53 mutations
Because TP53 mutational status was the strongest predictor of patient outcomes, we characterized the TP53-mutated cohort further. There were 27 TP53 mutations in 22 individuals (five patients had two mutations), and 89% of TP53 mutations were missense alterations in the TP53 DNA-binding domain (Figure 1; supplemental Table 2). The median TP53 VAF was 18.6 (range, 2.1-91.7), and there was no difference in median VAF between patients with PB/BM blasts <5% (n = 11) and those with active leukemia (n = 11): 9.7 (2.2-48.7) vs 32.4 (2.1-91.7); P = .39. Cytogenetic information was available in 21 patients with TP53 mutations, and 14 individuals (67%) had poor-risk alterations. The 12-month relapse incidence in TP53-mutated patients was high, irrespective of remission status at HCT, cytogenetic alterations, VAF, and number of TP53 mutations. None of the patients with TP53 mutations was alive without relapse by 3 years.
Discussion
There are no prospective studies evaluating HCT outcomes for patients with MPN-BP. Such studies are logistically challenging due to disease rarity and the limited number of patients with MPN-BP who meet HCT eligibility criteria. Given the modest reported outcomes of HCT in MPN-BP, it is of clinical interest to identify those patients who could potentially benefit most from HCT. The large international database of the CIBMTR provided the unique opportunity to study this rare disease and allowed for exploration of the impact of various clinical and molecular variables on the long-term outcomes of HCT in MPN-BP. In our analysis of 177 patients with MPN-BP who underwent transplant, we showed that poor-risk cytogenetics is associated with inferior OS and PFS due to a high relapse rate. In the subset of patients in whom molecular analyses were performed, the presence of TP53 mutations was associated with poor OS, PFS, and relapse in multivariate analyses, with none of the other genes sequenced in this study having a significant impact on transplant outcomes. TP53 mutations are known to be enriched in this patient population compared with individuals with de novo AML, and they have been associated with poor outcomes.3 Here, we found that the adverse impact of TP53 mutations is not overcome by transplantation; none of these patients was alive and relapse-free at 3 years.
Importantly, the current study found no difference in OS or relapse rate between patients who had PB/BM blasts <5% at HCT compared with those with active leukemia. Previous descriptive studies from the European Bone Marrow Transplant group and a multicenter French study have reported superior outcomes of patients who were in remission before HCT.7,8 Remission criteria are poorly defined in these studies. We used a more descriptive term, PB/BM blasts <5%, which has usually been defined as remission in published studies. However, consistent with our findings, studies from the Japanese Society of Hematopoietic Cell Transplantation and from the Mayo Clinic found no significant difference in outcomes in the small numbers of patients with MPN-BP in remission vs those with active leukemia at the time of HCT.13,35 The molecular analyses performed here provide a potential explanation for this finding, as there was no difference in the mutational spectrum or number of mutations in individuals undergoing transplant with PB/BM blasts <5% vs those with active leukemia. Patients with PB/BM blasts <5% had a high residual mutational burden, including not only in genes associated with clonal hematopoiesis but also TP53, MPN driver mutations, and other genes of relevance in myeloid malignancies. These findings suggest that “remission” in MPN-BP is very different from that in de novo AML and may reflect conversion of the disease from the blast phase to a second chronic phase, similar to what can occur with chronic myeloid leukemia in blast phase treated with tyrosine kinase inhibitors.36
Compared with previous studies of transplant outcomes in patients with MPN-BP,7,8,13,35 the current study has several strengths, including a large sample size, an extended follow-up period, and detailed molecular analysis. However, limitations of this data set, inherent to its retrospective, registry-based design, include the lack of centralized review of BM pathology, leading to remission status being assigned on the basis of basic morphologic criteria, and molecular analysis being performed at a single time point. We were unable to apply international working group criteria designed for response assessment in AML in prospective clinical trials. The detailed information required for response assessment such as blood counts on the day of BM examination, information on transfusion requirements, and presence of extramedullary leukemia was not specifically collected in the registry data for this purpose. In addition, samples from the MPN chronic phase and at leukemic transformation before blast reduction therapy were not available in the CIBMTR repository, limiting the ability to assign variants to the chronic MPN and/or leukemic disease clones. Nonetheless, the high residual mutation burden in patients with PB/BM blasts <5% suggests an inherent chemoresistance of these clones to blast reduction therapy. Further studies analyzing serial samples obtained before and after blast reduction therapies are required to fully appreciate the impact of blast reduction strategies on clonal dynamics in patients with MPN-BP.
Approximately half of the patients in this study relapsed within 1 year of HCT, and this proportion was even higher in individuals with poor-risk cytogenetics or mutated TP53. The dismal outcomes in this latter group highlight that conventional transplant strategies are of limited benefit in this population, and novel therapeutic approaches are required. For example, patients with mutated TP53 could potentially benefit from the incorporation of agents such as APR-246 or magrolimab,37,38 either in preparation for HCT or as maintenance therapy posttransplant. Given the lack of efficacy of conventional HCT in TP53-mutated patients in blast phase, these patients may be considered for early HCT in chronic phase.
Although HCT resulted in long-term survival in a proportion of patients without high-risk genetic or cytogenetic features, a high risk of relapse was seen across the entire cohort, and we observed no improvement in survival outcomes in transplants performed in recent years vs the more distant past. Moreover, these findings reinforce the need to actively work to improve treatment approaches for MPN-BP. Systematic evaluation of the benefit of maintenance therapies or the inclusion of mutation-targeting therapies, such as isocitrate dehydrogenase inhibitors for IDH1/2 mutant cases, is a priority to improve outcomes for this patient population.
In summary, this study provides new insights into the impact of clinical and molecular risk factors on outcomes of HCT in MPN-BP. We conclude that there is minimal benefit of HCT in patients with MPN-BP with mutated TP53, and novel strategies are required for this population. Moreover, there was no difference in the molecular profile or transplant outcomes between patients undergoing transplantation with PB/BM blasts <5% compared those with active leukemia, questioning the benefit of current blast reduction strategies. Optimal patient selection and relapse prevention strategies are required to improve the outcomes of HCT in patients with MPN-BP.
Presented in part as an oral abstract at the annual Transplantation & Cellular Therapy Meetings of the American Society for Transplantation and Cellular Therapy and the Center for International Blood and Marrow Transplant Research, Orlando, FL, 19 February 2020.
The Center for International Blood and Marrow Transplant Research supports accessibility of research in accord with the National Institutes of Health Data Sharing Policy and the National Cancer Institute Cancer Moonshot Public Access and Data Sharing Policy. The center only releases de-identified data sets that comply with all relevant global regulations regarding privacy and confidentiality.
Acknowledgments
Molecular studies were supported by a grant from the Elizabeth and Tony Comper Foundation and the Princess Margaret Cancer Foundation (V.G.). The Center for International Blood and Marrow Transplant Research (CIBMTR) is supported primarily by Public Health Service grant U24CA076518 from the National Institutes of Health (NIH)/National Cancer Institute (NCI), NIH/National Heart, Lung and Blood Institute (NHLBI) grants R21HL140314 and U01HL128568, NIH/Health Resources and Services Administration grants HHSH250201700006C, SC1MC31881-01-00, and HHSH250201700007C and grants N00014-18-1-2850, N00014-18-1-2888, and N00014-20-1-2705 from the Office of Naval Research. Additional federal support is provided by NIH grants P01CA111412, R01CA152108, R01CA215134, R01CA218285, and R01CA231141 (NCI); R01HL126589, R01HL129472, R01HL130388, and R01HL131731 (NHLBI); R01AI128775, U01AI069197, and U01AI126612 (National Institute of Allergy and Infectious Diseases); and Biomedical Advanced Research and Development Authority (BARDA) support is also provided by Be the Match Foundation, Boston Children’s Hospital, Dana-Farber, Japan Hematopoietic Cell Transplantation Data Center, St Baldrick’s Foundation, the National Marrow Donor Program, the Medical College of Wisconsin, and from the following commercial entities: AbbVie, Actinium Pharmaceuticals, Inc, Adaptive Biotechnologies, Adienne SA, Allovir, Inc, Amgen, Inc, Anthem, Inc, Astellas Pharma US, AstraZeneca, Atara Biotherapeutics, Inc, bluebird bio, Inc, Bristol Myers Squibb Co, Celgene Corporation, Chimerix, Inc, CSL Behring, CytoSen Therapeutics, Inc, Daiichi Sankyo Co, Ltd, Gamida-Cell, Ltd, Genzyme, GlaxoSmithKline, HistoGenetics, Inc, Incyte Corporation, Janssen Biotech, Inc, Janssen Pharmaceuticals, Inc, Janssen/Johnson & Johnson, Jazz Pharmaceuticals, Inc, Kiadis Pharma, Kite Pharma, Kyowa Kirin, Legend Biotech, Magenta Therapeutics, Mallinckrodt LLC, Medac GmbH, Merck & Company, Inc, Merck Sharp & Dohme Corporation, Mesoblast, Millennium, the Takeda Oncology Co, Miltenyi Biotec, Inc, Novartis Oncology, Novartis Pharmaceuticals Corporation, Omeros Corporation, OncoImmune, Inc, Orca Biosystems, Inc, Pfizer, Inc, Phamacyclics, LLC, Regeneron Pharmaceuticals, Inc, REGiMMUNE Corporation, Sanofi Genzyme, Seattle Genetics, Sobi, Inc, Takeda Oncology, Takeda Pharma, Terumo BCT, Viracor Eurofins, and Xenikos BV.
The views expressed in this article do not reflect the official policy or position of the NIH, the Department of the Navy, the Department of Defense, Health Resources and Services Administration or any other agency of the US Government.
Authorship
Contribution: V.G., J.A.K., U.R.P., and W.S. contributed to conception and design; W.S., on behalf of the Chronic Leukemia Working Committee of the CIBMTR, provided study material or patients; V.G., J.A.K., J.-M.C.-C., S.K., Z.-H.H., and W.S. collected and assembled data; V.G., J.A.K., J.-M.C.-C., S.K., Z.H.-H., B.L.S., H.J.D., R.N., and W.S. contributed to data analysis and interpretation; and all authors contributed to writing the manuscript and gave final approval to the manuscript and agree to be accountable for all aspects of the work.
Conflict-of-interest disclosure: V.G. reports consultancy with Novartis and Celgene; research funding from Novartis and Incyte; and advisory board memberships with Novartis, Celgene, and Sierra Oncology. R.M.S. is on the advisory board for CareDx. B.L.S. reports an advisory role with Celgene, Alexion, Novartis, and Incyte. R.N. reports grants from Miyarisan and Helocyte; and personal fees from Celgene, Merck, and Kyowa-Kirin, outside the submitted work. A.T.G. reports personal fees from Incyte, CTI Biopharma, Apexx Oncology, Celgene, Pfizer, Kartos, and Promedior, outside the submitted work. The remaining authors declare no competing financial interests.
Correspondence: Vikas Gupta, Princess Margaret Cancer Centre, 700 University Ave, 6-326, Toronto, ON M5G 1Z5, Canada; e-mail: vikas.gupta@uhn.ca.
Appendix: factors tested in a multivariate regression model
Patient related
Age at HCT
Karnofsky performance scores (<90 vs ≥90)
Disease related
Cytogenetic abnormalities (favorable/intermediate vs poor-risk vs missing)
Disease status before HCT (PB/BM blasts <5% vs active leukemia)
Donor type (matched sibling donor vs well matched unrelated donor vs partially/mismatched unrelated donor vs other related donor)
Transplant related
Conditioning intensity (total body irradiation–based myeloablative vs chemotherapy-based myeloablative vs reduced intensity)
Graft type (PB vs BM)
Graft-versus-host disease prophylaxis (calcineurin inhibitor + methotrexate ± others vs CNI + MMF ± others vs CNI alone vs others)
In vivo T-cell depletion with ATG or alemtuzumab (yes vs no)
Donor-recipient sex match (male–male vs male–female vs female–male vs female–female)
Donor-recipient cytomegalovirus status (+/+ vs +/− vs −/+ vs −/−)
Year of HCT (2001-2005 vs 2006-2010 vs 2011-2015)

