

Key Points
Stimulated M-CSF–derived human macrophages undergo a programmed transition to a growth-promoting, angiogenic phenotype.
Stimulated GM-CSF–derived human macrophages fail to undergo this transition and consequently retain an inflammatory phenotype.

Abstract
Stimulated macrophages are potent producers of inflammatory mediators. This activity is highly regulated, in part, by resolving molecules to prevent tissue damage. In this study, we demonstrate that inflammation induced by Toll-like receptor stimulation is followed by the upregulation of receptors for adenosine (Ado) and prostaglandin E2 (PGE2), which help terminate macrophage activation and initiate tissue remodeling and angiogenesis. Macrophages can be hematopoietically derived from monocytes in response to 2 growth factors: macrophage colony-stimulating factor (M-CSF) and granulocyte-macrophage colony-stimulating factor (GM-CSF). We examine how exposure to either of these differentiation factors shapes the macrophage response to resolving molecules. We analyzed the transcriptomes of human monocyte-derived macrophages stimulated in the presence of Ado or PGE2 and demonstrated that, in macrophages differentiated in M-CSF, Ado and PGE2 induce a shared transcriptional program involving the downregulation of inflammatory mediators and the upregulation of growth factors. In contrast, macrophages generated in GM-CSF fail to convert to a growth-promoting phenotype, which we attribute to the suppression of receptors for Ado and PGE2 and lower production of these endogenous regulators. These observations indicate that M-CSF macrophages are better prepared to transition to a program of tissue repair, whereas GM-CSF macrophages undergo more profound activation. We implicate the differential sensitivity to pro-resolving mediators as a contributor to these divergent phenotypes. This research highlights a number of molecular targets that can be exploited to regulate the strength and duration of macrophage activation.
Introduction
Macrophages express pattern recognition receptors to allow them to respond to pathogen-associated molecular patterns and damage-associated molecular patterns. These responses invariably lead to an inflammatory (M1) macrophage phenotype.1 Although the receptors and signaling cascades that promote these inflammatory responses have been extensively studied, research on the return of stimulated macrophages to homeostasis remains limited. This transition to a regulatory phenotype is important because the failure to control macrophage-driven inflammation can lead to immunopathology and, in extreme cases, even death.
Macrophages are unique in that they can mature and differentiate in response to 2 different growth factors: macrophage colony-stimulating factor (M-CSF) and granulocyte-macrophage colony-stimulating factor (GM-CSF).2 M-CSF is constitutively expressed in most tissues and is readily detected in circulation, whereas GM-CSF is expressed primarily in the lung and is induced during inflammation.3 M-CSF signals through the c-FMS receptor (CD115), which is a single-pass transmembrane protein tyrosine kinase member of the PDGF family.4 GM-CSF signals through CD116, which is an α/β heterodimeric receptor whose β-chain is shared with interleukin-3 (IL-3) and IL-5.5 Previous studies have been done in both mice and humans to compare gene expression of macrophages differentiated in these 2 CSFs; however, these studies have primarily focused on the differentiation process itself rather than on their response to stimuli.6-10 In this study, we stimulated human macrophages generated in M-CSF and GM-CSF macrophages and examined the activation response and the termination of activation in the presence of regulatory stimuli.
We and others have shown that exogenous regulators produced in the macrophage microenvironment can dampen inflammatory responses.11-15 Macrophages themselves can also produce a number of molecules that act in autocrine fashion to limit the inflammatory response. In previous studies, we demonstrated that Toll-like receptor (TLR)–stimulated murine macrophages secrete adenosine triphosphate (ATP), which they convert to adenosine (Ado) to regulate activation responses.16,17 In this study, we characterized the macrophage response to 2 endogenous regulatory molecules, Ado and prostaglandin E2 (PGE2), which we found to promote the transition of stimulated human macrophages to a growth-promoting and proangiogenic phenotype. We report that macrophages generated in M-CSFs are highly sensitive to these regulators because they upregulate receptors for Ado and PGE2. Consequently, they are poised to undergo a transition to a growth-promoting and proangiogenic phenotype. GM-CSF macrophages, in contrast, fail to undergo this transition and therefore sustain a prolonged activation response. We propose that it is because of this failure to terminate their activation response that GM-CSF macrophages have been associated with inflammation.
Methods
Differentiation and culture of human monocyte-derived macrophages
Whole blood was isolated from healthy donors under University of Maryland Institutional Review Board–approved protocols. Human monocytes were isolated via density gradient centrifugation followed by negative isolation using immunomagnetic beads (130-096-537; Miltenyi Biotec, San Diego, CA). Monocytes were cultured for 7 days in X-VIVO 15 serum-free media (04-744Q; Lonza, Walkersville, MD) containing 1% penicillin-streptomycin and 1% L-glutamine (25-005-CI; Gibco, Gaithersburg, MD) and were supplemented with either 30 ng/mL recombinant human M-CSF or 20 ng/mL recombinant human GM-CSF (AF-300-25, 300-03, respectively; Peprotech, Rocky Hill, NJ). Media containing either growth factor was replenished on day 4 after initial culture. Before stimulation, growth factor–containing media was removed and replaced with X-VIVO 15 media containing 5% fetal bovine serum (S11550; Atlanta Biologicals, Flowery Branch, GA).
Cell stimulation
Lipopolysaccharide (LPS)–stimulated macrophages were generated by the addition of 10 ng/mL ultrapure LPS from Escherichia coli K12 (Invivogen, San Diego, CA). LPS + Ado macrophages were generated by adding 10 ng/mL LPS and 50 μM Ado (A4036; Sigma-Aldrich, St Louis, MO). LPS + PGE2 macrophages were generated by adding 10 ng/mL LPS and 50 nM PGE2 (2296; Tocris, Bristol, United Kingdom). Pharmacologic inhibitor ONO AE3 208 was used to inhibit EP4 (3565; Tocris). TLR agonists FSL-1, HKLM, Loxoribine, and polyinosinic:polycytidylic acid (poly I:C) (tlrl-fsl, tlrl-hklm, tlrl-lox, tlrl-pic; Invivogen) were added to macrophages for 4 hours.
RNA isolation and data processing
Total RNA was isolated from stimulated macrophages using Trizol reagent (supplemental Table 1). RNA cleanup was performed by using RNeasy Mini Kit columns (74106; QIAGEN, Hilden, Germany). RNA quality was determined using an Agilent 2100 bioanalyzer. Poly(A)+ enriched complementary DNA (cDNA) libraries were generated using the TruSeq Sample Preparation Kit (15027084, 15027387, 1502062; Illumina, San Diego, CA), and the quality of the cDNA was determined again with the bioanalyzer. Paired-end reads (100 bp) were obtained from an Illumina HiSeq 1500 sequencing system. Reads were aligned to the human genome (Homo_sapiens.GrCh38.79) obtained from the University of California Santa Cruz genome browser (http://genome.ucsc.edu) using the Kallisto program.18 Count tables were restricted to protein-coding genes (34 425), and nonexpressed or weakly expressed genes (<1 read per million in 5 samples) were removed before subsequent analyses, resulting in 12 857 genes analyzed. Quantile normalization and log2-transformation were performed on all samples.
Data assessment, visualization, and differential expression analysis
The Limma bioconductor package was used to perform differential expression analyses. The voom module was used to transform the data based on observational level weights derived from the mean-variance relationship before statistical modeling. Experimental batch effects were adjusted for by including experimental batch as a covariate in our statistical model. Differentially expressed genes were defined as genes with a log2 fold-change >1 and a Benjamini-Hochberg multiple-testing adjusted value of P < .05. All components of the statistical pipeline named cbcbSEQ, can be accessed on GitHub (https://github.com/kokrah/cbcbSEQ/).
Single-cell RNA sequencing
Monocyte-derived macrophages generated in M-CSF (as described above) from a single donor were stimulated for 4 hours with LPS, LPS + Ado, LPS + PGE2, or nothing, and processed according to the 10× library preparation method. The samples were sequenced and processed with cell ranger 3.0.1 at the Johns Hopkins Genetics Resources Core Facility. The resulting outputs were passed to Seurat 3.1.0, merged by sample, and filtered to remove low-quality or broken cells with high mitochondrial content (>15%) and few features (<200).19 The remaining data were passed through the default Seurat pipeline. This entailed normalization, variable feature selection, data scaling, neighbor/cluster searches, the accompanying visualizations, and differential expression of markers across conditions and samples.20 The analysis was performed on 17 306 total cells, with an average of 4327 cells per sample. Specifically, 4826 cells for unstimulated, 3432 cells for LPS stimulated, 4525 cells for LPS + Ado, and 4523 cells for LPS + PGE2 samples were evaluated. There were 18 710 transcripts analyzed that had >0 counts. Components of the analysis can be accessed at (https://www.doi.org/10.5281/zenodo.4012576).
ELISA
Cytokine and growth factor levels were measured in the supernatants of macrophages stimulated for 24 hours. IL-12p40 and tumor necrosis factor (TNF) were measured using paired antibody enzyme-linked immunosorbent assay (ELISA) kits (BMS2013MST; Invitrogen, Vienna, Austria, and 555212; BD Biosciences, San Diego, CA). GM-CSF, VEGF, and THBS1 were measured by using Duoset ELISA kits (DY215, DY293B, DY3074, respectively; R&D, Minneapolis, MN). PGE2 levels in the supernatants of 24-hour LPS-stimulated M-CSF and GM-CSF macrophages was measured by using a monoclonal antibody competitive ELISA kit (514010; Cayman Chemical, Ann Arbor, MI).
ATP measurement
M-CSF and GM-CSF macrophages were stimulated for 15 minutes, 30 minutes, 1 hour, or 2 hours with 20 μM ATP (A6419; Sigma-Aldrich). The level of ATP was measured in macrophage supernatants collected at each time point using the Promega ATPlite reagent to measure ATP degradation by macrophages. Levels of ATP were normalized to the amount of protein in the wells by using the Pierce BCA Protein Assay Kit for protein quantification (23227; Thermo Fisher Scientific, Rockford, IL).
Flow cytometry
CD300E and PLAUR surface expression was measured on macrophages stimulated for 24 hours and 8 hours, respectively, using allophycocyanin-conjugated antibodies (17-3007-42 and 17-3879-42; Invitrogen, Carlsbad, CA). Fc block was used to reduce nonspecific binding (130-059-901; Miltenyi Biotec). Debris and doublets were removed using gating analysis in FlowJo version X. Surface expression is expressed as median fluorescence intensity.
Quantitative real-time polymerase chain reaction
RNA was isolated from cells using the Trizol reagent. cDNA was synthesized using the Superscript VILO cDNA Synthesis Kit (11754050; Thermo Fisher Scientific). Relative quantitation of transcript levels was performed using SYBR-Green. Samples were analyzed in a Roche Light Cycler 480 polymerase chain reaction platform. Expression levels were calculated by using the ΔCt method relative to the geometric mean of GAPDH and RAB7 as internal control genes.
Tube formation assay
Primary human umbilical vein endothelial cells (HUVECs) were cultured in EGM-2 media (CC-3162; Lonza) on tissue culture–treated plates coated with 1% gelatin from porcine skin (G1890; Sigma-Aldrich). For the assay, HUVECs were distributed into wells (40 000 cells per well in a 48-well plate) containing 100 μL of growth factor reduced and phenol red free Matrigel Matrix (356231; Corning, Bedford, MA). Supernatants collected from M-CSF and GM-CSF macrophages that were unstimulated, or stimulated with LPS, LPS + Ado, or LPS + PGE2 for 24 hours were added to the HUVECs on the Matrigel and allowed to incubate for 24 hours. Images of the HUVECs were captured in brightfield on an inverted Nikon Eclipse Ti2 Microscope at 20× total magnification. Image files were converted to a black background for visibility purposes using the “Find Edges” function, and tube length and number of nodes were assessed manually using the ImageJ software.
Results
Ado and PGE2 receptor expression by stimulated M-CSF and GM-CSF human macrophages
Human monocyte–derived macrophages were generated in the presence of M-CSF or GM-CSF and then stimulated in vitro with low levels of LPS. Their transcriptomes were analyzed by RNA sequencing (RNA-seq). In addition to the expected upregulation of transcripts encoding inflammatory cytokines and chemokines (supplemental Table 2), TLR stimulation also resulted in the upregulation of transcripts encoding receptors for Ado and PGE2 (supplemental Figure 1A) and the enzymes involved in the synthesis of these molecules. Expression of receptor transcripts was measured by real-time polymerase chain reaction before and after LPS stimulation. LPS stimulation resulted in the significant upregulation of PTGER2, and PTGER4 transcripts in M-CSF macrophages (Figure 1A-B). These transcripts were not as highly upregulated in parallel monolayers of GM-CSF macrophages stimulated in the same way (Figure 1A-B). The specific blockade of the EP4 receptor led to an increase in TNF levels in the supernatants of stimulated M-CSF macrophages, but no effect was observed in GM-CSF macrophages (supplemental Figure 1B). Genes critical for the production of PGE2, including COX2 and MPGES1 were also upregulated by LPS stimulation in M-CSF macrophages but not in GM-CSF macrophages (Figure 1C-D). The release of PGE2 was measured in supernatants of LPS-stimulated M-CSF and GM-CSF macrophages. LPS stimulation resulted in the release of higher levels of PGE2 by M-CSF but not GM-CSF macrophages (Figure 1E). We previously demonstrated that ATP released from murine macrophages is rapidly degraded to Ado by the surface ectoenzymes CD39 and CD73.16 Human macrophages generated in M-CSF degraded ATP to Ado more efficiently than GM-CSF macrophages (Figure 1F). This finding is in agreement with previously published studies indicating that the purinergic pathway differs between M-CSF and GM-CSF macrophages.21 LPS stimulation also resulted in the significant upregulation of A2AR transcripts in M-CSF but not GM-CSF macrophages (Figure 1G). The transcripts for A2BR were not significantly different between M-CSF and GM-CSF macrophages, nor were they changed after LPS stimulation (Figure 1H). In conjunction with increased Ado and PGE2 receptor expression, M-CSF macrophages responded to increasing concentrations of both Ado and PGE2 when coupled with LPS stimulation to decrease the production of inflammatory IL-12p40. This dose-dependent decrease in IL-12 was not observed in GM-CSF macrophages (supplemental Figure 1C). The expression pattern of receptors and signaling proteins in the PGE2 and Ado pathways was not exclusive to LPS stimulation, because stimulation of M-CSF macrophages with other TLR ligands, including TLR2, -3, -6, and -7 also resulted in similar expression for some of these genes (supplemental Figure 1D). As expected, constitutive COX1 messenger RNA expression was not significantly different between M-CSF and GM-CSF macrophages and was not upregulated by LPS or stimulation with other TLR ligands (supplemental Figure 1E). Altogether, these data indicate that TLR-stimulated M-CSF macrophages produce Ado and PGE2 and upregulate receptors for these molecules to make them more responsive to these endogenous regulators than their GM-CSF–derived counterparts.
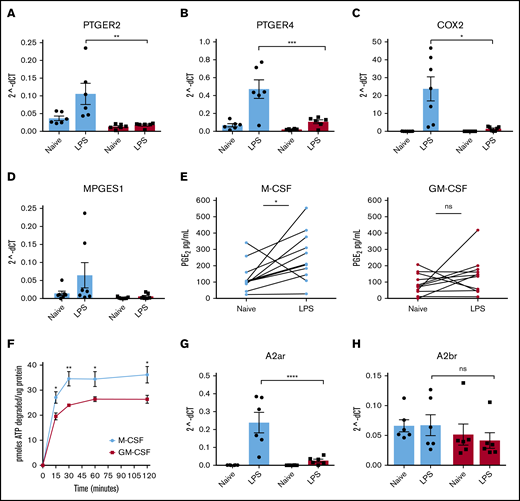
M-CSF–, but not GM-CSF–derived human macrophages, upregulate components of the Ado and PGE2pathways after LPS stimulation. Human monocytes were cultured in M-CSF (light blue bars/points) or GM-CSF (red bars/points) for 7 days and then stimulated with LPS (10 ng/mL) on day 7. Relative messenger RNA (mRNA) expression (2-ΔCT) of the surface receptors for PGE2: PTGER2 (n = 6 donors) (A) and PTGER4 (B) were analyzed by real-time quantitative polymerase chain reaction (qPCR) after LPS stimulation for 4 hours (n = 6 donors). mRNA expression for components of the PGE2 synthesis pathway: COX2 (n = 7 donors) (C) and MPGES1 (D) were analyzed by real-time qPCR after LPS stimulation for 4 hours (n = 7 donors). (E) PGE2 levels in the supernatants of M-CSF and GM-CSF macrophages stimulated with LPS for 24 hours were measured by competitive ELISA (n = 10 donors). (F) ATP (picomoles) was degraded by resting M-CSF (light blue) and GM-CSF (red) macrophages over time and expressed per microgram of protein (n = 3 donors). mRNA expression of the surface receptors for Ado: A2AR (n = 6 donors) (G) and A2BR (n = 6 donors) (H) were analyzed by real-time qPCR after LPS stimulation for 4 hours. Error bars represent standard error of the mean (SEM). *P ≤ .05; **P ≤ .01; ***P ≤ .001; ****P ≤ .0001. ns, not significant.
M-CSF–, but not GM-CSF–derived human macrophages, upregulate components of the Ado and PGE2pathways after LPS stimulation. Human monocytes were cultured in M-CSF (light blue bars/points) or GM-CSF (red bars/points) for 7 days and then stimulated with LPS (10 ng/mL) on day 7. Relative messenger RNA (mRNA) expression (2-ΔCT) of the surface receptors for PGE2: PTGER2 (n = 6 donors) (A) and PTGER4 (B) were analyzed by real-time quantitative polymerase chain reaction (qPCR) after LPS stimulation for 4 hours (n = 6 donors). mRNA expression for components of the PGE2 synthesis pathway: COX2 (n = 7 donors) (C) and MPGES1 (D) were analyzed by real-time qPCR after LPS stimulation for 4 hours (n = 7 donors). (E) PGE2 levels in the supernatants of M-CSF and GM-CSF macrophages stimulated with LPS for 24 hours were measured by competitive ELISA (n = 10 donors). (F) ATP (picomoles) was degraded by resting M-CSF (light blue) and GM-CSF (red) macrophages over time and expressed per microgram of protein (n = 3 donors). mRNA expression of the surface receptors for Ado: A2AR (n = 6 donors) (G) and A2BR (n = 6 donors) (H) were analyzed by real-time qPCR after LPS stimulation for 4 hours. Error bars represent standard error of the mean (SEM). *P ≤ .05; **P ≤ .01; ***P ≤ .001; ****P ≤ .0001. ns, not significant.
Transcriptomic analysis of human M-CSF macrophages stimulated in the presence of LPS + Ado and LPS + PGE2
To better understand the significance of Ado and PGE2 production from stimulated macrophages, RNA-seq was performed to characterize the global transcriptomic response of M-CSF–derived human macrophages stimulated in the presence of exogenous Ado (LPS + Ado) or PGE2 (LPS + PGE2) (supplemental Table 1). Early time point analysis (4 hours) was performed to observe effects specific to our stimulation conditions while minimizing potential effects from the autocrine action of macrophage-derived cytokines and other secreted proteins. The addition of Ado or PGE2 to LPS-stimulated M-CSF macrophages induced only a limited change in gene expression, and many of the most highly upregulated and downregulated transcripts were common to both stimulation conditions. Of the 10 most highly upregulated and downregulated genes by LPS + Ado and LPS + PGE2 relative to LPS stimulation alone, 4 upregulated and 5 downregulated genes were shared between LPS + Ado and LPS + PGE2 conditions (Figure 2A, marked with an asterisk). The degree of similarity between Ado and PGE2 stimulation is further illustrated by Venn diagrams indicating the number of significantly (P < .05) differentially expressed genes common to both conditions relative to LPS stimulation alone (Figure 2B). In all, 101 of the 259 upregulated genes and 91 of the 294 downregulated genes were shared by LPS + Ado and LPS + PGE2 stimulation. Spearman analysis between LPS + Ado and LPS + PGE2 stimulation led to a correlation coefficient of R = 0.772, indicating the level of similarity between these 2 conditions relative to LPS stimulation alone (Figure 2C).
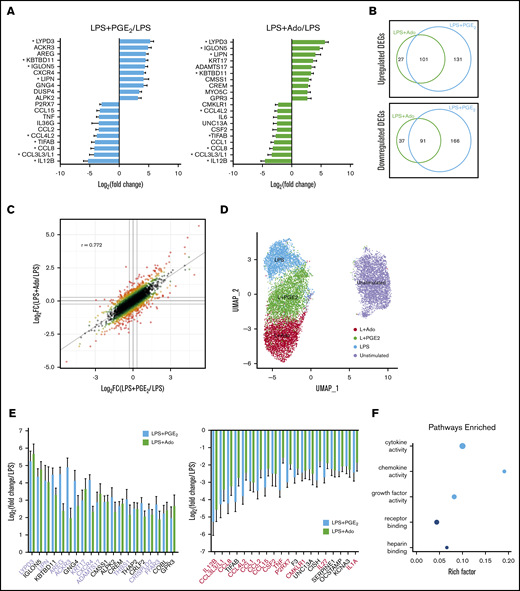
Transcriptomic analysis of LPS-stimulated M-CSF–derived human macrophages after the addition of exogenous Ado and PGE2reveals a modest but similar change in gene expression. Human monocytes were cultured in M-CSF for 7 days and then left unstimulated, or they were stimulated with LPS, LPS + Ado, or LPS + PGE2 for 4 hours before total mRNA was isolated and sequenced on an Illumina platform. (A) The top 10 most highly upregulated and bottom 10 most highly downregulated genes by LPS + PGE2 (light blue bars) and LPS + Ado (light green bars) are expressed as log2 fold change (log2FC) relative to LPS stimulation alone. Differentially expressed genes (DEGs) in common between LPS + Ado and LPS + PGE2 are marked with an asterisk (FC >2; P < .05). Note: CCL3L3 and CCL3L1 share the same ENSEMBL gene ID and were therefore represented together as 1 bar. (B) Venn diagrams indicate the number of unique and shared upregulated (top) and downregulated (bottom) DEGs (FC >2; P < .05) of macrophages stimulated by LPS + Ado and LPS + PGE2 relative to macrophages stimulated by LPS alone. (C) The log2FC of genes expressed by LPS + Ado vs LPS + PGE2 relative to LPS alone are visualized in a scatter plot. The R value calculated by Pearson’s correlation analysis is indicated in the plot area (P < 2.2e-16). (D) Single-cell RNA-seq of unstimulated macrophages or macrophages stimulated by LPS, LPS + Ado, or LPS + PGE2 at 4 hours is visualized by using uniform manifold approximation and projection (UMAP). (E) The top 20 and bottom 20 DEGs (FC >2; P < .05) that are shared between macrophages stimulated by LPS + Ado (light green bars) and LPS + PGE2 (light blue bars) are expressed as the FC relative to macrophages stimulated by LPS alone. Genes with published roles in growth promotion and angiogenesis are highlighted in lavender; genes with published roles in inflammation are highlighted in red. (F) The top 5 enriched molecular function Gene Ontology (GO) terms for the DEGs shared between LPS + Ado and LPS + PGE2 (FC >2; P < .05) are indicated. Point size corresponds to the number of DEGs in each GO category. The color of the point indicates the P value of enrichment for each GO category. The rich factor represents the ratio of the number of DEGs to the number of genes in the GO term category.
Transcriptomic analysis of LPS-stimulated M-CSF–derived human macrophages after the addition of exogenous Ado and PGE2reveals a modest but similar change in gene expression. Human monocytes were cultured in M-CSF for 7 days and then left unstimulated, or they were stimulated with LPS, LPS + Ado, or LPS + PGE2 for 4 hours before total mRNA was isolated and sequenced on an Illumina platform. (A) The top 10 most highly upregulated and bottom 10 most highly downregulated genes by LPS + PGE2 (light blue bars) and LPS + Ado (light green bars) are expressed as log2 fold change (log2FC) relative to LPS stimulation alone. Differentially expressed genes (DEGs) in common between LPS + Ado and LPS + PGE2 are marked with an asterisk (FC >2; P < .05). Note: CCL3L3 and CCL3L1 share the same ENSEMBL gene ID and were therefore represented together as 1 bar. (B) Venn diagrams indicate the number of unique and shared upregulated (top) and downregulated (bottom) DEGs (FC >2; P < .05) of macrophages stimulated by LPS + Ado and LPS + PGE2 relative to macrophages stimulated by LPS alone. (C) The log2FC of genes expressed by LPS + Ado vs LPS + PGE2 relative to LPS alone are visualized in a scatter plot. The R value calculated by Pearson’s correlation analysis is indicated in the plot area (P < 2.2e-16). (D) Single-cell RNA-seq of unstimulated macrophages or macrophages stimulated by LPS, LPS + Ado, or LPS + PGE2 at 4 hours is visualized by using uniform manifold approximation and projection (UMAP). (E) The top 20 and bottom 20 DEGs (FC >2; P < .05) that are shared between macrophages stimulated by LPS + Ado (light green bars) and LPS + PGE2 (light blue bars) are expressed as the FC relative to macrophages stimulated by LPS alone. Genes with published roles in growth promotion and angiogenesis are highlighted in lavender; genes with published roles in inflammation are highlighted in red. (F) The top 5 enriched molecular function Gene Ontology (GO) terms for the DEGs shared between LPS + Ado and LPS + PGE2 (FC >2; P < .05) are indicated. Point size corresponds to the number of DEGs in each GO category. The color of the point indicates the P value of enrichment for each GO category. The rich factor represents the ratio of the number of DEGs to the number of genes in the GO term category.
Single-cell sequencing analysis was performed on non-stimulated (NS; hereafter unstimulated), LPS stimulated, LPS + Ado, and LPS + PGE2 macrophages differentiated in M-CSF (supplemental Table 1). Uniform manifold approximation and projection analysis was performed for dimension reduction and visualization to examine the relation between individual cells. This analysis revealed that cells from each stimulation condition clustered together with a clear separation from unstimulated cells. There was overlap between cells stimulated with LPS + Ado and LPS + PGE2 (Figure 2D), consistent with the premise that these cells are transcriptionally similar.
Ado and PGE2 have an anti-inflammatory and growth-promoting effect on LPS-stimulated M-CSF macrophages. Analysis of our bulk RNA-seq data revealed that 10 of the 20 most highly upregulated genes in common between LPS + Ado and LPS + PGE2 have published roles in cell growth, proliferation, or angiogenesis (Figure 2E, lavender). Thirteen of the 20 most highly downregulated shared genes have published roles in inflammation (Figure 2E, red). Gene Ontology (GO) analysis for the list of all shared differentially expressed genes by LPS + Ado and LPS + PGE2 vs LPS alone indicated that the top 3 most significantly enriched pathways were cytokine activity, chemokine activity, and growth factor activity (Figure 2F).
Transcriptome comparison of human M-CSF and GM-CSF macrophages stimulated in the presence of LPS + Ado and LPS + PGE2
To compare the transcriptomes of M-CSF and GM-CSF macrophages, donor-matched macrophages were stimulated with LPS, LPS + Ado, or LPS + PGE2 and analyzed by RNA-seq. According to initial analyses, the responses of the 2 macrophage populations to stimulation seemed to be comparable. M-CSF macrophages exhibited a variance of 0.1, whereas GM-CSF macrophages exhibited a similar variance of 0.088 (Figure 3A). Principal component analysis resulted in a separation of samples based on stimulation condition (Figure 3B). M-CSF and GM-CSF samples segregated along PC1, which accounted for 54% of the variance. LPS, LPS + Ado, and LPS + PGE2 samples segregated along PC2, which accounted for only 14% of the variance. GM-CSF samples exhibited slightly less of a spread between LPS, LPS + Ado, and LPS + PGE2 along PC2 than did M-CSF samples, suggesting that these stimulation conditions may not have had as great an effect on the transcriptome of GM-CSF macrophages relative to M-CSF macrophages. Volcano plots show a larger number of significantly differentially expressed genes in M-CSF macrophages (489 for LPS + PGE2 and 256 for LPS + Ado) than GM-CSF macrophages (126 and 7, respectively) relative to LPS stimulation alone (Figure 3C).
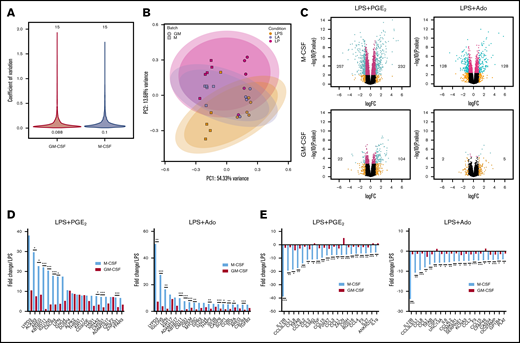
Transcriptomic analysis of GM-CSF–derived human macrophages reveals a highly limited response to exogenous Ado and PGE2. Donor matched human monocytes were cultured in M-CSF and GM-CSF for 7 days and were then left unstimulated or were stimulated with LPS, LPS + Ado, or LPS + PGE2 for 4 hours before total mRNA was isolated and sequenced on an Illumina platform. (A) Coefficients of variation (CoV) were calculated and plotted for M-CSF (blue, 0.1) and GM-CSF (red, 0.088) samples stimulated with LPS, LPS + Ado, or LPS + PGE2. The number of samples analyzed for M-CSF and GM-CSF are indicated above the violins (30 total). The y-axis represents the CoV, and the width of each violin changes according to the number of transcripts with that CoV. (B) Principal component analysis (PCA) indicates variance between samples and sample stimulations including LPS, LPS + Ado (LA) and LPS + PGE2 (LP). (C) Volcano plots exhibit the log2FC of all the genes expressed in macrophages stimulated by LPS + Ado and LPS + PGE2 relative to macrophages stimulated by LPS alone for both M-CSF (top) and GM-CSF (bottom) samples. The numbers printed in the box are the number of DEGs with a fold change >2 and P < .05 (number of green dots). (D) The fold changes of the top 20 upregulated DEGs (n = 5; FC >2; P < .05) by LPS + PGE2 and LPS + Ado in M-CSF macrophages (light blue bars) and their corresponding fold changes in GM-CSF macrophages (red bars) are plotted relative to LPS stimulation alone. (E) The fold changes of the bottom 20 downregulated DEGs (n = 5; FC >2; P < .05) by LPS + PGE2 and LPS + Ado in M-CSF macrophages (light blue bars) and their corresponding fold changes in GM-CSF macrophages (red bars) are plotted relative to LPS stimulation alone. Note: CCL3L3 and CCL3L1 share the same ENSEMBL gene ID and were therefore represented together as 1 bar. *P ≤ .05; **P ≤ .01; ***P ≤ .001.
Transcriptomic analysis of GM-CSF–derived human macrophages reveals a highly limited response to exogenous Ado and PGE2. Donor matched human monocytes were cultured in M-CSF and GM-CSF for 7 days and were then left unstimulated or were stimulated with LPS, LPS + Ado, or LPS + PGE2 for 4 hours before total mRNA was isolated and sequenced on an Illumina platform. (A) Coefficients of variation (CoV) were calculated and plotted for M-CSF (blue, 0.1) and GM-CSF (red, 0.088) samples stimulated with LPS, LPS + Ado, or LPS + PGE2. The number of samples analyzed for M-CSF and GM-CSF are indicated above the violins (30 total). The y-axis represents the CoV, and the width of each violin changes according to the number of transcripts with that CoV. (B) Principal component analysis (PCA) indicates variance between samples and sample stimulations including LPS, LPS + Ado (LA) and LPS + PGE2 (LP). (C) Volcano plots exhibit the log2FC of all the genes expressed in macrophages stimulated by LPS + Ado and LPS + PGE2 relative to macrophages stimulated by LPS alone for both M-CSF (top) and GM-CSF (bottom) samples. The numbers printed in the box are the number of DEGs with a fold change >2 and P < .05 (number of green dots). (D) The fold changes of the top 20 upregulated DEGs (n = 5; FC >2; P < .05) by LPS + PGE2 and LPS + Ado in M-CSF macrophages (light blue bars) and their corresponding fold changes in GM-CSF macrophages (red bars) are plotted relative to LPS stimulation alone. (E) The fold changes of the bottom 20 downregulated DEGs (n = 5; FC >2; P < .05) by LPS + PGE2 and LPS + Ado in M-CSF macrophages (light blue bars) and their corresponding fold changes in GM-CSF macrophages (red bars) are plotted relative to LPS stimulation alone. Note: CCL3L3 and CCL3L1 share the same ENSEMBL gene ID and were therefore represented together as 1 bar. *P ≤ .05; **P ≤ .01; ***P ≤ .001.
We selected the top 20 differentially expressed genes by M-CSF macrophages stimulated with LPS + Ado and LPS + PGE2 vs LPS alone and compared their fold changes with the corresponding stimulation conditions in GM-CSF macrophages. Many of these transcripts were not as highly upregulated in GM-CSF samples (Figure 3D). The same was observed for the most highly downregulated genes by LPS + Ado and LPS + PGE2 vs LPS alone. These transcripts are not as highly downregulated by Ado and PGE2 in GM-CSF macrophages (Figure 3E).
The expression of selected genes involved in cell growth and tissue remodeling were examined by quantitative polymerase chain reaction in M-CSF and GM-CSF macrophages. These genes, including THBS1, CD93, AREG, VEGFA, CD300E, CXCL13, MMP10, and RGS2 were all significantly upregulated by LPS + Ado and LPS + PGE2 stimulation compared with LPS alone in M-CSF macrophages (Figure 4, light blue bars). We recognize that AREG and CXCL13 have been shown to potentiate inflammation within specific contexts22-24 ; however, these genes also exhibit a supporting role in wound healing and angiogenesis.25-29 With the single exception of TGFA, an upregulation of all these regulatory transcripts was not observed in GM-CSF macrophages (Figure 4, red bars).

M-CSF but not GM-CSF human macrophages upregulate genes involved in growth and angiogenesis after the addition of exogenous Ado and PGE2. Donor matched human monocytes were cultured in M-CSF (light blue bars) and GM-CSF (red bars) for 7 days and then were left unstimulated or were stimulated with LPS, LPS + Ado, or LPS + PGE2 for 4 hours before mRNA was isolated and analyzed by real-time quantitative polymerase chain reaction (n = 5). *P ≤ .05; **P ≤ .01; ***P ≤ .001; ****P ≤ .0001.
M-CSF but not GM-CSF human macrophages upregulate genes involved in growth and angiogenesis after the addition of exogenous Ado and PGE2. Donor matched human monocytes were cultured in M-CSF (light blue bars) and GM-CSF (red bars) for 7 days and then were left unstimulated or were stimulated with LPS, LPS + Ado, or LPS + PGE2 for 4 hours before mRNA was isolated and analyzed by real-time quantitative polymerase chain reaction (n = 5). *P ≤ .05; **P ≤ .01; ***P ≤ .001; ****P ≤ .0001.
In vitro characterization of M-CSF and GM-CSF human macrophages
We performed single-cell RNA-seq analysis (supplemental Figure 2A) to look for potential biomarkers of tissue-regenerating macrophages. Transcripts expressed in a high percentage of cells that were also upregulated in our bulk RNA-seq analysis were considered. Single-cell expression of candidate genes from biomarker analysis outputs from Seurat (supplemental Figure 2B-C) were visualized using violin plots. The expression levels of THBS1 and VEGFA were higher in LPS + Ado and LPS + PGE2 samples relative to unstimulated or LPS-stimulated M-CSF macrophages (Figure 5A). The levels of these secreted proteins were measured by ELISA and found to be higher in M-CSF macrophages stimulated with LPS + Ado and LPS + PGE2 than in corresponding GM-CSF macrophages with the same treatment conditions (Figure 5B). Cell surface proteins from the gene marker lists were also visualized with violin plots. We observed a greater number of cells expressing CD300E and PLAUR at a higher level in LPS + Ado and LPS + PGE2 samples (Figure 5C). Flow cytometry was used to confirm that the cells differentiated in M-CSF and GM-CSF were in fact macrophages by examining the expression of CD68 and CD11b and the lack of expression of the dendritic cell marker CD1a (supplemental Figure 3A-C). Subsequently, the presence of CD300E and PLAUR proteins on the cell surface was measured by flow cytometry. We confirmed that they are indeed expressed at a higher level on M-CSF macrophages stimulated by LPS + Ado and LPS + PGE2 and not as highly expressed on GM-CSF macrophages (Figure 5D). CD300E is not only expressed at a higher level in LPS + Ado and LPS + PGE2 stimulation, but is also expressed on a greater number of cells as seen by flow cytometry (supplemental Figure 3D). We suggest that these 4 genes be used as protein and messenger RNA biomarkers to identify growth-promoting M-CSF macrophages.
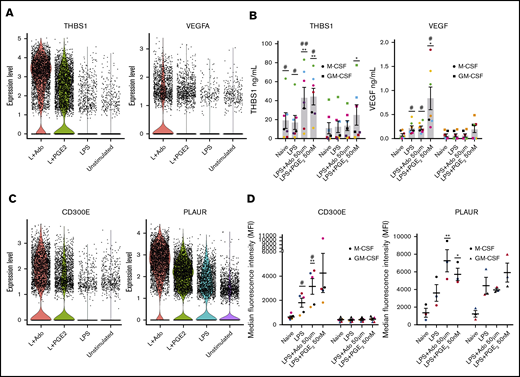
Single-cell sequencing and protein analysis revealed potential biomarkers for LPS + Ado and LPS + PGE2human regulatory macrophages. Human monocytes were cultured in M-CSF for 7 days and then were left unstimulated or were stimulated with LPS, LPS + Ado, or LPS + PGE2. (A) Violin plots are used to visualize the single-cell expression of secreted marker genes THBS1 and VEGFA. (B) Levels of the proteins THBS1 and VEGF in the supernatants of 24-hour stimulated M-CSF (circles) and GM-CSF (squares) macrophages were detected by ELISA (n = 7). *P ≤ .05; **P ≤ .01 relative to LPS stimulation alone; #P ≤ .05; ##P ≤ .01 between M-CSF and corresponding GM-CSF stimulation. (C) Violin plots are used to visualize the single-cell expression of surface-expressed marker genes CD300E and PLAUR. (D) Surface expression of CD300E (n = 5) and PLAUR (n = 3) on M-CSF (circles) and GM-CSF (triangles) macrophages stimulated for 24 hours or 8 hours was detected by flow cytometry and expressed as the median fluorescence intensity (MFI). *P ≤ .05; **P ≤ .01 relative to LPS stimulation alone; #P ≤ .05 between M-CSF and corresponding GM-CSF stimulation. Error bars represent SEM.
Single-cell sequencing and protein analysis revealed potential biomarkers for LPS + Ado and LPS + PGE2human regulatory macrophages. Human monocytes were cultured in M-CSF for 7 days and then were left unstimulated or were stimulated with LPS, LPS + Ado, or LPS + PGE2. (A) Violin plots are used to visualize the single-cell expression of secreted marker genes THBS1 and VEGFA. (B) Levels of the proteins THBS1 and VEGF in the supernatants of 24-hour stimulated M-CSF (circles) and GM-CSF (squares) macrophages were detected by ELISA (n = 7). *P ≤ .05; **P ≤ .01 relative to LPS stimulation alone; #P ≤ .05; ##P ≤ .01 between M-CSF and corresponding GM-CSF stimulation. (C) Violin plots are used to visualize the single-cell expression of surface-expressed marker genes CD300E and PLAUR. (D) Surface expression of CD300E (n = 5) and PLAUR (n = 3) on M-CSF (circles) and GM-CSF (triangles) macrophages stimulated for 24 hours or 8 hours was detected by flow cytometry and expressed as the median fluorescence intensity (MFI). *P ≤ .05; **P ≤ .01 relative to LPS stimulation alone; #P ≤ .05 between M-CSF and corresponding GM-CSF stimulation. Error bars represent SEM.
We also used the single-cell analysis to examine transcripts most variably expressed on differentially stimulated macrophages (supplemental Figure 2D). These transcripts represent the genes most highly upregulated on LPS-stimulated M1 macrophages and most highly downregulated on cells treated with LPS + Ado and LPS + PGE2. These transcripts can identify biomarkers of M1 macrophages that are highly downregulated on regulatory macrophages. Indeed, the 17 transcripts colored orange in supplemental Figure 2D represent those transcripts that were among the 100 most highly upregulated transcripts in LPS-stimulated M1 macrophages by bulk RNA-seq (P < .05; fold change >2).
To address the biological relevance of LPS + Ado and LPS + PGE2 macrophages, HUVECs were exposed to supernatants derived from unstimulated macrophages or macrophages stimulated by LPS, LPS + Ado, or LPS + PGE2 and evaluated for tube formation on a Matrigel-coated surface by microscopy. Tube formation has been proposed to be a reliable in vitro assay for angiogenesis because it involves adhesion, migration, and tubule formation all in 1 experiment.30 HUVECs cultured in supernatants collected from M-CSF LPS + Ado and LPS + PGE2 macrophages exhibited the highest level of tube formation. Supernatants from LPS + Ado and LPS + PGE2 stimulated GM-CSF macrophages did not affect tube formation of HUVECs relative to LPS supernatants alone and, furthermore, they led to significantly lower levels of tube formation compared with HUVECs cultured in unstimulated M-CSF macrophage supernatants (Figure 6A). Total tube length (Figure 6B) and the number of nodes between branches (Figure 6C) was significantly higher in HUVECs exposed to stimulated M-CSF macrophage supernatants than to GM-CSF supernatants.

M-CSF regulatory macrophages promote angiogenesis and GM-CSF macrophages promote inflammation in vitro. Human monocytes were cultured in M-CSF or GM-CSF for 7 days and then were left unstimulated or were stimulated with LPS, LPS + Ado, or LPS + PGE2 for 24 hours at which point supernatants were collected for further studies. (A) Cell tube formation in HUVECs was observed after 24-hour exposure to supernatants harvested from stimulated M-CSF and GM-CSF macrophages from 1 representative donor (n = 3 donors total). Representative images were captured by brightfield microscopy with “find edges” contrast applied in ImageJ to be able to see the tubes. (B) Total tube length was measured in pixels manually using ImageJ software on various images of HUVECs exposed to supernatants of macrophages from multiple donors (n = 3). **P ≤ .01; ****P ≤ .0001 between M-CSF and corresponding GM-CSF samples; #P ≤ .05; ##P ≤ .01 for M-CSF samples relative to unstimulated (NS) supernatants. (C) The number of nodes, defined as 3 or more tubes originating from 1 point, was counted manually using ImageJ software on various images of HUVECs exposed to supernatants of macrophages from multiple donors (n = 3). **P ≤ .01; ****P ≤ .0001 between M-CSF and corresponding GM-CSF samples; #P ≤ .05; ##P ≤ .01 for M-CSF samples relative to NS supernatants. (D) Levels of inflammatory cytokines, TNF, IL12p40, and GM-CSF, in the supernatants of stimulated macrophages were measured by ELISA (n = 5-9). *P ≤ .05 relative to LPS stimulation alone; #P ≤ .05; ##P ≤ .01 for GM-CSF relative to corresponding M-CSF samples. Error bars represent SEM.
M-CSF regulatory macrophages promote angiogenesis and GM-CSF macrophages promote inflammation in vitro. Human monocytes were cultured in M-CSF or GM-CSF for 7 days and then were left unstimulated or were stimulated with LPS, LPS + Ado, or LPS + PGE2 for 24 hours at which point supernatants were collected for further studies. (A) Cell tube formation in HUVECs was observed after 24-hour exposure to supernatants harvested from stimulated M-CSF and GM-CSF macrophages from 1 representative donor (n = 3 donors total). Representative images were captured by brightfield microscopy with “find edges” contrast applied in ImageJ to be able to see the tubes. (B) Total tube length was measured in pixels manually using ImageJ software on various images of HUVECs exposed to supernatants of macrophages from multiple donors (n = 3). **P ≤ .01; ****P ≤ .0001 between M-CSF and corresponding GM-CSF samples; #P ≤ .05; ##P ≤ .01 for M-CSF samples relative to unstimulated (NS) supernatants. (C) The number of nodes, defined as 3 or more tubes originating from 1 point, was counted manually using ImageJ software on various images of HUVECs exposed to supernatants of macrophages from multiple donors (n = 3). **P ≤ .01; ****P ≤ .0001 between M-CSF and corresponding GM-CSF samples; #P ≤ .05; ##P ≤ .01 for M-CSF samples relative to NS supernatants. (D) Levels of inflammatory cytokines, TNF, IL12p40, and GM-CSF, in the supernatants of stimulated macrophages were measured by ELISA (n = 5-9). *P ≤ .05 relative to LPS stimulation alone; #P ≤ .05; ##P ≤ .01 for GM-CSF relative to corresponding M-CSF samples. Error bars represent SEM.
The secretion of inflammatory cytokines TNF, IL12p40, and GM-CSF by M-CSF and GM-CSF macrophages was measured by ELISA. The levels of all 3 cytokines were higher in GM-CSF macrophage supernatants (Figure 6D). Furthermore, the addition of Ado or PGE2 to LPS-stimulated M-CSF macrophages resulted in reduced levels of all 3 of these cytokines, but this same downregulation was not observed in GM-CSF macrophages (Figure 6D). Stimulation of GM-CSF macrophages with LPS resulted in prolonged inflammatory cytokine production relative to M-CSF macrophages (supplemental Figure 4A-C). This suggests that GM-CSF macrophages are more resistant to the resolving molecules Ado and PGE2.
Discussion
Macrophages are highly responsive to their tissue microenvironments. Here we characterize a unique macrophage phenotype with growth-promoting and proangiogenic activity that we believe arises at the end of every immune response to restore tissue to homeostasis. We demonstrate that GM-CSF macrophages promote prolonged inflammatory responses because they are defective in this transition to a regulatory phenotype. These observations have several potential implications for influencing immune and inflammatory responses. First, they predict that M-CSF macrophages are poised to promote tissue repair and suggest that a lack of this growth factor may be related to chronic inflammatory conditions. Second, they suggest that GM-CSF macrophages may prolong immunity and delay immune resolution not only by increasing inflammation but also by delaying the resolution of inflammation. The failure of GM-CSF macrophages to transition to a growth-promoting phenotype could explain the mechanism of action of this macrophage growth factor in several diseases. Local GM-CSF levels are elevated in numerous inflammatory conditions including multiple sclerosis,31 rheumatoid arthritis,32 systemic inflammation,33 and allergic responses.34 Multiple clinical trials using monoclonal antibodies to GM-CSF have been undertaken in the context of these diseases.35,36
Deciphering macrophage activation on a spectrum1 rather than the oversimplified M1 and M2 designation aids our understanding of macrophage function in numerous physiological and disease environments. For example, our results are relevant in the context of certain cancers, because Ado and PGE2 are present at high levels in the tumor microenvironment in which tumor-associated macrophages (TAMs) reside.37-42 Our findings illuminate the striking similarity of the macrophage response to Ado and PGE2 during inflammation. This similarity could be attributed to the signaling of these molecules through G-protein–coupled receptors and downstream cyclic adenosine monophosphate production. It is possible that this phenotype extends to macrophage responses to numerous other G-protein–coupled receptor ligands, which should be further explored, because they make up the largest class of receptors for approved membrane drug targets.43 The possibility that GM-CSF macrophages are resistant to the effects of G protein-coupled receptor signaling in general is a question raised by this research.
In humans, CSF1R allele loss-of-function mutations lead to skeletal defects and brain malformations, including a loss of microglia.44,45 Studies of the inhibition of CSF1 signaling in macrophages have been performed mainly in the context of cancer. The blockade of CSF1 using a monoclonal antibody in a mouse MC38 tumor model led to a reduction in the number of TAMs as well as an increase in inflammatory macrophage markers in the remaining TAM populations.46 CSF1/CSF1R blockade by various methods led to similar decreases in TAM numbers or the upregulation of inflammatory macrophage markers in numerous other tumor model studies, including those for pancreatic cancer,47 mammary cancer,48,49 and hepatocellular carcinoma.50
Our observation that stimulated GM-CSF macrophages are resistant to the anti-inflammatory effects of Ado and PGE2 points to the potential use of GM-CSF in situations in which it would be beneficial to program macrophages to be hyperinflammatory. One example of this is the use of GM-CSF as a vaccine adjuvant. There are multiple recent clinical trials testing GM-CSF as an adjuvant in cancer vaccines because of its stimulatory properties.51,52 GM-CSF could also potentially be used in parasitic diseases such as leishmaniasis in which cell-mediated immune responses are critical for pathogen clearance.53 In fact, topical application of GM-CSF has already been demonstrated to reduce the healing time of lesions in patients with cutaneous leishmaniasis, presumably because of increased parasite killing.54
We identified protein biomarkers for regulatory macrophages, including THBS1, VEGFA, CD300E, and PLAUR, which could potentially be used in combination with cell-specific markers to identify growth-promoting macrophages in tissue. Exploring where these macrophages might be present in vivo can help us better understand their functional roles. We also demonstrated that supernatants from M-CSF macrophages stimulated with LPS + Ado and LPS + PGE2 can contribute to the proliferation and tube formation of HUVECs. This highlights the proangiogenic nature of these macrophages and has implications for macrophage actions in the tumor microenvironment as well as in wound healing and tissue repair.
In summary, human macrophages exposed to M-CSF are sensitive to the molecules Ado and PGE2, which promote the transition from an inflammatory phenotype to a regulatory phenotype. These results reveal a mechanism for both endogenous and exogenous regulation of macrophage inflammation and highlight the reparative and homeostatic roles of macrophages at the termination of inflammatory responses. In contrast, macrophages exposed to GM-CSF are resistant to this Ado and PGE2 potentiated regulatory transition, which further supports existing research on GM-CSF as a key target for modulating macrophage activation.
Send data sharing requests via e-mail to the corresponding author, David M. Mosser, at dmosser@umd.edu.
Acknowledgment
This work was supported, in part, by a National Institute of General Medical Sciences, National Institutes of Health grant (R01 GM 102589).
Authorship
Contribution: K.H. and A.T.B. performed experiments; K.H., A.T.B., N.M.E.-S., and D.M.M. analyzed results; K.H., A.T.B., and D.M.M. constructed the figures; K.H., N.M.E.-S., and D.M.M. conceptualized and designed the research; and K.H., N.M.E.-S., and D.M.M. wrote the paper.
Conflict-of-interest disclosure: The authors declare no competing financial interests.
Correspondence: David M. Mosser, Department of Cell Biology and Molecular Genetics, University of Maryland, 3102 Bioscience Research Building, College Park, MD 20742; e-mail: dmosser@umd.edu.

