

Key Points
Whole-blood filtration processing methods, as well as some filter types (inducing higher residual platelets), increase EVs in RBC units.
Storage time increases EEVs and CD47 expression.

Abstract
Extracellular vesicles (EVs) are active components of red blood cell (RBC) concentrates and may be associated with beneficial and adverse effects of transfusion. Elucidating controllable factors associated with EV release in RBC products is thus important to better manage the quality and properties of RBC units. Erythrocyte-derived EVs (EEVs) and platelet-derived EVs (PEVs) were counted in 1226 RBC units (administered to 280 patients) using a standardized cytometry-based method. EV size and CD47 and annexin V expression were also measured. The effects of donor characteristics, processing methods, and storage duration on EV counts were analyzed by using standard comparison tests, and analysis of covariance was used to determine factors independently associated with EV counts. PEV as well as EEV counts were higher in whole-blood–filtered RBC units compared with RBC-filtered units; PEV counts were associated with filter type (higher with filters associated with higher residual platelets), and CD47 expression was higher on EEVs in RBC units stored longer. Multivariate analysis showed that EEV counts were strongly associated with filter type (P < .0001), preparation, and storage time (+25.4 EEV/µL per day [P = .01] and +42.4 EEV/µL per day [P < .0001], respectively). The only independent factor associated with PEV counts was the residual platelet count in the unit (+67.1 PEV/µL; P < .0001). Overall, processing methods have an impact on EV counts and characteristics, leading to large variations in EV quantities transfused into patients. RBC unit processing methods might be standardized to control the EV content of RBC units if any impacts on patient outcomes can be confirmed. The IMIB (Impact of Microparticles in Blood) study is ancillary to the French ABLE (Age of Transfused Blood in Critically Ill Adults) trial (ISRCTN44878718).
Introduction
Extracellular vesicles (EVs) are small vesicles released in vivo by cells and are present in most body fluids. Their role in many biological processes, including cell-to-cell communication, is now widely recognized. EVs include microvesicles (or microparticles), originating from the plasma membrane, and exosomes, which originate from the endosomal system. Erythrocytes release EVs during the storage of red blood cell (RBC) units as a consequence of storage-related damage from the moment blood components are separated and stored in nonphysiological conditions (4°C, without agitation and gas exchange, and for a maximum of 42 days in France).1 During the first days of storage, altered components resulting from oxidation are tolerated and eliminated by the RBC proteasome. After prolonged storage, however, the proteasome may become overloaded or inhibited, and oxidized proteins accumulate on the intracellular side of the RBC membrane, leading to lipid raft and cytoskeletal protein network rearrangement, membrane asymmetry disruption, and, eventually, hemolysis.2 These irreversible macromolecular modifications induce aggregative properties and EV release, a physiological response to stress, activation, or apoptosis.3
EVs are small components (from 0.1-1 µm in diameter) that can be released by any cell type during activation or senescence and which carry antigens of their parent cells. During the blebbing that precedes EV formation, phospholipids are externalized onto the outer leaflet of the cell membrane. Hence, EVs are enriched in negatively charged phospholipids involved in the coagulation pathway, giving the highly procoagulant properties of EVs.4 Accordingly, EVs can initiate thrombin generation and clot propagation but also activate fibrinolysis by providing a catalytic surface for plasmin generation.5 EVs have also been associated with malignant proliferation by affecting the expression of genes involved in tumor invasion, 6 although these results have yet to be confirmed.
Moreover, by their interaction with leukocytes, EVs can modulate immune responses, with very different effects depending on the context: pro-inflammatory cytokine secretion, immune cell activation, or proliferation,7 but, conversely, reduction of macrophage activity8 or B-cell activation and inhibition of lymphocyte proliferation. Indeed, EVs are involved in transfusion-related immunomodulation events, although there is some controversy in this area.9,10
Based mostly on murine and in vitro models, it is also argued that EVs could be involved in various adverse transfusion events,11 such as antibody-independent transfusion acute lung injury,12 by activating neutrophils via FcR binding13 or by inducing pro-inflammatory cytokine release by endothelial cells and monocytes.14
Thus, determining the factors affecting the production of EVs in RBC units seems highly relevant. Storage duration is known to lead to EV production,15 and donor characteristics as well as preparation methods could also affect EV production.16,17
A key step in RBC unit preparation is the leukoreduction step, occurring before (whole-blood filtration [WBf]) or after RBC (RBC filtration [RBCf]) separation by centrifugation and decantation. Previous studies have shown that hemolysis and EV amount or size may vary depending on the filtration process used.16,18
The aim of the current study was to determine parameters that influence the extent of platelet-derived EV (PEV) and erythrocyte-derived EV (EEV) production in RBC units transfused into patients included in the IMIB (Impact of Microparticles in Blood) study, ancillary to the French ABLE (Age of Transfused Blood in Critically Ill Adults) trial.
Materials, patients, and methods
IMIB study
IMIB is an ancillary study of the ABLE trial that evaluated the impact of RBC storage on survival in patients from intensive care units.19 Overall, 287 patients from 10 French university hospitals (Besançon, Clermont-Ferrand, Dijon, Lille, Nancy, Nîmes, Paris Bichat, Paris St Antoine, Reims, and Strasbourg) were enrolled in the ABLE trial. The objective of the IMIB study was to evaluate donor and production parameters affecting EV numbers and characteristics in RBC units.
RBC unit processing and sample collection
RBC units were prepared by 7 regional Etablissement Français du Sang (EFS) branches located in Besançon (BES), Clermont-Ferrand, Nancy, Strasbourg, the Paris metropolitan area, Lille, and Nîmes. RBC units were prepared from whole blood collected into citrate-phosphate-dextrose anticoagulant and leukoreduced using either filtration before (WBf) or after (RBCf) RBC separation. Processing methods and filters used for leukoreduction are outlined (supplemental Figure 1; Table 1). All RBC units were stored at 1°C to 6°C for a maximum of 42 days.
Filters used for RBC unit preparation
| Method | Manufacturer | Filter reference | No. of pack | Abbreviations |
|---|---|---|---|---|
| WBf | Fenwal | RZ-2000 | 320 | Fe-WBf |
| Fresenius | T2975 | 158 | Fr-WBf | |
| MacoPharma | LXT | 71 | M-WBf | |
| RBCf | Fenwal | OptiPure-RC | 566 | Fe-RBCf |
| MacoPharma | LCRD2 | 111 | M-RBCf |
| Method | Manufacturer | Filter reference | No. of pack | Abbreviations |
|---|---|---|---|---|
| WBf | Fenwal | RZ-2000 | 320 | Fe-WBf |
| Fresenius | T2975 | 158 | Fr-WBf | |
| MacoPharma | LXT | 71 | M-WBf | |
| RBCf | Fenwal | OptiPure-RC | 566 | Fe-RBCf |
| MacoPharma | LCRD2 | 111 | M-RBCf |
All preparation steps were traced in the EFS information system and database (Inlog, Haemonetics, Lyon, France). The following data were collected for each RBC unit: preparation center, storage duration (days), volume (milliliters), time to processing (the time between whole blood donation and the beginning of processing, in hours), preparation method (RBCf or WBf), and data from the donor (age, sex, blood group, and complete blood cell count [CBC]) (Figure 1).
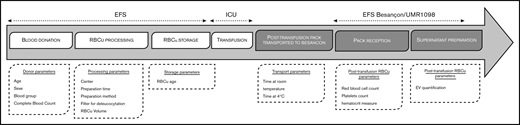
RBC unit (RBCu) course stages and associated studied parameters. ICU, intensive care unit.
RBC unit (RBCu) course stages and associated studied parameters. ICU, intensive care unit.
After RBC transfusion, empty blood bags were sent to the local EFS within 5 hours and stored at 4°C. The time from transfusion to storage at 4°C was recorded as “time at room temperature.” The bag was then kept at 4°C and sent to the laboratory for analysis (UMR1098, EFS BES). Duration of 4°C preservation before sample preparation was recorded as “time at 4°C.” A total of 1577 RBC units were collected, and 347 were excluded for lack of sufficient material for analysis and 3 because they were the only ones donated after apheresis. A single unit processed in a separate Paris processing center was also excluded (supplemental Figure 2).
The remainder of the RBC unit was collected (tubing containing the few residual milliliters of the RBC unit). A CBC count was performed by using an XE-2100 automated analyzer (Sysmex Corporation, Kobe, Japan) to quantify leukocytes, RBC, hemoglobin, hematocrit, and platelet count. Microparticle supernatants were prepared from each RBC unit as previously described,20 following International Society of Thrombosis and Hemostasis recommendations (ie, using double centrifugation at 2500g for 15 minutes and stored at –80°C until EV quantification).
EV quantification
EV quantification was performed as previously described.20 Briefly, frozen microparticle supernatants were rapidly thawed for 1 minute at 37°C and stained with annexin-V-FITC (ApoScreen Annexin V, Southern Biotech, Birmingham, AL), CD31-PE (1F11, Beckman Coulter Immunotech, Fullerton, CA), and CD41-PC7 (P2, Beckman Coulter Immunotech) for PEV identification, and annexin-V-FITC, Glycophorin A-PC7 (KC16, Beckman Coulter Immunotech), and CD47-PE (B6H12, BD Pharmingen, Le Pont de Claix, France) for EEV identification. The sum of EVs was defined as the sum of GPA+ CD47+ EEVs and CD31+ CD41+ PEVs (supplemental Figure 3). Others EVs potentially present in small quantities in the RBCs are not assessed.
CytoCount beads (DakoCytomation, Trappes, France) were added, following distributor recommendations to calculate EV concentration per microliter. Cytometer calibration of size ranges was performed by using calibrated beads (Megamix-Plus FSC, BioCytex, Marseille, France),20,21 allowing the definition of 2 standardized size ranges of EVs, namely large EVs (0.5-0.9 µm) and small EVs (0.30-0.5 µm). Titration of antibodies was performed on healthy donor plasma supernatants before each phenotyping.
Statistical analysis
Total EV counts, EV counts by origin (PEV and EEV), and other characteristics (small and large EVs, phosphatidylserine [PS] expression), were described by using summary statistics.
To study the impact of processing methods on the EV count, all the following analyses were performed on RBC units prepared at a single center (BES). EV counts were described according to the filtration method (WBf vs RBCf), filter type, and preparation time (<10 hours [or day 1 (D1)] vs 10-24 hours [or day 2 (D2)]). Groups were compared by using Student t tests or analysis of variance.
Platelet concentration and PEV counts were described according to filter type. The association between PEV count and residual platelet was explored by using linear regression. PEV and EEV counts, the relative proportion of small, CD47high, and annexin V–positive (A5+) EEV or PEV were described according to storage time (in days and with the following categories: 1-7 days, 8-21 days, and ≥22 days). P values for trend were obtained from linear regression analysis and analysis of variance comparisons. PEV and EEV counts were compared according to donor ABO blood group and sex using analysis of variance, and age using Spearman correlation.
Finally, linear regression models were built with the total EV, PEV, and EEV counts as explained variables and the studied factors as covariates: donor factors (sex, age, ABO blood group and rhesus factor, and CBC count), processing factors (filter type and preparation time), and product factors (volume, storage time, residual erythrocytes, and residual platelets). Multivariate models were selected by using a stepwise method with selection and exclusion thresholds of P = .2 and P = .05, respectively. Interaction terms tested were: donor blood group and storage time, product platelet count, and filter type.
Results
A large disparity in EV concentrations exists between RBC units at issuance
After elimination of nonconsenting patients and noncompliant units, EVs were quantified in 1226 RBC units (supplemental Figure 2). We found high variability between units (Figure 2): a mean of 1334 EVs/µL was quantified, ranging from 6 to 51 124/µL with a standard deviation (SD) of 3766 EVs/µL (Table 1). This variability was mainly driven by PEVs, whereas EEVs exhibited less variability ([minimum-maximum] ± SD = [3-18 731] ± 1306) and was not related to the transport parameters (time at room temperature and time at 4°C; P = NS) (data not shown). The average proportion of EEVs per unit was 83% of the summed PMPs and EEVs, and it was also highly variable (Table 2). Of note is that the PEV burden in two-thirds of the units was <10% of the total EVs in the unit.
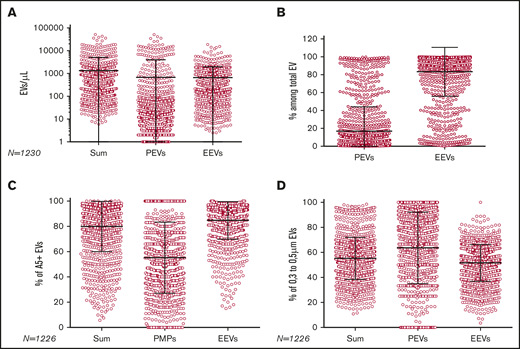
EV quantification and composition per RBC unit. (A) Sum of PEVs and EEVs, CD31+ 41+ PEVs, and CD47+ GPA+ EEVs per unit (red circle). (B) Proportion of PEVs and EEVs per RBC unit. (C) Proportion of annexin V–positive (A5+) EVs in sum of EVs, PEVs, and EEVs per unit. (D) Proportion of small EVs in sum of EVs, PEVs, and EEVs per unit. For all panels, each horizontal bar reports the mean, and each vertical bar, the SD.
EV quantification and composition per RBC unit. (A) Sum of PEVs and EEVs, CD31+ 41+ PEVs, and CD47+ GPA+ EEVs per unit (red circle). (B) Proportion of PEVs and EEVs per RBC unit. (C) Proportion of annexin V–positive (A5+) EVs in sum of EVs, PEVs, and EEVs per unit. (D) Proportion of small EVs in sum of EVs, PEVs, and EEVs per unit. For all panels, each horizontal bar reports the mean, and each vertical bar, the SD.
EV quantification in RBC unit and proportion of subpopulations of interest
| Variable | Sum of EVs | PEVs | EEVs | ||||||||
|---|---|---|---|---|---|---|---|---|---|---|---|
| Count/µL | % small | % A5+ | % PEV | % EEV | Count/µL | % small | % A5+ | Count/µL | % small | % A5+ | |
| Mean | 1334 | 55 | 80 | 17 | 83 | 668 | 64 | 56 | 657 | 52 | 85 |
| SD | 3766 | 16.8 | 20 | 27 | 27 | 3331 | 29 | 28 | 1306 | 15 | 15 |
| Median | 383 | 67 | 88 | 4 | 96 | 13 | 67 | 51 | 335 | 54 | 91 |
| Q1-Q3 | 174-827 | 46-64 | 73-94 | 1-16 | 84-99 | 15 036 | 48-88 | 35-75 | 148-670 | 43-62 | 79-95 |
| Minimum-maximum | 6-51 124 | 11-99 | 6-100 | 0-100 | 0-100 | 0-50 933 | 0-100 | 0-100 | 3-18 737 | 4-100 | 16-100 |
EVs = sum of PEVs and EEVs. Proportion of annexin V–positive (A5+) and small (0.3-0.5 µm) EVs in sum of EVs (= PEVs + EEVs), PEVs and EEVs are presented. Q1-Q3, 1st and 3rd quartile of the distribution.
The proportions of small and large EVs in RBC units were assessed: on average, 64% of PEVs and 52% of EEVs were small. Annexin V–positive EVs represented 85% of EEVs ([16-100] ± 15) and 56% of PEVs ([0-100] ± 28). On average, 78% of EEVs were CD47high (gating strategy is presented in supplemental Figure 3).
Processing methods affect EV counts in RBC units at issuance
The RBC units included in the study were prepared at 7 different centers, with the majority processed at BES (Figure 3A). Although the specifications of RBC products are standardized in France, processing methods are not: RBCf is used for 20% to 100% of units prepared, depending on the processing center. Filters used for leukoreduction and time to processing may also vary between centers (Figure 3B). Thus, because the BES center used both filtration methods and all the filter types, we focused on it for the analysis of the impact of preparation methods. Because STR used a unique method of filtration and one filter, units prepared in the STR center were used to analyze the influence of donor characteristics on EV counts.
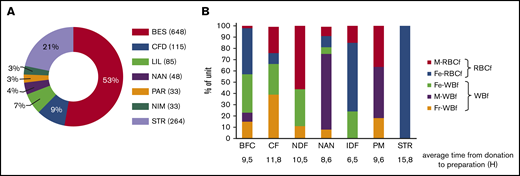
Processing centers and filtration systems used. (A) Proportion of RBC units according to processing center. (B) Proportion of RBC units according to the filter used in each processing center. BFC, Bourgognne Franche Comté; CFD, Clermont-Ferrand; Fe, Fenwal; Fr, Fresenius; IDF, Ile de France; LIL, Lille; M, MacoPharma; NAN, Nancy; NDF, Nord de France; NIM, Nîmes; PAR, the Paris metropolitan area; STR, Strasbourg.
Processing centers and filtration systems used. (A) Proportion of RBC units according to processing center. (B) Proportion of RBC units according to the filter used in each processing center. BFC, Bourgognne Franche Comté; CFD, Clermont-Ferrand; Fe, Fenwal; Fr, Fresenius; IDF, Ile de France; LIL, Lille; M, MacoPharma; NAN, Nancy; NDF, Nord de France; NIM, Nîmes; PAR, the Paris metropolitan area; STR, Strasbourg.
Regarding the impact of manufacturing processes on EV release (n = 648), WBf units showed higher PEV and EEV concentrations than RBCf units (1210 ± 4314 vs 25 ± 160 PEV/µL [P < .0001] and 724 ± 1501 vs 422 ± 494 EEV/µL [P = .0013], respectively) (Figure 4A). In light of these differences, the influence of the filters used for leukoreduction (Fresenius [Fr]-WBf, Fenwal [Fe]-WBf, and MacoPharma [M]-WBf for WBf; Fe-RBCf and M-RBCf for RBCf) on EV content at issuance was examined. Units leukoreduced with the Fr-WBf filter contained the highest number of PEVs (Figure 4B): 4555 ± 7608 PEVs/µL on average for Fr-WBf vs 16 ± 10/µL for M-RBCf; 73 ± 398/µL for Fe-WBf; 25 ± 165/µL for Fe-RBCf; and 34 ± 216/µL for M-RBCf. Regarding EEVs, differences were less obvious: units filtered using Fr-WBf and M-RBCf contained more EEVs (1096 ± 2486/µL and 1098 ± 1437/µL) than others (477 ± 709/µL for Fe-WBf, 439 ± 501/µL for Fe-RBCf, and 129 ± 180/µL for M-RBCf).
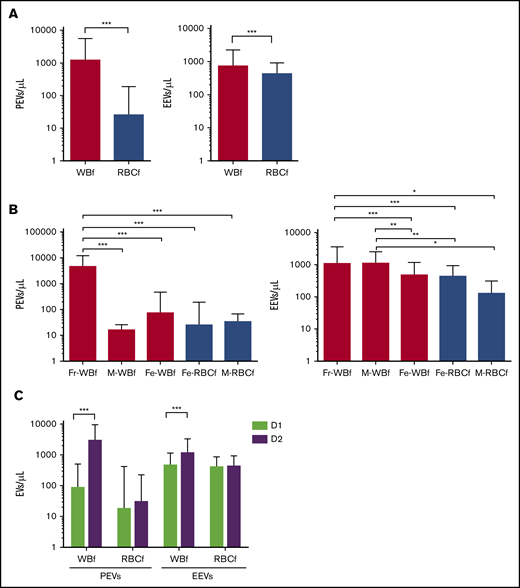
EV concentration according to preparation parameters in RBC units prepared at the BES (n = 648). (A) PEV and EEV counts according to filtration method. (B) PEV and EEV counts according to leukoreduction filter. White bars indicate WBf units, and gray bars indicate RBCf units. (C) PEV and EEV counts according to time for preparation, calculated as hours elapsed between blood donation and RBC unit preparation. Mean concentrations are shown for units prepared on the day of donation (D1, green bar) and for units prepared the day after donation (D2, purple bar). ***P < .0001, **P < .001, and *P < .05 according to Student t test. For all panels, each horizontal bar reports the mean, and each vertical bar represents the SD.
EV concentration according to preparation parameters in RBC units prepared at the BES (n = 648). (A) PEV and EEV counts according to filtration method. (B) PEV and EEV counts according to leukoreduction filter. White bars indicate WBf units, and gray bars indicate RBCf units. (C) PEV and EEV counts according to time for preparation, calculated as hours elapsed between blood donation and RBC unit preparation. Mean concentrations are shown for units prepared on the day of donation (D1, green bar) and for units prepared the day after donation (D2, purple bar). ***P < .0001, **P < .001, and *P < .05 according to Student t test. For all panels, each horizontal bar reports the mean, and each vertical bar represents the SD.
According to time until processing, PEV and EEV numbers were increased in RBCs prepared the day after blood collection (D2, n = 321) compared with units prepared the same day (D1, n = 327), from 63 to 1366/µL (P < .0001) for PEVs and 277 to 336/µL for EEVs (P < .001) (Figure 4C). Because there was a nonrandom use of filters in relation to day of preparation (in the BES center, 75% of Fr-WBf–filtered units are prepared on D2, whereas 91% of Fe-WBf–filtered units are prepared on D1), we completed the analysis focusing on the clermont ferrand center preparation center, which filtered using Fr-WBf on D1 (n = 20) and D2 (n = 25). We confirmed a statistically significantly higher level of PEVs in units prepared on D2 compared with D1 (7422 ± 11 370 on D2 vs 1781 ± 4260 on D1; P = .034) (data not shown) but found no statistically significant difference in EEVs.
Impact of residual platelets on PEV concentration
Considering the filters’ impact on PEV numbers, the potential role of residual platelets in RBC units was investigated. Units filtered by Fr-WBf had a higher residual platelet count compared with other filter types (mean of 63 × 109/L for Fr-WBf–filtered units vs <2 × 10⁹/L for others; P < .0001) (Figure 5A). This observation may partly explain the higher PEV quantity in these units, because PEV concentration was correlated with residual platelets (Figure 5B). In addition, focusing on units with very low residual platelet levels (<5 × 10⁹/L), units filtered by using Fr-WBf (160 ± 171 PEVs/µL) and Fe-WBf (75 ± 413 PEVs/µL) had higher PEV levels compared with units filtered with any of the other 3: M-WBf, 16 ± 10 PEVs/µL; Fe-RBCf, 21 ± 159 PEVs/µL; and M-RBCf, 34 ± 34 PEVs/µL (Figure 5C). These findings indicate a filter effect independent of the residual platelet content.
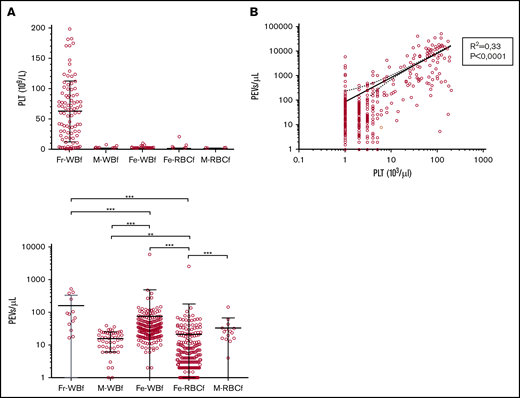
Impact of residual platelet count on PEV concentration in RBC units prepared at the BES center (n = 648). (A) Platelet (PLT) count in RBC units according to filter type: Fresenius (Fr)-WBf (n = 91), MacoPharma (M)-WBf (n = 53), Fenwal (Fe)-WBf (n = 211), Fe-RBCf (n = 261), and M-RBCf (n = 15) filters in the Bourgogne Franche-Comté center. Each circle represents a unit, and the means with SD are presented as black lines. (B) Pearson correlation for PLT and PEV concentration. (C) PEV counts in RBC units according to filter type: Fr-WBf (n = 13), M-WBf (n = 16), Fe-WBf (n = 204), Fe-RBCf (n = 258), and M-RBCf (n = 15) filters in the Bourgogne Franche-Comté center, for units with very low residual platelet levels (<5 × 10⁹/L) prepared in BES. For all panels, each horizontal bar reports a mean, and each vertical bar, the SD. ***P < .0001 and **P < .001 according to Student t test.
Impact of residual platelet count on PEV concentration in RBC units prepared at the BES center (n = 648). (A) Platelet (PLT) count in RBC units according to filter type: Fresenius (Fr)-WBf (n = 91), MacoPharma (M)-WBf (n = 53), Fenwal (Fe)-WBf (n = 211), Fe-RBCf (n = 261), and M-RBCf (n = 15) filters in the Bourgogne Franche-Comté center. Each circle represents a unit, and the means with SD are presented as black lines. (B) Pearson correlation for PLT and PEV concentration. (C) PEV counts in RBC units according to filter type: Fr-WBf (n = 13), M-WBf (n = 16), Fe-WBf (n = 204), Fe-RBCf (n = 258), and M-RBCf (n = 15) filters in the Bourgogne Franche-Comté center, for units with very low residual platelet levels (<5 × 10⁹/L) prepared in BES. For all panels, each horizontal bar reports a mean, and each vertical bar, the SD. ***P < .0001 and **P < .001 according to Student t test.
Donor characteristics affect the EV concentration in RBC units
Donor information was cross-referenced with EV quantifications for units prepared in the STR center to overcome the variability related to the preparation process, as only 1 Fe filter (fenwall) was used in this center. In this subcohort (n = 264), PEV concentration was lower in units donated by type B donors (mean of 6 ± 8 PEVs/µL, n = 20) compared with type A (24 ± 147 PEVs/µL, P = .0014, n = 113), O (20 ± 114 PEVs/µL, P ≤ .0001, n = 109), and AB (12 ± 43 PEVs/µL, P = .0007, n = 22) donors. It is noteworthy that these differences are not explained by differences in platelet levels in these units (data not shown). In parallel, EEV concentration was higher in units from type B donors (mean of 1503 ± 4230 EEVs/µL) compared with type A (417 ± 544 EEVs/µL, P = .0011) and O (484 ± 743 EEVs/µL, P = .0001) donors. The same trend was observed with AB donors (487 ± 375 EEVs/µL) but did not reach significance (Figure 6A). No differences were observed between units from male and female donors (Figure 6B) or when considering donor age (Figure 6C), even within each sex (data not shown).
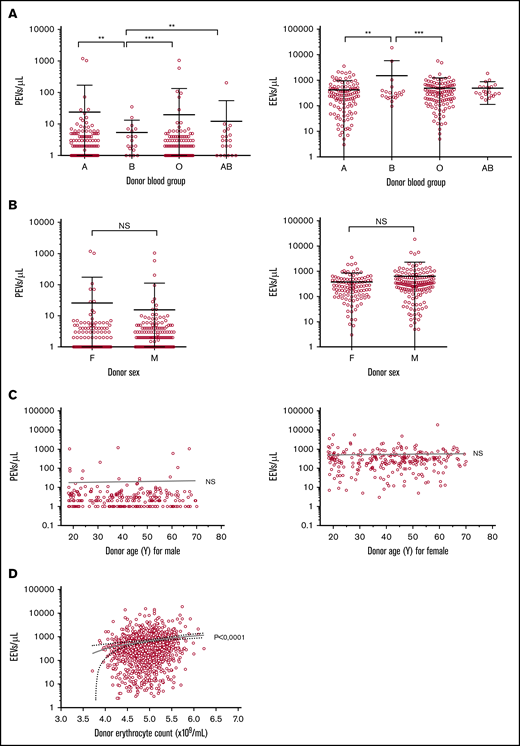
EV concentrations according to blood donor characteristics in RBC units prepared at the Strasbourg center (n = 264). (A) PEV and EEV counts according to donor blood group. Mean and SD are presented. ***P < 0.0001, **P < 0.001, with Mann-Whitney U test. A group = 113 units; B = 20; O = 110; AB = 22. (B) PEV and EEV counts according to donor sex. Mean and SD are presented. The Student t test was not significant (NS). Female (F) donors, n = 108. Male (M) donors, n = 156 units. (C) PEV and EEV counts according to donor age and sex. (D) EEV counts according to donor erythrocyte count.
EV concentrations according to blood donor characteristics in RBC units prepared at the Strasbourg center (n = 264). (A) PEV and EEV counts according to donor blood group. Mean and SD are presented. ***P < 0.0001, **P < 0.001, with Mann-Whitney U test. A group = 113 units; B = 20; O = 110; AB = 22. (B) PEV and EEV counts according to donor sex. Mean and SD are presented. The Student t test was not significant (NS). Female (F) donors, n = 108. Male (M) donors, n = 156 units. (C) PEV and EEV counts according to donor age and sex. (D) EEV counts according to donor erythrocyte count.
With regard to donor CBC, erythrocyte counts as well as hematocrit and hemoglobin levels were correlated with the EEV count (P < .0001, P < .0001, and P = .002, respectively) (Figure 6D). These results were also confirmed by using a multivariate model performed with data from units prepared in the BES center, in which the EEV level is explained by donor erythrocyte counts. PEV concentration was not correlated with any CBC parameter.
EEV but not PEV count increases with RBC unit storage
Because EV release is part of the storage lesion, we analyzed EEV and PEV counts according to unit “age” (time of conservation from processing to transfusion, in days) in the BES center (n = 648). We grouped fresh (stored <7 days), intermediate (stored from 8-21 days), and old (stored >28 days) units. PEV counts remained constant in the 3 age groups, but EEVs increased from 327 ± 882 EEVs/µL for fresh units to 1413 ± 2009 EEVs/µL in older units, a fold change of 4.3 (P < .0001) (Figure 7A), with a statistically significant linear trend (P < .0001) as confirmed by its analysis as a continuous variable (Figure 7B). Similar results were observed in other centers and when all RBC units were analyzed (data not shown).
![EEV counts during RBC unit (RBCu) storage at 4°C. (A) Mean PEV and EEV concentrations are compared between RBCu prepared in the Bourgogne Franche-Comté center and stored <7 days (red bars, n = 351), between 8 and 21 days (blue bars, n = 192), and >21 days (green bars, n = 105). (B) PEV and EEV concentrations according to days of storage. (C) EEV size and phenotype are compared in RBCu prepared at the Bourgogne Franche-Comté center and stored <7 days, between 8 and 21 days, and >21 days. Mean repartition of small (0.3-0.5 μm, pink bars) and large (0.5-0.9 μm, red bars), high (CD47high, light blue bars) and low (CD47low, blue bars) CD47 expression, and PS positive (annexin V–positive [A5+], light green bars) and negative (A5–, green bars) EEVs are presented. Percentages of small, CD47high, and A5+ EEVs are noted. (D) Percentage of CD47high expressing EEVs among total EEVs, according to storage duration for each RBCu. Pearson correlation is significant, P < .0001; r = 0.2545. (E) Percentage of small EEV among total EEVs according to storage duration for each RBCu. Pearson correlation is nonsignificant, P = .9182; r = 0.004. (F) Percentage of A5+ EEVs among total EEVs according to storage duration for each RBCu. Pearson correlation is nonsignificant (NS), P = .8928; r = –0.001. ***P < .0001 according to Student t test.](https://ash.silverchair-cdn.com/ash/content_public/journal/bloodadvances/4/21/10.1182_bloodadvances.2020001658/2/m_advancesadv2020001658f7.png?Expires=1763567821&Signature=G1HMaj9nXF2N85Gh8KuowT3TQyp6jzjGpy2nB4KQPQ1IEzxr5OeQxdAj5~GUMdxGUJot3xdq5AJbUMIs0BsxRDtFQT4u8VSEGXsyxZ-L2h6O1zOG3AiOFWUKNRpZECcXwu7kTfOWGh5cyRChxT6mRDfbn1gPQcvTU3kHENMcElGkzVlzqX7eGIaqZzgaQPhPnqmn7iT5r1tiH-5BqYy8fs6JaoBO2EwQg8-oSgnNg3wEpcBzyciscM1X8LPwyKRGnbhrLHDx7JOJ4Y4ltd4DAlx6yWg3R4EznesrO4kiXcMqWDL~734Bb0Uz77B2MjRFRiJLjzpXlbgeIYaI1d8c2w__&Key-Pair-Id=APKAIE5G5CRDK6RD3PGA)
EEV counts during RBC unit (RBCu) storage at 4°C. (A) Mean PEV and EEV concentrations are compared between RBCu prepared in the Bourgogne Franche-Comté center and stored <7 days (red bars, n = 351), between 8 and 21 days (blue bars, n = 192), and >21 days (green bars, n = 105). (B) PEV and EEV concentrations according to days of storage. (C) EEV size and phenotype are compared in RBCu prepared at the Bourgogne Franche-Comté center and stored <7 days, between 8 and 21 days, and >21 days. Mean repartition of small (0.3-0.5 μm, pink bars) and large (0.5-0.9 μm, red bars), high (CD47high, light blue bars) and low (CD47low, blue bars) CD47 expression, and PS positive (annexin V–positive [A5+], light green bars) and negative (A5–, green bars) EEVs are presented. Percentages of small, CD47high, and A5+ EEVs are noted. (D) Percentage of CD47high expressing EEVs among total EEVs, according to storage duration for each RBCu. Pearson correlation is significant, P < .0001; r = 0.2545. (E) Percentage of small EEV among total EEVs according to storage duration for each RBCu. Pearson correlation is nonsignificant, P = .9182; r = 0.004. (F) Percentage of A5+ EEVs among total EEVs according to storage duration for each RBCu. Pearson correlation is nonsignificant (NS), P = .8928; r = –0.001. ***P < .0001 according to Student t test.
EEV counts during RBC unit (RBCu) storage at 4°C. (A) Mean PEV and EEV concentrations are compared between RBCu prepared in the Bourgogne Franche-Comté center and stored <7 days (red bars, n = 351), between 8 and 21 days (blue bars, n = 192), and >21 days (green bars, n = 105). (B) PEV and EEV concentrations according to days of storage. (C) EEV size and phenotype are compared in RBCu prepared at the Bourgogne Franche-Comté center and stored <7 days, between 8 and 21 days, and >21 days. Mean repartition of small (0.3-0.5 μm, pink bars) and large (0.5-0.9 μm, red bars), high (CD47high, light blue bars) and low (CD47low, blue bars) CD47 expression, and PS positive (annexin V–positive [A5+], light green bars) and negative (A5–, green bars) EEVs are presented. Percentages of small, CD47high, and A5+ EEVs are noted. (D) Percentage of CD47high expressing EEVs among total EEVs, according to storage duration for each RBCu. Pearson correlation is significant, P < .0001; r = 0.2545. (E) Percentage of small EEV among total EEVs according to storage duration for each RBCu. Pearson correlation is nonsignificant, P = .9182; r = 0.004. (F) Percentage of A5+ EEVs among total EEVs according to storage duration for each RBCu. Pearson correlation is nonsignificant (NS), P = .8928; r = –0.001. ***P < .0001 according to Student t test.
Size repartition of EEVs as well as CD47 and PS expression by EEVs were assessed and compared in fresh, intermediate, and old units. The proportions of small EEVs and PS-positive EEVs remained constant, whereas the proportion of EEVs strongly expressing CD47 was higher in older units (92%) than in fresh units (87%; P < .0001) (Figure 7C). To verify these trends, the percentages of small, CD47high, and PS-positive EEVs were regressed against unit age for each RBC unit. This showed that unit age was positively correlated with the proportion of CD47high EEVs (P < .0001) but not with PS-positive EEVs (P = .893) or small EEVs (P = .229) (Figure 7D-F).
Multivariate analysis
In an attempt to identify parameters that influence EV counts in RBC units independently of other measured variables, a multivariate linear regression analysis was performed for units prepared at BES (Table 3). Residual platelets in units were positively associated with PEV counts (P < .0001). When Fr-WBf–filtered units were removed from the analysis, residual platelets no longer explained PEV counts, suggesting that residual platelet count is strongly correlated with this filter, as previously shown in Figure 5.
Crude and adjusted marginal means or effects of studied factors on EEV and PEV Counts
| Variable | EEVs (n = 631) | PEVs (n = 632) | ||||||||||
|---|---|---|---|---|---|---|---|---|---|---|---|---|
| Crude | Adjusted* † | Crude | Adjusted | |||||||||
| Mean/effect | 95% CI | P | Mean/effect | 95% CI | P | Mean/effect | 95% CI | P | Mean/effect | 95% CI | P | |
| Processing factors | ||||||||||||
| Filter | <.0001 | <.0001 | ||||||||||
| Fe-WBf | 477.3 | (324.5 to 630.0) | 73.4 | (–310.3 to 457.1) | ||||||||
| M-WBf | 1098.2 | (861.4 to 1329.8) | 16.0 | (–767.5 to 799.4) | ||||||||
| Fr-WBf | 1095.6 | (786.3 to 1410.0) | 4555.3 | (3967.0 to 5143.5) | ||||||||
| M-RBCf | 129.4 | (–456.8 to 715.6) | 33.5 | (–1439.2 to 1506.2) | ||||||||
| Fe-RBCf | 438.9 | (299.4 to 578.4) | 25.1 | (–325.3 to 375.5) | ||||||||
| Preparation time, h | 36.8 | (18.2 to 55.5) | <.001 | 25.4 | (6.2 to 44.6) | .01 | 119.2 | (67.5 to 171.0) | <.0001 | |||
| Product factors | ||||||||||||
| Storage time, d | 45.5 | (35.8 to 55.3) | <.0001 | 42.4 | (27.9 to 56.9) | <.0001 | 5.4 | (–23.5 to 34.2) | .7146 | |||
| Erythrocyte count, ×1012/L | 75.6 | (–80.0 to 231.1) | .34 | −381.2 | (–815.0 to 52.6) | .0849 | ||||||
| Platelet count, ×109/L | 6.2 | (3.0 to 9.5) | <.001 | 67.1 | (59.7 to 74.6) | <.0001 | 67.1 | (59.7 to 74.6) | <.0001 | |||
| Volume, mL | 3.7 | (–0.5 to 7.9) | .08 | 16.1 | (4.5 to 27.6) | .0067 | ||||||
| Donor factors | ||||||||||||
| Donor age, y | −1.3 | (–7.5 to 5.0) | .69 | 6.9 | (–10.5 to 24.3) | .44 | ||||||
| Donor sex | .20 | .01 | ||||||||||
| Female | 671.5 | (523.0 to 820.0) | 1128.3 | (716.0 to 1540.6) | ||||||||
| Male | 547.4 | (431.7 to 663.1) | 435.6 | (114.6 to 756.7) | ||||||||
| Blood group | <.0001 | <.001 | ||||||||||
| O | 509.7 | (378.0 to 641.4) | 638.2 | (270.0 to 1006.3) | ||||||||
| A | 558.3 | (426.2 to 690.5) | 439.1 | (69.7 to 808.5) | ||||||||
| B | 1273.8 | (911.9 to 1635.7) | 2748.4 | (1736.8 to 3760.0) | ||||||||
| AB | 1897.3 | (1032.1 to 2762.5) | 2574.4 | (156.2 to 4992.6) | ||||||||
| Rh(D) | .48 | .68 | ||||||||||
| Positive | 607.2 | (595.1 to 705.4) | 444.8 | (718.4 to 992.0) | ||||||||
| Negative | 510.4 | (333.4 to 759.9) | −135.6 | (559.8 to 1255.2) | ||||||||
| Erythrocyte count, ×1012/L | 224.8 | (–16.1 to 465.6) | .07 | 264.9 | (40.4 to 489.4) | .02 | −712.8 | (–1383.5 to −42.1) | .04 | |||
| White blood cell count, ×109/L | 6.0 | (–47.3 to 59.3) | .83 | 97.0 | (–51.4 to 245.3) | .20 | ||||||
Data are reported as mean (95% CI): marginal or predicted means for categorical variables and the predicted effect for a 1-unit change of the covariate for quantitative variables.
Interaction term between product platelet count and filter type was significant (P = .0003). Platelet count effect for filter type RZ2000, 126.6; LXT, 178.4; Fr, −104.8; NPT, 62.1; and OptiPure, 6.0.
Interaction term between donor blood group and storage time was significant (P = .0003). Storage time effect for blood group O, 0; A, −6.3; B, 27.3; and AB, 58.0.
For EEVs, 3 parameters affect their abundance: storage duration (P < .0001), time to RBC unit processing (P = .0001), and donor erythrocyte count (P = .02).
Focusing on subtypes of EV (size, PS, and CD47 expression) and preparation methods, we showed that these subpopulations are mostly affected in the same way as the total population, with the exception of small EEVs, which are not affected by the duration of preparation, unlike the total EEV population.
Discussion
Using data generated with a robust and standardized method of EV quantification,20 our study confirms that EV levels in RBC units are affected by preparation parameters at various stages, from blood donation to unit storage. The preparation method is a source of stress for cells, and a key step in RBC unit preparation is leukoreduction, occurring before or after RBC separation by centrifugation and decantation. We highlight the high impact of this step, with lower EV levels after RBCf than after WBf. This effect is mainly driven for PEVs by the Fr-WBf filter, which contrary to other filter types allows a considerable quantity of residual platelets to remain after leukoreduction, leading to greater PEV release. For EEVs, the predominant EVs in RBC units, RBCf units also contain fewer EEVs than WBf units (regardless of the erythrocyte counts in the 2 groups) indicating that RBCf (meaning filtration of RBCs after decantation) has less of an impact on EV release than WBf. Preparation duration, the time between blood donation and unit preparation, also seemed to affect EV levels in our study, particularly for WBf units; however, this result was strongly influenced by the nonrandom use of filters for leukoreduction and must be confirmed. Our findings are consistent with physical and biochemical analyses performed by others and summarized by Ning et al,22 showing differences in the amount or size of released EVs,15,18 hemolysis levels, and deformability of erythrocytes (and other parameters) according to the processing method used.
The current study also confirmed an increase in EEV levels during RBC unit storage, verifying that EV release is part of the storage lesion caused by oxidative stress23 or adenosine triphosphate decrease.24 The increase seems progressive, extending from the first to the last week of storage, meaning that EV release is permanent. Overall, the increase of 46 EEVs/µL per storage day in an entire unit of 280 mL would, on average, lead to an increase of 12.8 million EEVs per unit each storage day, highlighting the relevance of a comprehensive analysis of the clinical impact of these transfused EVs. Interestingly, the proportion of EEVs strongly expressing CD47 increased over storage time. CD47 is a key regulator of RBC homeostasis, preventing phagocytosis by macrophages. It is lost over the RBC life cycle, to favor senescent cell uptake.25,26 Because EVs enable RBC to shed undesirable, altered, or harmful material,27 more in-depth studies are needed to determine if the CD47 increase on EV is an indication of physiological RBC senescence or a sign of stress, and to evaluate clinical outcomes in recipients of the combination of RBC that have lost CD47 and CD47high EVs.
Studies have suggested effects of donor age and sex on the recovery and biochemistry of RBCs,28 as well as on transfusion outcomes,28,29 although these results are the subject of debate.30 Our data did not reveal any significant differences in EV counts dependent on age or sex, suggesting that if the impact of age and sex on transfusion outcomes is real, it is unlikely to be mediated by EV concentrations. We found differences in PEV and EEV concentrations across donor ABO groups. In multivariate analysis, differences in EEV levels seemed to be explained by differing effects of storage in the various blood groups, with B and AB donor units appearing to be most affected by storage. This tentative finding may need to be confirmed in a larger cohort, because for this analysis, we focused on only 264 RBC units, and many other factors may be implicated in EV variation (genetic profiles, obesity,31 metabolic syndrome,32 activity levels, or other unexplored factors).33
Our study has several limitations. Flow cytometry is a low-cost analysis method, and although highly reproducible,20 it does not detect very small EVs (<0.3µm) and likely underestimated EV quantities. Moreover, our method did not encompass leukocyte-derived, endothelial-derived, or uncharacterized EVs in packed RBCs.
Advances in biological knowledge about EVs and parameters that induce their generation in packed RBC units should improve bioclinical approaches to personalized transfusion. The procoagulant properties of a transfusion product may be desirable in cases of massive hemorrhage but not in patients with high cardiovascular risk. EVs are likely to be involved in transfusion-related immunomodulation, and their potential proliferative effects on tumors might be considered for patients with cancer. Beyond these considerations, the origin, number, and activities of EVs might be taken into account in transfusion products. Our work provides information on how to reduce and measure microparticles in blood products.
In conclusion, our study found that donor factors, processing methods, and storage duration contribute to EV variations in RBC units, leading to large variations in EV quantities received by patients. The respective contributions of these parameters seem to differ for PEVs and EEVs. Some of these factors may be easily standardized in future transfusion practice. Understanding the relationship between these factors and EV content and composition in transfusion products might be relevant in clinical practice, as transfused EVs may be deleterious or beneficial for patients, depending on the clinical context. The possibility of determining the precise profile of EVs in blood products opens a path to a more personalized transfusion medicine in which the properties of the products transfused are precisely matched to patient needs.
Requests for data sharing may be submitted to the corresponding author (Francine Garnache-Ottou; e-mail: francine.garnache@efs.sante.fr).
Acknowledgments
The authors thank all members of the preparation and distribution service of the EFS Bourgogne Franche-Comté, EFS Auvergne Rhone-Alpes, EFS Grand-Est, EFS Hauts de France/Normandie, EFS Occitanie Pyrénées/Méditerrannée, EFS Provence–Alpes Côte d’Azur/Corse, and EFS Ile de France, as well as F. Schillinger, the technicians from the cytology laboratory, and the Plateforme de Biomonitoring (EFS Bourgogne Franche-Comté) for their valuable collaboration. The authors also thank Franck Leroux, Lucie Vettoretti, Laurent Sanseigne, Jean Pierre Bequart, Pascale LeNet, Mohamed Slimane, and Sophie Depierre for their help in collecting data.
This work was supported by grants from the Programme Hospitalier de Recherche Clinique 2013 (PHRCN13299328N) and EFS National 2011 (2011-11).
Authorship
Contribution: C.G., S.B., and S.A. performed laboratory investigations and collected data; C.L., A.F., E.R., F.B., L.B., C.N., and N.M. collected RBC units; C.G., M.D., G.M., D.B., and C.V. designed the statistical analysis and interpreted data; F.G.-O., G.C., and J.L. designed the study; M.D., C.G., and F.G.-O. wrote the manuscript with the help of F.A.D., P.S., P.M., P.T., and J.L.; and all authors reviewed and approved the manuscript.
Conflict-of-interest disclosure: The authors declare no competing financial interests.
Correspondence: Francine Garnache-Ottou, University Bourgogne Franche-Comté, INSERM, Etablissement Français du sang Bourgogne Franche Comté, Unité Mixte de Recherche 1098, Interactions Hôte-Greffon-Tumeur, Ingénierie Cellulaire et Génique, 8 rue Dr JFX Girod, 25000 Besançon, France; e-mail: francine.garnache@efs.sante.fr.

