

Key Points
LSCs in AML and CML express a unique phenotype, including aberrantly expressed surface markers and target antigens.
Antibody-based targeted immunotherapy is able to eliminate LSCs in in vitro assays and to suppress in vivo engraftment of LSCs in NSG mice.

Abstract
In an attempt to identify novel markers and immunological targets in leukemic stem cells (LSCs) in acute myeloid leukemia (AML) and chronic myeloid leukemia (CML), we screened bone marrow (BM) samples from patients with AML (n = 274) or CML (n = 97) and controls (n = 288) for expression of cell membrane antigens on CD34+/CD38− and CD34+/CD38+ cells by multicolor flow cytometry. In addition, we established messenger RNA expression profiles in purified sorted CD34+/CD38− and CD34+/CD38+ cells using gene array and quantitative polymerase chain reaction. Aberrantly expressed markers were identified in all cohorts. In CML, CD34+/CD38− LSCs exhibited an almost invariable aberration profile, defined as CD25+/CD26+/CD56+/CD93+/IL-1RAP+. By contrast, in patients with AML, CD34+/CD38− cells variably expressed “aberrant” membrane antigens, including CD25 (48%), CD96 (40%), CD371 (CLL-1; 68%), and IL-1RAP (65%). With the exception of a subgroup of FLT3 internal tandem duplication–mutated patients, AML LSCs did not exhibit CD26. All other surface markers and target antigens detected on AML and/or CML LSCs, including CD33, CD44, CD47, CD52, CD105, CD114, CD117, CD133, CD135, CD184, and roundabout-4, were also found on normal BM stem cells. However, several of these surface targets, including CD25, CD33, and CD123, were expressed at higher levels on CD34+/CD38− LSCs compared with normal BM stem cells. Moreover, antibody-mediated immunological targeting through CD33 or CD52 resulted in LSC depletion in vitro and a substantially reduced LSC engraftment in NOD.Cg-PrkdcscidIl2rgtm1Wjl/SzJ (NSG) mice. Together, we have established surface marker and target expression profiles of AML LSCs and CML LSCs, which should facilitate LSC enrichment, diagnostic LSC phenotyping, and development of LSC-eradicating immunotherapies.
Introduction
Acute myeloid leukemia (AML) and chronic myeloid leukemia (CML) are stem cell–derived malignancies. The course and prognosis vary among patients, depending on the variant and phase of disease, molecular properties, and responses to therapy.1-5 Using intensive chemotherapy in AML and BCR-ABL1–targeting drugs in CML, a substantial number of patients enter long-term disease-free survival.4-8 However, not all patients show a response to antileukemic drugs, or they relapse after a certain time interval.6-8 For patients with resistant disease, allogeneic hematopoietic stem cell transplantation (SCT) may be considered. However, SCT can only be offered to a subset of “young” and fit patients. Therefore, current efforts focus on new targets and the development of more effective drug therapies.
The concept of leukemic stem cells (LSCs) was introduced to explain cellular and molecular hierarchies and to improve antileukemic treatments through eradication of disease-initiating and disease-propagating cells.9-17 Based on the LSC theory, leukemic (sub)clones are organized hierarchically, with (1) more mature cells that enter an apoptotic state after a number of cell divisions and (2) LSCs that replenish the bulk of leukemic cells by their unlimited self-renewing and, thus, leukemia-propagating capacity.9-11 In chronic-phase CML and some AML variants, LSCs are considered to reside within a CD34+/CD38− cell fraction.9-15 However, depending on the nature and phase of disease, at least some LSCs may also reside in CD34+/CD38+ subsets or sometimes even in CD34− subfractions.18-20 Because of their disease-propagating ability, LSCs are regarded as major targets of therapy, and numerous studies have been initiated to identify molecular targets in these cells.13-17,21-29 Of special interest are specific surface molecules that can be used to design disease-eradicating immunotherapies, such as chimeric antigen receptor T-cell–based therapies. However, only a few clinically relevant targets expressed specifically on LSCs have been identified,21-29 and there is an unmet need to identify new LSC markers that can be used for diagnostic or prognostic purposes or can be developed as molecular targets of therapy.
We compared surface marker and target expression profiles of LSCs in AML and CML. Moreover, we compared LSC phenotypes with marker expression profiles of hematopoietic stem cells (HSCs) obtained from normal bone marrow (BM) or cord blood (CB). In the validation phase, larger series of patients were examined. In addition, we applied targeted drugs to define their LSC-depleting ability.
Patients and methods
Monoclonal antibodies and other reagents
Reagents are described in supplemental Patients and methods. A description of antibodies (n = 93) is shown in supplemental Table 1.
Patients and isolation of cells
A total of 878 BM or blood samples from 274 patients with AML, 97 patients with CML, and 288 controls were examined. Diagnoses were established according to the criteria of the French-American-British cooperative study group (FAB) and the World Health Organization (WHO).30-34 Patients' characteristics are shown in Table 1 and in supplemental Tables 2 through 5. During follow-up, relapse and overall survival (OS) were recorded. We also examined 58 patients with myelodysplastic syndromes (MDS) and 23 with myelodysplastic/myeloproliferative overlap neoplasms (MDS/MPN). Control BM cells were purchased (normal BM, n = 17; Lonza, Basel, Switzerland) or obtained from subjects with idiopathic cytopenia of undetermined significance (ICUS) (n = 40), suspected hematologic neoplasm (n = 24), AML or CML in remission (n = 53) or lymphoma (n = 98) (supplemental Table 5). In addition, CB samples (n = 26) were examined. The study was approved by the ethics committee of the Medical University of Vienna.
Overview of AML and CML patients' characteristics
| Diagnosis | FAB subtype | n | Female/male, n | Median age, y | Median WBC, ×109/L | BM/PB samples, n |
|---|---|---|---|---|---|---|
| AML | M0 | 19 | 8/11 | 69 | 2.4 | 26/0 |
| AML | M1 | 56 | 29/27 | 62 | 12.4 | 72/4 |
| AML | M2 | 67 | 29/38 | 62 | 6.7 | 90/4 |
| AML | M3 | 12 | 5/7 | 46 | 5.7 | 16/1 |
| AML | M4/M4eo | 64 | 28/36 | 58 | 34.9 | 87/4 |
| AML | M5a/M5b | 16 | 8/8 | 61 | 30.8 | 22/4 |
| AML | M6 | 9 | 4/5 | 71 | 3.6 | 12/1 |
| AML | n.a. | 31 | 10/21 | 63 | 2.2 | 32/6 |
| AML (all) | n.a. | 274 | 121/153 | 63 | 10.3 | 357/24 |
| CML CP | n.a. | 80 | 38/42 | 56 | 58.5 | 118/53 |
| CML AP | n.a. | 9 | 4/5 | 65 | 178.3 | 7/9 |
| CML BP | n.a. | 8 | 5/3 | 48 | 57.8 | 5/10 |
| CML (all) | n.a. | 97 | 47/50 | 55 | 61.2 | 130/72 |
AP, accelerated phase; BP, blast phase; CP, chronic phase; n.a., not available/applicable; PB, peripheral blood; WBC, white blood cell count.
Multicolor flow cytometry and sorting of LSCs
Stem and progenitor cells were analyzed for the expression of cell membrane antigens by multicolor flow cytometry, as reported.24,35,36 A detailed description of the staining techniques is provided in supplemental Patients and methods. In 21 patients with AML, 7 with CML, and 10 controls (normal BM, n = 6; CB, n = 4), CD34+/CD38− cells and CD34+/CD38+ cells were purified to homogeneity from mononuclear cells (MNCs) using monoclonal antibodies and cell sorting on a FACSAria (BD Biosciences), as reported.24,37-39 The gating strategy is shown in supplemental Figure 1. The purity of sorted cells was >95%. Purified cells were subjected to functional analyses or RNA isolation, followed by quantitative polymerase chain reaction (qPCR) and/or gene array studies.
Gene array analyses, karyotyping, and qPCR
To investigate marker/target expression, qPCR was performed on RNA samples from unfractionated MNCs (data not shown) or sorted CD34+/CD38− and CD34+/CD38+ cells (AML, n = 14; CML, n = 4; normal BM, n = 3; CB, n = 4; all leukemic samples were obtained at initial diagnosis), using the primers depicted in supplemental Table 6. ABL1 served as a reference gene.24,39 Technical details are provided in supplemental Patients and methods. Gene array analyses were performed on RNA samples derived from purified stem and progenitor cells (AML, CML, normal BM; initial diagnosis) using Affymetrix technology, as reported.40,41 Conventional karyotyping and fluorescence in situ hybridization (FISH) were performed according to published techniques.24,35,42 In a subset of AML patients (n = 7), unfractionated MNCs or purified CD34+/CD38− and CD34+/CD38+ cells were analyzed by FISH using gene-specific probes (supplemental Tables 7 and 8).
Incubation of cells with cytokines and targeted drugs, and evaluation of proliferation, apoptosis and cell surface marker expression
To define the functional role of cytokine receptors and target antigens, enriched LSCs or MNCs were incubated with recombinant cytokines, including granulocyte colony-stimulating factor (G-CSF), stem cell factor (SCF), interleukin-2 (IL-2), IL-3, erythropoietin (EPO), or SLIT2, or with targeted drugs, including denileukin diftitox (IL-2–diphtheria toxin conjugate), gemtuzumab/ozogamicin (GO; anti-CD33), the multitargeted FLT3/KIT blocker midostaurin, the FLT3-targeting drug gilteritinib, or alemtuzumab (anti-CD52). After incubation, cell viability, proliferation, and/or surface marker expression were analyzed. Technical details are provided in supplemental Patients and methods.
Engraftment of leukemic cells in NSG mice
Xenotransplantation studies were performed using irradiated NOD.Cg-PrkdcscidIl2rgtm1Wjl/SzJ (NSG) mice, essentially as described.24,35,38 Details are described in supplemental Patients and methods. All animal studies were approved by the ethics committee of the University of Veterinary Medicine Vienna and carried out in accordance with guidelines for animal care and protection and protocols approved by Austrian law (BMWFW-68.205/0050-WF/V/3b/2015).
Statistical analyses
Statistical analyses applied in this study are described in supplemental Patients and methods.
Results
Phenotype of normal BM HSCs and CB HSCs
CD34+/CD38− HSCs obtained from normal/reactive BM or remission BM samples (AML/CML) expressed an almost identical phenotype. These cells expressed CD43, CD44, CD90, CD105, CD114, CD117, CD133, CD135, and roundabout-4 (ROBO4) (Table 2; supplemental Table 9; supplemental Flow cytometric analyses). BM HSCs expressed lower levels of CD33, CD123, and HLA-DR than did CB HSCs (supplemental Table 10). BM HSCs did not exhibit CD26, CD96, CD243, CD271, or CD309 (Figure 1; Table 2; supplemental Table 9). BM HSCs also stained negative for CLL-1 and interleukin-1 receptor-associated protein (IL-1RAP) (Figure 1; Table 2). In a few control samples, HSCs stained slightly positive for CD25, CD56, CD93, and/or CD221. Unexpectedly, CB HSCs expressed several markers that were also detectable on LSCs, including CD93, CD123, and IL-1RAP (supplemental Figure 2; supplemental Table 10). IGF-1R (CD221) was expressed on CB HSCs, but it was displayed only weakly or not at all on BM HSCs and LSCs (supplemental Tables 9 and 10). The phenotype of normal CD34+/CD38+ BM progenitor cells was found to differ from that of BM HSCs. BM progenitors expressed higher levels of CD18, CD371, and HLA-DR and lower amounts of CD90 and ROBO4 compared with BM HSCs (Figure 1; supplemental Table 11). Furthermore, BM progenitors expressed slightly higher levels of IL-1RAP than did BM HSCs (Figure 1; Table 2; supplemental Table 11). During validation, we also examined the expression of several surface antigens in mature leukocytes obtained from healthy donors. A summary of these results is shown in supplemental Table 12.
Expression of novel and established stem cell antigens and lineage-related markers on leukemic stem and progenitor cells and comparison with normal BM cells
| Antigen | CD | Normal control BM | AML | CML | |||
|---|---|---|---|---|---|---|---|
| CD34+/CD38+ | CD34+/CD38− | CD34+/CD38+ | CD34+/CD38− | CD34+/CD38+ | CD34+/CD38− | ||
| ROBO4 | n.c. | +/− (50) | + (100) | − (5) | −/+ (29) | − (7) | + (85) |
| IL-1RAP | n.c. | −/+ (36) | − (0) | + (79) | + (65) | + (95) | + (77) |
| IL-2RA | CD25 | − (12) | − (8) | + (43) | + (48) | +/− (28) | + (93) |
| DPPIV | CD26 | − (0) | − (0) | −/+ (8) | −/+ (10) | +/− (30) | + (97) |
| Leukosialin | CD43 | + (100) | + (100) | + (100) | + (100) | + (100) | + (100) |
| Pgp-1 | CD44 | + (100) | + (100) | + (98) | + (98) | + (100) | + (100) |
| LCA | CD45 | + (100) | + (100) | + (100) | + (100) | + (100) | + (100) |
| NCAM1 | CD56 | − (8) | − (8) | −/+ (26) | −/+ (18) | +/− (55) | + (91) |
| Thy1 | CD90 | −/+ (8) | + (85) | − (4) | −/+ (13) | +/− (55) | + (91) |
| MXRA4 | CD93 | +/− (75) | +/− (63) | + (81) | + (72) | +/− (71) | + (86) |
| TACTILE | CD96 | − (0) | − (0) | + (51) | + (40) | − (9) | − (0) |
| AC133 | CD133 | + (100) | + (100) | + (86) | + (88) | +/− (72) | + (89) |
| OX40 | CD134 | − (0) | − (0) | − (8) | − (6) | − (0) | − (0) |
| SLAMF1 | CD150 | − (0) | − (0) | − (3) | − (0) | − (0) | − (0) |
| BST1 | CD157 | + (90) | + (90) | + (85) | + (74) | + (100) | + (100) |
| CXCR4 | CD184 | + (68) | + (55) | + (75) | + (72) | + (82) | + (82) |
| E-NPP3 | CD203c | − (0) | − (0) | − (0) | − (0) | − (11) | − (0) |
| MDR1 | CD243 | − (10) | − (0) | − (6) | − (10) | − (3) | − (7) |
| OX40L | CD252 | − (0) | − (0) | − (0) | − (0) | −/+ (33) | −/+ (33) |
| CLL-1 | CD371 | + (100) | − (0) | + (92) | + (68) | + (67) | − (17) |
Expression of surface antigens on CD34+/CD38−and CD34+/CD38+ BM stem and progenitor cells was examined by multicolor flow cytometry. All leukemic samples were obtained at diagnosis (AML: ≥7 cases per marker tested; CML: ≥6 cases per marker tested). Control samples (normal BM; ≥5 cases per marker tested) included purchased CD34+ BM cell subsets and BM cells obtained from cases with suspected hematologic neoplasm without persistent cytopenia. Results show the levels of expression of surface markers (as per the score defined below) and as the percentage of positive cases in each group (in parentheses). Score of antibody reactivity: +, clear expression in majority of cases; +/−, weak expression in majority of cases; −/+, expression in minority of cases; −, no expression in a vast majority of cases.
BST1, BM stromal cell antigen 1; DPPIV, dipeptidyl peptidase IV; E-NPP3, ectonucleotide pyrophosphatase/phosphodiesterase 3; LCA, leukocyte common antigen; MDR1, multidrug resistance gene 1; n.c., not yet clustered; OX40L, OX40 ligand; Thy1, thymocyte antigen 1.
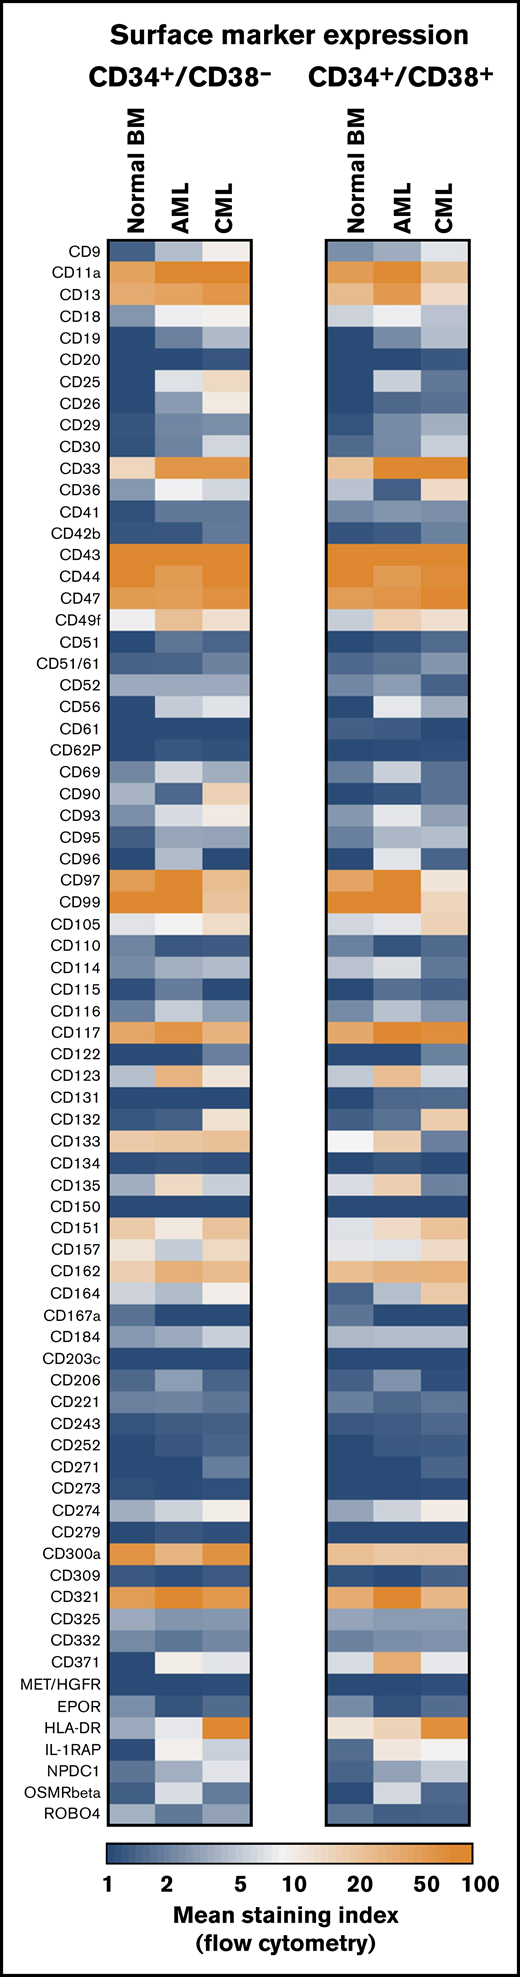
Antigen expression patterns of stem and progenitor cells. Expression of cell surface antigens on CD34+/CD38− stem cells and CD34+/CD38+ progenitor cells obtained from normal BM or from patients with AML or CML (all samples obtained at diagnosis). A total of 239 patients with AML (range, 3-172 per marker; median, 29 per marker), 81 patients with CML (range, 3-73 per marker; median, 17 per marker), and 36 normal BM samples (range, 3-25 per maker; median, 8 per marker) were analyzed. Surface expression was analyzed by multicolor flow cytometry as described in supplemental Flow cytometric analysis. Results are expressed as mean of all donors and represent the staining index, which was calculated from median fluorescence intensities that were obtained with the test antibodies and isotype-matched control antibodies.
Antigen expression patterns of stem and progenitor cells. Expression of cell surface antigens on CD34+/CD38− stem cells and CD34+/CD38+ progenitor cells obtained from normal BM or from patients with AML or CML (all samples obtained at diagnosis). A total of 239 patients with AML (range, 3-172 per marker; median, 29 per marker), 81 patients with CML (range, 3-73 per marker; median, 17 per marker), and 36 normal BM samples (range, 3-25 per maker; median, 8 per marker) were analyzed. Surface expression was analyzed by multicolor flow cytometry as described in supplemental Flow cytometric analysis. Results are expressed as mean of all donors and represent the staining index, which was calculated from median fluorescence intensities that were obtained with the test antibodies and isotype-matched control antibodies.
Identification of LSC markers and targets in gene array and qPCR analyses
In the screen phase, we identified potential markers and targets in LSCs by combined gene array, qPCR, and flow cytometry analyses. Antigens that were detectable in LSC not only by gene array and/or qPCR analyses, but also on the surface of LSC by antibody staining were CD9, CD25, CD26, CD33, CD36, CD44, CD47, CD52, CD56, CD90, CD96, CD105, CD114, CD116, CD117, CD123, CD164, CD184, IL-1RAP, CLL-1 (CD371), and ROBO4. Several of these antigens were found to be expressed at higher levels on CML and/or AML LSCs compared with BM HSCs (Figures 1 and 2; Table 2; supplemental Figure 3A; supplemental Table 13A). Other markers, such as ROBO4, were found to be expressed at higher levels on HSCs or LSCs compared with (normal or neoplastic) CD34+/CD38+ progenitors (Table 2). Gene array data are shown in Figure 2 (transcripts specific for surface proteins), supplemental Figure 3A (top-regulated genes regardless of cellular localization), and supplemental Figure 3B-C (CD molecules); qPCR data are shown in supplemental Table 13B. In the patients in whom LSCs were examined by microarray studies, surface expression of target antigens was confirmed by flow cytometry (supplemental Table 14A-B). In a subset of patients, the clonal origin of LSCs was verified by FISH using fusion gene-specific probes (supplemental Tables 7 and 8).

Microarray analyses of CD34+/CD38−LSCs. Microarray analyses were performed on RNA from highly purified (sorted) CD34+/CD38− AML LSCs (A) and CML LSCs (B), as described in supplemental Patients and methods. All samples were obtained at diagnosis. The heat maps show the 50 top upregulated genes (left panels, A-B) and the 50 top downregulated genes (right panels, A-B) encoding accessible surface molecules in CD34+/CD38− cells in 3 patients with AML (patients #102, #173, and #210) and 3 patients with CML (patients #8, #11, and #21) compared with normal BM stem cells. Relative expression levels of messenger RNA (normalized to normal BM stem cells) are defined by the color score (log2 fold changes), as indicated. Patient numbers refer to the patient numbers shown in supplemental Tables 2 and 3.
Microarray analyses of CD34+/CD38−LSCs. Microarray analyses were performed on RNA from highly purified (sorted) CD34+/CD38− AML LSCs (A) and CML LSCs (B), as described in supplemental Patients and methods. All samples were obtained at diagnosis. The heat maps show the 50 top upregulated genes (left panels, A-B) and the 50 top downregulated genes (right panels, A-B) encoding accessible surface molecules in CD34+/CD38− cells in 3 patients with AML (patients #102, #173, and #210) and 3 patients with CML (patients #8, #11, and #21) compared with normal BM stem cells. Relative expression levels of messenger RNA (normalized to normal BM stem cells) are defined by the color score (log2 fold changes), as indicated. Patient numbers refer to the patient numbers shown in supplemental Tables 2 and 3.
AML and CML LSCs express a unique profile of surface antigens
In the validation phase of our project, larger series of patient samples were examined by flow cytometry. Most surface markers detected on AML LSCs and/or CML LSCs were also found to be expressed on HSCs. However, in a substantial number (percentage) of patients with AML, CD34+/CD38− LSCs expressed ≥1 of the following antigens in an aberrant manner: CD9 (63% of patients), CD25 (48%), CD69 (86%), CD93 (72%), CD96 (40%), CD371/CLL-1 (68%), and IL-1RAP (65%) (Figure 1; Table 2; supplemental Table 13A). As expected, AML LSCs expressed higher levels of CD33 and CD123 compared with HSCs. By contrast, AML LSCs expressed lower levels of CD157 compared with BM HSCs and, in a majority of the patients tested, CD26 and CD90 (Thy-1) were not detectable on AML LSCs (Figure 1; Table 2). CML LSCs expressed CD25, CD26, and IL-1RAP in an aberrant manner in almost all patients (Figure 1; Table 2), confirming previous studies.23,24,43 Moreover, we identified CD56 and CD93 as novel aberrant markers on CML LSCs (Figure 1; Table 2; supplemental Table 13A). Unlike CD56, CD93 and IL-1RAP were also detectable on AML LSCs. Compared with BM HSCs, CML LSCs expressed higher levels of CD9, CD33, CD123, and HLA-DR (Figure 1; supplemental Table 13A). ROBO4 was expressed on LSCs in most CML patients, whereas AML LSCs expressed only low levels or no detectable ROBO4 (Figure 1; Table 2; supplemental Figure 4).
Correlation between LSC marker profiles and AML variants
When comparing aberrant surface antigens in various AML groups, no definitive correlation with a FAB or WHO variant was found. However, certain marker combinations were found to correlate with the FLT3 mutation status. In particular, in a subset of patients with FLT3 internal tandem duplication (ITD)+ AML (40%), LSCs displayed CD26, whereas in AML cases without FLT3 ITD, CD26 was not detectable on LSCs (Figure 3A). We also found that the strong and rather specific FLT3 inhibitor gilteritinib downregulates expression of CD26 on LSCs in patients with FLT3 ITD+ AML (supplemental Figure 5). Moreover, in most patients with FLT3 ITD+ AML (76%), LSCs expressed CD25, whereas in AML patients with wild-type (wt) FLT3, LSCs expressed CD25 in only 38% of the cases (P < .05) (Figure 3B). There was also a rough correlation between CD25/CD26 expression on AML LSCs and the NPM1 mutation status (NPM1-mutated AML: 60% CD25+ LSCs and 26% CD26+ LSCs; NPM1 wt AML: 43% CD25+ LSCs and 5% CD26+ LSCs). We also found that LSCs in FLT3 ITD+ AML display higher levels of CD33, CD123, and IL-1RAP and lower levels of CD117 compared with AML patients with FLT3 wt (supplemental Table 15). Correlations between LSC phenotypes and disease-related cytogenetic or molecular markers are shown in supplemental Tables 15 through 17.
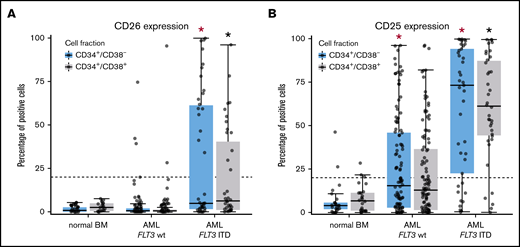
Differential expression of CD25 and CD26 on CD34+/CD38−AML LSCs. (A) Expression of CD26 on CD34+/CD38− cells (blue boxes) and CD34+/CD38+ cells (gray boxes) in 22 patients with normal BM, 115 patients with FLT3 wt, and 40 AML patients exhibiting FLT3 ITD (mutated). Samples were obtained at diagnosis or relapse. Cells were stained with antibodies against CD26, CD34, CD38, and CD45 by multicolor flow cytometry, as described in supplemental Patients and methods. Results represent the percentage of CD26+ cells in each donor. The median percentage of positive cells in all donors in each group are shown as horizontal lines. The dotted line represents clear expression (>20% positive cells). The range of each box represents the 25th to 75th percentiles. The difference in the percentage of CD26+ cells in the 2 groups of AML donors tested was significant (P < .001, Wilcoxon rank-sum test). Corresponding results were obtained when comparing expression levels (defined as stimulation index) in the 2 groups of patients (data not shown). (B) Staining results obtained with an antibody against CD25 in normal BM (n = 25), in patients with FLT3 wt AML (n = 115), and in patients with FLT3 ITD AML (n = 39; diagnostic or relapse samples). In a majority of the patients, CD34+/CD38− LSCs (blue boxes) and CD34+/CD38+ progenitor cells (gray boxes) stained positive for CD25 in AML patients exhibiting FLT3 ITD, whereas cells failed to stain positive in most patients with AML exhibiting wt FLT3. Red asterisk (*): P < .05 vs normal CD34+/CD38− BM cells; black asterisk (*): P < .05 vs normal CD34+/CD38+ BM cells.
Differential expression of CD25 and CD26 on CD34+/CD38−AML LSCs. (A) Expression of CD26 on CD34+/CD38− cells (blue boxes) and CD34+/CD38+ cells (gray boxes) in 22 patients with normal BM, 115 patients with FLT3 wt, and 40 AML patients exhibiting FLT3 ITD (mutated). Samples were obtained at diagnosis or relapse. Cells were stained with antibodies against CD26, CD34, CD38, and CD45 by multicolor flow cytometry, as described in supplemental Patients and methods. Results represent the percentage of CD26+ cells in each donor. The median percentage of positive cells in all donors in each group are shown as horizontal lines. The dotted line represents clear expression (>20% positive cells). The range of each box represents the 25th to 75th percentiles. The difference in the percentage of CD26+ cells in the 2 groups of AML donors tested was significant (P < .001, Wilcoxon rank-sum test). Corresponding results were obtained when comparing expression levels (defined as stimulation index) in the 2 groups of patients (data not shown). (B) Staining results obtained with an antibody against CD25 in normal BM (n = 25), in patients with FLT3 wt AML (n = 115), and in patients with FLT3 ITD AML (n = 39; diagnostic or relapse samples). In a majority of the patients, CD34+/CD38− LSCs (blue boxes) and CD34+/CD38+ progenitor cells (gray boxes) stained positive for CD25 in AML patients exhibiting FLT3 ITD, whereas cells failed to stain positive in most patients with AML exhibiting wt FLT3. Red asterisk (*): P < .05 vs normal CD34+/CD38− BM cells; black asterisk (*): P < .05 vs normal CD34+/CD38+ BM cells.
LSCs express receptors for hematopoietic cytokines and niche-related ligands
In most AML patients, LSCs expressed G-CSF receptor (G-CSFR)/CD114, SCFR=KIT/CD117, IL-3RA/CD123, and FLT3/CD135. In a subset of patients, LSCs expressed ≥1 of the following cytokine receptors: IL-2 receptor α chain (IL-2RA)/CD25 (in 48%), macrophage colony-stimulating factor receptor/CD115 (in 17%), granulocyte-macrophage colony-stimulating factor receptor (GM-CSFR)/CD116 (in 47%), IGF-1R/CD221 (in 18%), and FGFR2/CD332 (in 33%) (Figure 4A; supplemental Figure 3B; supplemental Table 9A). In CML, LSCs displayed IL-2RA, G-CSFR, KIT, and IL-3RA in most patients (>75%). In ∼40% of all cases, CML LSCs displayed FGFR2/CD332. CML and AML LSCs expressed higher levels of G-CSFR and IL-3RA compared with BM HSCs (Figure 4A; supplemental Figure 3B; supplemental Table 13A). NGFR/CD271 and VEGFR2/CD309 were not detectable on LSCs (supplemental Table 9A). Calculated expression levels (sites per cell) of cytokine receptors based on flow cytometry staining results are shown in supplemental Table 9B. In a subset of patients, we purified LSCs and examined cytokine effects on these cells. We found that G-CSF and SCF promote proliferation and survival in LSCs (Figure 4B-C; supplemental Figure 6). By contrast, IL-2 and the ROBO4 ligand SLIT2 did not induce growth or survival in LSCs (data not shown); the same was found with EPO (supplemental Figure 6). Several receptors involved in LSC-niche interactions and LSC homing were detected on AML and CML LSCs, including CD44, KIT, CXCR4/CD184, and CD105 (Table 2; supplemental Tables 9A and 13A).
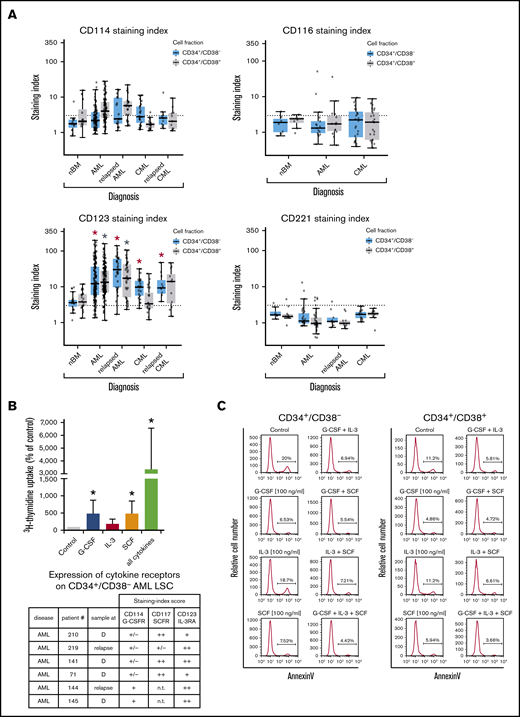
Expression of cytokine receptors on LSCs and effects of cytokine ligands. (A) Expression of surface antigens on CD34+/CD38− cells and CD34+/CD38+ cells in patients with AML, CML (at diagnosis and relapse), and normal donors (nBM). Cells were stained with antibodies against CD114 (G-CSFR), CD116 (GM-CSFR), CD123 (IL-3RA), and CD221 (IGF-1R), and marker expression on CD34+/CD38− and CD34+/CD38+ cells was determined by multicolor flow cytometry. The dotted line represents clear expression (staining index > 3). The range of each box represents the 25th to 75th percentiles. The middle line inside the boxes represents the median expression level. Red asterisk (*): P < .05 vs normal CD34+/CD38− BM cells; gray asterisk: P < .05 vs normal CD34+/CD38+ BM cells. Pairwise Wilcoxon test and P values were adjusted for multiple comparisons using the Benjamini-Hochberg procedure. (B) Highly purified CD34+/CD38− AML LSCs (from patients at diagnosis or relapse) were incubated in control medium (n = 5) or in G-CSF (n = 4), IL-3 (n = 4), SCF (n = 4), or a combination of all cytokines (n = 5) (100 ng/mL each) for 48 hours at 37°C. Then, uptake of 3H-thymidine was measured. Results are expressed as percentage of control (100%) and show the mean ± standard deviation (SD) of 4 or 5 experiments. *P < .05 vs control. The table shows the expression of cytokine receptors CD114 (G-CSFR), CD117 (SCFR), and CD123 (IL-3RA) on CD34+/CD38− LSCs used in these experiments. Results are expressed as staining index (SI), as described in supplemental Patients and methods, and were graded using the following score: −, SI = 0 to 1.3; +/−, SI = 1.31 to 3; +, SI = 3.01 to 10; ++, SI > 10. Patient numbers (#) refer to those defined in supplemental Table 3. (C) AML MNCs were incubated in control medium or in G-CSF, IL-3, SCF, or a combination (100 ng/mL each) at 37°C for 48 hours. Then, apoptosis was determined in CD34+/CD38− and CD34+/CD38+ cells by annexin V/4′,6-diamidino-2-phenylindole (DAPI) staining by multicolor flow cytometry, as described in supplemental Patients and methods. D, diagnosis; n.t., not tested.
Expression of cytokine receptors on LSCs and effects of cytokine ligands. (A) Expression of surface antigens on CD34+/CD38− cells and CD34+/CD38+ cells in patients with AML, CML (at diagnosis and relapse), and normal donors (nBM). Cells were stained with antibodies against CD114 (G-CSFR), CD116 (GM-CSFR), CD123 (IL-3RA), and CD221 (IGF-1R), and marker expression on CD34+/CD38− and CD34+/CD38+ cells was determined by multicolor flow cytometry. The dotted line represents clear expression (staining index > 3). The range of each box represents the 25th to 75th percentiles. The middle line inside the boxes represents the median expression level. Red asterisk (*): P < .05 vs normal CD34+/CD38− BM cells; gray asterisk: P < .05 vs normal CD34+/CD38+ BM cells. Pairwise Wilcoxon test and P values were adjusted for multiple comparisons using the Benjamini-Hochberg procedure. (B) Highly purified CD34+/CD38− AML LSCs (from patients at diagnosis or relapse) were incubated in control medium (n = 5) or in G-CSF (n = 4), IL-3 (n = 4), SCF (n = 4), or a combination of all cytokines (n = 5) (100 ng/mL each) for 48 hours at 37°C. Then, uptake of 3H-thymidine was measured. Results are expressed as percentage of control (100%) and show the mean ± standard deviation (SD) of 4 or 5 experiments. *P < .05 vs control. The table shows the expression of cytokine receptors CD114 (G-CSFR), CD117 (SCFR), and CD123 (IL-3RA) on CD34+/CD38− LSCs used in these experiments. Results are expressed as staining index (SI), as described in supplemental Patients and methods, and were graded using the following score: −, SI = 0 to 1.3; +/−, SI = 1.31 to 3; +, SI = 3.01 to 10; ++, SI > 10. Patient numbers (#) refer to those defined in supplemental Table 3. (C) AML MNCs were incubated in control medium or in G-CSF, IL-3, SCF, or a combination (100 ng/mL each) at 37°C for 48 hours. Then, apoptosis was determined in CD34+/CD38− and CD34+/CD38+ cells by annexin V/4′,6-diamidino-2-phenylindole (DAPI) staining by multicolor flow cytometry, as described in supplemental Patients and methods. D, diagnosis; n.t., not tested.
Finally, we compared LSC phenotypes at diagnosis with LSC phenotypes at relapse. We found that AML LSCs express higher levels of CD123 at the time of relapse compared with diagnosis (P < .05) (Figure 4A; supplemental Figure 7A). In CML patients, LSCs were found to display lower levels of ROBO4 at relapse compared with diagnosis (P < .05) (supplemental Figures 4 and 7B). In some AML patients, we also observed an increase in the expression of CD25 and/or IL-1RAP on LSCs when comparing diagnostic samples with relapse in these donors (supplemental Figure 8). No other differences were found when comparing target expression profiles of LSCs in AML or CML at diagnosis and relapse (Figures 4A and 5A; supplemental Flow cytometric analysis).
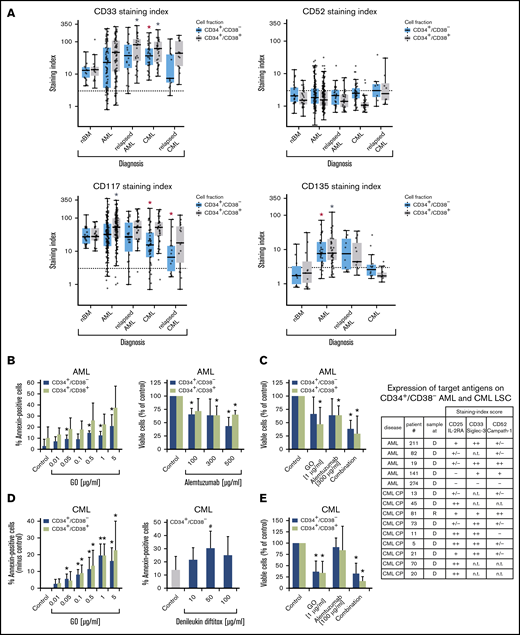
Expression of surface targets and effects of targeted drugs. (A) Expression of surface antigens on CD34+/CD38− cells and CD34+/CD38+ cells in patients with AML, CML (both at diagnosis and relapse), and normal donors (nBM). Cells were stained with antibodies against CD33, CD52, CD117 (KIT), and CD135 (FLT3). Expression of these targets on CD34+/CD38− and CD34+/CD38+ cells was determined by multicolor flow cytometry, as described in supplemental Patients and methods. The dotted line represents clear expression (staining index > 3). The range of each box represents the 25th to 75th percentiles. The middle horizontal line represents the median expression level. Red asterisk (*): P < .05 vs normal CD34+/CD38− BM cells; gray asterisk: P < .05 vs normal CD34+/CD38+ BM cells. Pairwise Wilcoxon test and P values were adjusted for multiple comparison using the Benjamini-Hochberg procedure. (B) Induction of apoptosis measured by annexin V staining after incubation of AML cells (n = 3) with GO (0.01-5 µg/mL) or medium control at 37°C for 48 hours (left panel). CD34+/CD38− and CD34+/CD38+ cells were then examined for signs of apoptosis by annexin V/DAPI staining. Analysis was performed by flow cytometry. Surviving CD34+/CD38− and CD34+/CD38+ cell fractions after incubation of AML MNCs with alemtuzumab (100-500 µg/mL) in the presence of 30% complement–containing human serum for 1 hour at 37°C (n = 4 patients) are shown (right panel). The absolute cell count of viable cells was measured with counting beads and DAPI staining by flow cytometry. Results are expressed as percentage of annexin V+/DAPI− cells (left panel) or viable cells (percentage of control; right panel) and represent the mean ± SD from 3 or 4 patients. *P ≤.05 vs control. (C) MNCs from 4 patients with AML were incubated in medium (control), GO, alemtuzumab, or a combination of both drugs in the presence of 30% human serum. Cells were incubated with GO (1 µg/mL) for 47 hours before adding alemtuzumab (300 µg/mL) for 1 hour (total treatment 48 hours). Thereafter, the absolute numbers of viable cells in the CD34+CD38− and CD34+/CD38+ fractions were measured with counting beads and DAPI staining by flow cytometry. Results are expressed as viable cells (percentage of control) and represent the mean ± SD from 4 patients. *P < .05 vs control. (D) CML MNCs were incubated with various concentrations of GO (0.01-5 µg/mL) (n = 5; left panel) or with denileukin-diftitox (10-100 µg/mL) (n = 5; right panel) for 48 hours at 37°C. Thereafter, apoptosis was analyzed in CD34+/CD38− CML LSCs (left and right panels) and CD34+/CD38+ progenitor cells (left panel, green bars) using annexin V/DAPI staining and flow cytometry. Results are expressed as the percentage of annexin V+/DAPI− cells and represent the mean ± SD from 5 experiments. *P < .05, #P = .06 (borderline significant). (E) MNCs from 3 patients with CML were incubated in medium (control), GO (1 µg/mL), alemtuzumab (100 µg/mL), or a combination of both drugs in the presence of 30% human serum. Cells were incubated with GO for 47 hours before adding alemtuzumab for 1 hour (total treatment 48 hours). Thereafter, the absolute numbers of viable cells in the CD34+/CD38− and CD34+/CD38+ fractions were measured with counting beads and DAPI staining by flow cytometry. Results are expressed as viable cells (percentage of control) and represent the mean ± SD from 3 experiments. *P < .05 vs control. The table shows the expression of target antigens on CD34+/CD38− AML and CML LSCs in all samples used for the in vitro drug-incubation experiments in panels B-E. Results were obtained using multicolor flow cytometry and are expressed as staining index (SI), as described in supplemental Patients and methods. SI values were graded using the following score: −, SI = 0 to 1.3; +/−, SI = 1.31 to 3; +, SI = 3.01 to 10; ++, SI > 10. Patient numbers (#) refer to patients defined in supplemental Tables 2 and 3. CP, chronic phase; D, diagnosis; n.t., not tested; R, relapse.
Expression of surface targets and effects of targeted drugs. (A) Expression of surface antigens on CD34+/CD38− cells and CD34+/CD38+ cells in patients with AML, CML (both at diagnosis and relapse), and normal donors (nBM). Cells were stained with antibodies against CD33, CD52, CD117 (KIT), and CD135 (FLT3). Expression of these targets on CD34+/CD38− and CD34+/CD38+ cells was determined by multicolor flow cytometry, as described in supplemental Patients and methods. The dotted line represents clear expression (staining index > 3). The range of each box represents the 25th to 75th percentiles. The middle horizontal line represents the median expression level. Red asterisk (*): P < .05 vs normal CD34+/CD38− BM cells; gray asterisk: P < .05 vs normal CD34+/CD38+ BM cells. Pairwise Wilcoxon test and P values were adjusted for multiple comparison using the Benjamini-Hochberg procedure. (B) Induction of apoptosis measured by annexin V staining after incubation of AML cells (n = 3) with GO (0.01-5 µg/mL) or medium control at 37°C for 48 hours (left panel). CD34+/CD38− and CD34+/CD38+ cells were then examined for signs of apoptosis by annexin V/DAPI staining. Analysis was performed by flow cytometry. Surviving CD34+/CD38− and CD34+/CD38+ cell fractions after incubation of AML MNCs with alemtuzumab (100-500 µg/mL) in the presence of 30% complement–containing human serum for 1 hour at 37°C (n = 4 patients) are shown (right panel). The absolute cell count of viable cells was measured with counting beads and DAPI staining by flow cytometry. Results are expressed as percentage of annexin V+/DAPI− cells (left panel) or viable cells (percentage of control; right panel) and represent the mean ± SD from 3 or 4 patients. *P ≤.05 vs control. (C) MNCs from 4 patients with AML were incubated in medium (control), GO, alemtuzumab, or a combination of both drugs in the presence of 30% human serum. Cells were incubated with GO (1 µg/mL) for 47 hours before adding alemtuzumab (300 µg/mL) for 1 hour (total treatment 48 hours). Thereafter, the absolute numbers of viable cells in the CD34+CD38− and CD34+/CD38+ fractions were measured with counting beads and DAPI staining by flow cytometry. Results are expressed as viable cells (percentage of control) and represent the mean ± SD from 4 patients. *P < .05 vs control. (D) CML MNCs were incubated with various concentrations of GO (0.01-5 µg/mL) (n = 5; left panel) or with denileukin-diftitox (10-100 µg/mL) (n = 5; right panel) for 48 hours at 37°C. Thereafter, apoptosis was analyzed in CD34+/CD38− CML LSCs (left and right panels) and CD34+/CD38+ progenitor cells (left panel, green bars) using annexin V/DAPI staining and flow cytometry. Results are expressed as the percentage of annexin V+/DAPI− cells and represent the mean ± SD from 5 experiments. *P < .05, #P = .06 (borderline significant). (E) MNCs from 3 patients with CML were incubated in medium (control), GO (1 µg/mL), alemtuzumab (100 µg/mL), or a combination of both drugs in the presence of 30% human serum. Cells were incubated with GO for 47 hours before adding alemtuzumab for 1 hour (total treatment 48 hours). Thereafter, the absolute numbers of viable cells in the CD34+/CD38− and CD34+/CD38+ fractions were measured with counting beads and DAPI staining by flow cytometry. Results are expressed as viable cells (percentage of control) and represent the mean ± SD from 3 experiments. *P < .05 vs control. The table shows the expression of target antigens on CD34+/CD38− AML and CML LSCs in all samples used for the in vitro drug-incubation experiments in panels B-E. Results were obtained using multicolor flow cytometry and are expressed as staining index (SI), as described in supplemental Patients and methods. SI values were graded using the following score: −, SI = 0 to 1.3; +/−, SI = 1.31 to 3; +, SI = 3.01 to 10; ++, SI > 10. Patient numbers (#) refer to patients defined in supplemental Tables 2 and 3. CP, chronic phase; D, diagnosis; n.t., not tested; R, relapse.
Validation of therapeutic molecular targets on LSCs in AML and CML
LSCs in AML and CML were found to express several target antigens, including CD33/Siglec-3 and CD52/Campath-1 (Figures 1 and 5A; supplemental Table 18). In most patients with CML and AML, LSCs also expressed CD25/IL-2RA, KIT/CD117, and FLT3/CD135 (Figures 1 and 5A; supplemental Table 18). We found that the IL-2R–targeted drug denileukin-diftitox, the CD33-targeted drug GO, the CD52-targeted drug alemtuzumab, and the multitargeted KIT/FLT3 blocker midostaurin (target profile is shown in supplemental Table 19) induce in vitro apoptosis in AML and CML LSCs (Figure 5B-E; supplemental Figures 9 and 10A). In control experiments, denileukin-diftitox induced apoptosis in KU812 cells transduced with a random short hairpin RNA, but it did not induce apoptosis in KU812 cells expressing CD25/IL-2RA short hairpin RNA (supplemental Figure 10B). We also found that the combination of GO and alemtuzumab exerts cooperative effects on the viability of AML and CML stem and progenitor cells (Figure 5C,E). Preincubation of CML LSCs with alemtuzumab or GO resulted in decreased leukemic engraftment in NSG mice, and a combination of both drugs induced almost complete eradication of LSCs (Figure 6A). By contrast, in AML, LSC-depleting effects were only seen with GO, but not with alemtuzumab, in our NSG model (Figure 6B). Expression of cytokine receptors and target antigens on LSCs in AML and CML samples injected into NSG mice was confirmed by multicolor flow cytometry (supplemental Table 20).
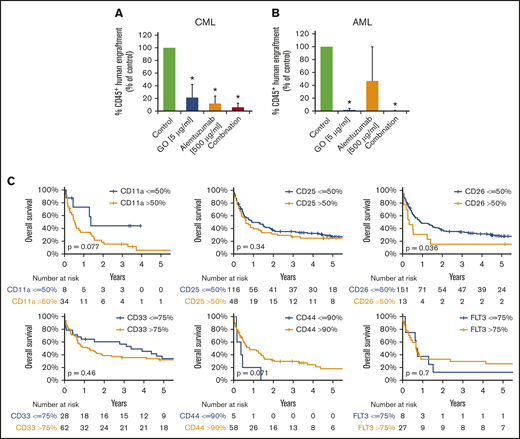
Clinical and functional impact of CD surface molecules on AML and CML LSCs. (A-B) Effects of GO and alemtuzumab on engraftment of CML and AML stem cells in NSG mice. A total of 0.5 to 1 × 10⁶ CD34 magnetic-activated cell sorting (MACS) cells from 3 patients with CML (A) or 1.5 to 15 × 106 cells (T-cell–depleted MNCs by MACS) from 5 patients with AML (B) was preincubated with or without GO (5 µg/mL), alemtuzumab (500 µg/mL), or both drugs in the presence of 30% complement–containing human serum for 1 hour at 37°C (same cell number for all conditions). Then, cells were washed and injected into the lateral tail vein of irradiated NSG mice. After 25 to 27 weeks (for mice with CML; A) or 7 to 15 weeks (for mice with AML; B) mice were euthanized, BM cells were flushed from tibiae, femora, and humeri, and engraftment of human CD45+ cells was analyzed by flow cytometry. Results are expressed as percentage of human CD45+ cells (of all viable cells), and represent the mean ± SD from 3 to 5 independent experiments with 5 mice per group. *P < .05 vs control. (C) Overall survival of AML patients based on surface marker expression on LSCs. AML patients were split into 2 groups per marker, based on higher (yellow graphs) or lower (blue graphs) expression of surface antigens on CD34+/CD38− stem cells: CD11a, CD25, CD26, CD33, CD44, and CD135 (FLT3). The thresholds of expression were selected based on patient distribution and formation of subsets in flow cytometry experiments (supplemental Patients and methods). OS of patients with AML was calculated using the Kaplan-Meier method. The P values were calculated using the log-rank test.
Clinical and functional impact of CD surface molecules on AML and CML LSCs. (A-B) Effects of GO and alemtuzumab on engraftment of CML and AML stem cells in NSG mice. A total of 0.5 to 1 × 10⁶ CD34 magnetic-activated cell sorting (MACS) cells from 3 patients with CML (A) or 1.5 to 15 × 106 cells (T-cell–depleted MNCs by MACS) from 5 patients with AML (B) was preincubated with or without GO (5 µg/mL), alemtuzumab (500 µg/mL), or both drugs in the presence of 30% complement–containing human serum for 1 hour at 37°C (same cell number for all conditions). Then, cells were washed and injected into the lateral tail vein of irradiated NSG mice. After 25 to 27 weeks (for mice with CML; A) or 7 to 15 weeks (for mice with AML; B) mice were euthanized, BM cells were flushed from tibiae, femora, and humeri, and engraftment of human CD45+ cells was analyzed by flow cytometry. Results are expressed as percentage of human CD45+ cells (of all viable cells), and represent the mean ± SD from 3 to 5 independent experiments with 5 mice per group. *P < .05 vs control. (C) Overall survival of AML patients based on surface marker expression on LSCs. AML patients were split into 2 groups per marker, based on higher (yellow graphs) or lower (blue graphs) expression of surface antigens on CD34+/CD38− stem cells: CD11a, CD25, CD26, CD33, CD44, and CD135 (FLT3). The thresholds of expression were selected based on patient distribution and formation of subsets in flow cytometry experiments (supplemental Patients and methods). OS of patients with AML was calculated using the Kaplan-Meier method. The P values were calculated using the log-rank test.
Phenotype of preleukemic neoplastic stem cells
To determine the phenotype of preleukemic neoplastic stem cells (pre-L-NSCs), we examined patients with MDS, a potential prephase of AML. Putative CD34+/CD38− pre-L-NSCs in these patients expressed CD25, CD33, CD44, CD90, CD105, CD114, CD117, CD123, CD135, CD184, and ROBO4 (supplemental Figures 4 and 11; supplemental Table 21). CD90 was found to be overexpressed on pre-L-NSCs compared with BM HSCs and LSCs. In a subset of patients, CD34+/CD38− cells also expressed CD25 (41% of cases) and CLL-1 (54% of cases) (supplemental Table 21). By contrast, in most MDS patients, pre-L-NSCs did not express CD26 or CD96. These data suggest that several markers and targets, including CD25 and CLL-1, are expressed at an early phase of LSC evolution. In a small subset (16%) of patients with ICUS, a potential prephase of MDS,44,45 CD25 was found to be expressed on CD34+/CD38− cells (supplemental Figure 11).
Prognostic significance of expression of LSC markers in AML and CML
To define the prognostic impact of surface marker expression in AML and CML LSCs, we correlated OS with LSC phenotypes. As shown in Figure 6C, expression of CD26 on AML LSCs was associated with reduced OS (P < .05). As expected, the influence of LSC CD26 expression on OS was not an independent prognostic variable in multivariate analyses (including the FLT3 mutation status), because CD26-expressing LSCs were only detected in FLT3 ITD+ AML. Expression of CD11a and CD44 was also found to correlate with OS, although the difference did not reach statistical significance (Figure 6C; supplemental Figure 12). Next, we compared OS in patients in whom LSCs expressed 1 or 0 aberrant markers with those whose LSCs expressed 2 to 4 of the following markers: CD25, CD26, IL-1RAP, and CLL-1. OS was significantly shorter in patients in whom LSCs displayed multiple aberrant markers compared with cases where LSCs expressed 0 or only 1 aberrant antigen (supplemental Figure 13). In CML, decreased expression of G-CSFR (CD114), GM-CSFR (CD116), and KIT was found to correlate with poor OS (supplemental Figure 14).
Discussion
In recent years, substantial efforts have been made to define marker and target expression profiles in LSCs.13-17,21-29 Of special interest are (1) diagnostic markers, (2) prognostic determinants, and (3) cell surface targets that are accessible to immunotherapy. We performed molecular studies and applied a larger panel of monoclonal antibodies to establish and compare marker and target expression profiles of LSCs in AML and CML. Our results show that LSCs in AML and CML express a unique phenotype, including aberrantly expressed markers and target antigens. These data may have clinical implications and may facilitate LSC detection and isolation and the development of LSC-eliminating therapies. Moreover, we show that expression of certain markers on LSCs in AML and CML is of diagnostic or prognostic significance.
A number of surface markers have recently been identified on putative LSCs.21-29,36-39,43,46-50 We extended these analyses and compared the phenotype of AML LSCs and CML LSCs with each other and with the phenotype of HSCs and stem cells in other neoplasms. Although the LSC phenotype in CML was found to be unique and recurrent, the LSC phenotype in AML showed considerable heterogeneity without a definitive relationship to a morphologic or WHO type of AML.
An interesting finding was that CB HSCs, but not BM HSCs, display several antigens that are otherwise expressed aberrantly on LSCs (eg, CD93 or IL-1RAP), which is important when considering the appropriate “control cell.” It is also worth noting that CB HSCs displayed high levels of IGF-1R (CD221), whereas BM HSCs and LSCs expressed low levels or no IGF-1R. So far, it remains unknown why CB HSCs, but not BM HSCs, share surface antigens with LSCs. One explanation might be that LSCs and CB HSCs exhibit similar biological properties. For example, CB HSCs have higher long-term proliferative potential than BM HSCs.51 In addition, like LSCs, CB HSCs are considered “mobilized” cells. However, unlike CML LSCs, CB HSCs did not express CD26, a key mediator of stem cell mobilization.24,52,53 Phenotypic heterogeneity of AML LSCs may be explained by the fact that aberration profiles and signaling machineries in AML are complex and differ among AML variants, thereby leading to phenotypic heterogeneity of LSCs.54,55
We also identified several new interesting markers and targets in our gene array studies. However, in several instances, discrepant results were obtained when comparing messenger RNA and protein levels. This may be due to the fact that several targets are only expressed on the surface but are not synthesized by resting LSCs. On the other hand, some of the markers may only be expressed at the messenger RNA level and cytoplasm (but not surface) of AML cells or may be rapidly internalized.
ROBO4 is a mesenchymal antigen involved in the regulation of cytokine-dependent growth of endothelial cells.56 In addition, ROBO4 has recently been identified in murine HSCs57,58 and human AML cells.59 We found that HSCs and LSCs express ROBO4. Although CML LSCs expressed ROBO4 at high levels, AML LSCs expressed only low amounts of ROBO4. The function of ROBO4 on LSCs remains unknown. In our studies, the ROBO4 ligand SLIT2 showed no growth-modulating effects on LSCs.
Growth and self-renewal of normal and neoplastic stem cells are regulated by a network of cytokines.60-64 We found that LSCs display receptors for several cytokines, including IL-2RA, G-CSFR, IL-3RA, KIT/CD117, FLT3/CD135, and CXCR4/CD184. We also found that LSCs are responsive to G-CSF and SCF. These cytokines promoted proliferation and survival in AML LSCs. However, although cytokine receptors were expressed on LSCs in most samples tested, responses to cytokines did not always correlate with cytokine receptor expression, which may be due to the fact that LSCs grow independently of these cytokines, including G-CSF, SCF, or IL-3.
Several studies have highlighted the important interactions between HSCs/LSCs and the BM niche.64-69 We examined LSCs for expression of surface antigens that play a potential role in LSC-niche interactions, including CD44, CD93, or ROBO4. Most of these antigens were expressed on HSCs and LSCs. Interestingly, CML LSCs displayed high levels of CD93, whereas BM HSCs expressed low levels or no detectable CD93.
Recent data suggest that LSC evolution is a stepwise process including premalignant stages which are considered to be derived from pre-L-NSCs.70-75 Such pre-L-NSCs can be found in MDS, a potential prephase of AML. Although little is known about the phenotypic and functional properties of MDS-propagating pre-L-NSCs, these cells are also considered to reside in a CD34+/CD38− fraction of the clone.71,72,75 We examined putative pre-L-NSCs in MDS patients and found that these cells frequently display CD25, CD117, CLL-1, and IL-1RAP. CD25 was also detectable on CD34+/CD38− cells in a small subset of patients with ICUS, a potential prephase of MDS. These data suggest that CD25 may be expressed at an early phase in LSC evolution, confirming a recent study.76 Other surface targets, such as CD33, CD44, or CD52, were also detectable on putative MDS stem cells. In addition, pre-L-NSCs expressed G-CSFR, which is of clinical relevance because neutropenic MDS patients are often treated with G-CSF. Finally, pre-L-NSCs expressed several targets, including CD33 and CD52. With regard to CD52, these data confirm our previous results.35
Expression of certain LSC markers, like CD25 or CD52, may also be of prognostic significance in AML.35,77,78 In this study, we were able to show that expression of CD26 on AML LSCs is prognostic with regard to OS. This was an expected outcome, because expression of CD26 on AML LSCs is restricted to FLT3 ITD+ cases. No other significant correlation between survival and LSC marker expression was found. Other studies have shown that CD44 may be a prognostic LSC marker in AML.79 In our study, lower expression of CD44 on AML LSCs showed a tendency toward a worse OS. However, because LSC strongly expressed CD44 in almost all patients, no definitive conclusion on the prognostic impact of CD44 could be drawn.
We also asked whether some of the prognostic LSC antigens change in expression during follow-up. To address this point, we compared diagnostic samples and relapse samples. However, only a few consistent changes were found. In fact, the levels of CD123 usually increased on AML LSCs at relapse compared with the diagnostic samples. In addition, ROBO4 levels decreased on CML LSCs at relapse compared with the initial diagnosis.
We next asked whether drugs directed against LSCs can attack and eliminate them. We found that the multitargeted KIT/FLT3 inhibitor midostaurin, the IL-2R–targeted drug denileukin-diftitox, and the CD33-targeting drug GO induce apoptosis in LSCs. The CD52-targeting drug alemtuzumab induced cell lysis. GO and alemtuzumab also counteracted engraftment of LSCs in NSG mice. However, these drugs also produce cytopenia and, thus, hematologic toxicity,80,81 because CD33 and CD52 are also expressed on normal HSCs. Therefore, the dose of these antibody conjugates may play a decisive role. It is also worth noting that the drug combination GO + alemtuzumab produced cooperative antineoplastic effects on CML LSCs at suboptimal concentrations, which may provide a therapeutic window. Another solution may be to use toxin conjugates directed against antigens specifically expressed on LSCs, but not on HSCs, such as CD26, IL-1RAP, or CD371/CLL-1.21-24,43,82,83 However, even with such antibodies, several pitfalls have to be considered. One is that LSCs in AML and CML exhibit subclone-specific heterogeneity; therefore, not all LSCs in a given neoplasm may express the same targets.17,81,84,85 Rather, smaller subsets of LSCs may lack certain targets, and these cells may survive therapy. In addition, LSCs may exhibit intrinsic resistance and escape toxin conjugate–based therapies.12-17,69,85,86 Finally, LSCs may be less sensitive to toxin conjugates when residing in the niche.12-17,65,66,69,70 Because of multiple mechanisms of LSC resistance, drug combinations may be required to eliminate all LSCs.
Together, AML LSCs and CML LSCs express unique marker and target expression profiles. These markers are valuable tools for the identification and purification of LSCs. Thus, LSC phenotyping can now be used as a diagnostic approach. Moreover, our data may support the design of LSC-eliminating immunotherapies.
Data sharing requests should be sent to Peter Valent (peter.valent@meduniwien.ac.at).
The data reported in this article have been deposited in the Gene Expression Omnibus database (accession number GSE138883).
Acknowledgments
The authors thank Günther Hofbauer and Andreas Spittler (Cell Sorting Core Unit of the Medical University of Vienna), Deborah Todhunter, Karin Bauer, Dubravka Smiljkovic, Yüksel Filik, Mathias Schneeweiss-Gleixner, Markus Jeitler, and Tina Bernthaler for excellent technical assistance.
This study was supported by the Austrian Science Fund (FWF) grants F4701-B20 and F4704-B20, and a Cancer Stem Cell Grant from the Medical University of Vienna. In addition, the study was funded in part by Celgene Corporation (Summit, NJ) via a research grant.
The authors independently developed, directed, and are fully responsible for all content and editorial decisions for this manuscript.
Authorship
Contribution: H.H. and I.S. performed key laboratory experiments and wrote parts of the manuscript; G.S. provided qPCR data; G.E. performed cell sorting and analyzed surface marker expression by flow cytometry; T.R. and M.W. performed xenotransplant experiments; G.H. and G.G. provided vital cell line models and performed experiments with transfected cell lines; K.B. and N.M. analyzed surface marker expression by flow cytometry; S.H. provided vital logistics support and collected patient data; M.B. provided microarray analyses; S.B. provided CB samples; B.S. performed FISH experiments; W.R.S. provided clinical data and patient samples; W.R., and A.S. provided patient samples and logistic support; D.A.V. provided vital reagents; and P.V. designed the study and wrote the manuscript.
Conflict-of-interest disclosure: P.V. received research grants from Celgene, Incyte, Domantis and Pfizer and honoraria from Celgene, Novartis, Incyte, Pfizer, Blueprint, and Deciphera. G.H. received research support from Novartis and honoraria from Novartis, Roche, Bristol-Myers Squibb, Pfizer, and Ariad. W.R.S. received honoraria and/or travel support from AbbVie, Amgen, Celgene, Daiichi Sankyo, Incyte, Jazz Pharmaceuticals, Novartis, Pfizer, Roche, and Teva. D.A.V. receives royalties and consulting honoraria from GT Biopharma. All conflicts have been managed by the University of Minnesota in conjunction with its conflict-of-interest policies. The remaining authors declare no competing financial interests.
Correspondence: Peter Valent, Department of Internal Medicine I, Division of Hematology and Hemostaseology and Ludwig Boltzmann Institute for Hematology and Oncology, Medical University of Vienna, Waehringer Guertel 18-20, A-1090 Vienna, Austria; e-mail: peter.valent@meduniwien.ac.at.

