

Key Points
MSPCs expand in the human AML bone marrow with deficiency in osteogenesis through inhibition of cytoplasmic β-catenin.
Deficiency in osteogenesis is reflected by lower peripheral blood osteocalcin levels at first diagnosis predicting long-term outcome in AML patients.

Abstract
Murine models of myeloid neoplasia show how leukemia infiltration alters the hematopoietic stem cell (HSC) niche to reinforce malignancy at the expense of healthy hematopoiesis. However, little is known about the bone marrow architecture in humans and its impact on clinical outcome. Here, we dissect the bone marrow niche in patients with acute myeloid leukemia (AML) at first diagnosis. We combined immunohistochemical stainings with global gene expression analyses from these AML patients and correlated them with clinical features. Mesenchymal stem and progenitor cells (MSPCs) lost quiescence and significantly expanded in the bone marrow of AML patients. Strikingly, their HSC- and niche-regulating capacities were impaired with significant inhibition of osteogenesis and bone formation in a cell contact–dependent manner through inhibition of cytoplasmic β-catenin. Assessment of bone metabolism by quantifying peripheral blood osteocalcin levels revealed 30% lower expression in AML patients at first diagnosis than in non-leukemic donors. Furthermore, patients with osteocalcin levels ≤11 ng/mL showed inferior overall survival with a 1-year survival rate of 38.7% whereas patients with higher osteocalcin levels reached a survival rate of 66.8%. These novel insights into the human AML bone marrow microenvironment help translate findings from preclinical models and detect new targets which might pave the way for niche-targeted therapies in AML patients.
Introduction
Maintenance and differentiation of hematopoietic stem cells (HSCs) are strictly regulated through the bone marrow microenvironment. Different animal models have elegantly uncovered the delicate architecture of cellular and noncellular constituents in the bone marrow and their impact on HSC function.1 Acute myeloid leukemia (AML) is characterized by a high relapse rate, which is associated with chemoprotection of leukemia-initiating cells and an early hematopoietic failure.2 Various murine models revealed how myeloid neoplasia alters the architecture and the functional characteristics of the bone marrow niche.3,4 These alterations have been proven to give advantage to leukemia cells at the expense of HSCs. We previously showed in a MLL-AF9–driven murine model of AML that leukemia infiltration induced sympathetic neuropathy in the bone marrow microenvironment that accompanied loss of quiescence and expansion of the niche size.5 Strikingly, the fate of mesenchymal stem and progenitor cells (MSPCs) was skewed toward the osteolineage with an accumulation of osteoprogenitors in the AML bone marrow. Simultaneously, MSPCs from leukemic bone marrow lacked expression of HSC-regulating factors such as Scf, Cxcl12, and Angpt1 leading to a loss of quiescence in HSCs, which ultimately results in their decimation and relocalization.
Taken together, this provides increasing evidence of how the induced alterations in the AML niche sustain leukemia proliferation. On the basis of these observations, an intervention between leukemia-initiating cells and their altered microenvironment to render them more sensitive to genotoxic agents seemed to be a feasible therapeutic approach. Activation of the sympathetic tone by administration of adrenergic β2-receptor agonists or serotonin inhibitors to increase osteoblast numbers are strategies to attenuate leukemia progression in murine models.5,6 These approaches could also be translated into the clinic to decrease the high relapse rate in AML patients. However, there is little knowledge about the nature of the human bone marrow niche and how findings from murine models might be relevant to human AML. Several reports have shown that bone marrow stromal cells cultured as adherent layers harbor a distinct gene expression profile.3,7 However, in these studies, the impact of in vitro culture on the fate of bone marrow MSPCs is not accounted for. Furthermore, there is little insight into the in situ architecture of the bone marrow niche in human AML, nor do we have prospective data on the clinical significance of these niche aberrations in humans.
In this study, we analyzed the cellular composition in situ and evaluated the global gene expression profile of freshly isolated human bone marrow MSPCs from AML patients at first diagnosis and matched controls. In fact, AML patients showed an increased proliferation of MSPCs with skewed differentiation potential and striking defects in osteoblast mineralization because of AML-mediated inhibition of the WNT/β-catenin pathway. Importantly, these niche alterations turned out to predict clinical outcome in AML patients.
Methods
Patient samples
After all participants provided informed consent according to institutional guidelines, between January 2010 and August 2017, primary patient samples of peripheral blood or bone marrow were obtained from newly diagnosed AML patients (excluding patients with acute promyelocytic leukemia), or patients with non-Hodgkin lymphoma without bone marrow involvement, and non-leukemic healthy donors as controls. Patients who had ever received an anti-neoplastic treatment were excluded. The study was carried out in accordance with the approved protocol of the University of Duisburg-Essen Ethics Committee.
Cell isolation
Peripheral blood and bone marrow mononuclear cells were purified using Lymphoprep (STEMCELL Technologies, Vancouver, BC, Canada). To isolate primary bone marrow MSPCs, purified bone marrow mononuclear cells were enzymatically digested with 1 mg/mL collagenase type I (Sigma-Aldrich, St Louis, MO) and 2 mg/mL dispase (Sigma-Aldrich) in Hank’s balanced salt solution (Gibco, Grand Island, NY) with 10% heat-inactivated fetal bovine serum (PAN-Biotech, Aidenbach, Germany) for 30 minutes at 37°C. Remaining erythrocytes were lysed with lysing buffer (BD Biosciences, San Jose, CA). Cells were enriched by magnetic CD45 depletion using the EasySep Human CD45 Depletion Kit (STEMCELL Technologies) and stained with fluorochrome-conjugated monoclonal antibodies specific to human CD45 (HI30) (eBioscience, San Diego, CA), CD235a (HIR2) (eBioscience), CD31 (WM-59) (eBioscience), CD271 (ME20.4) (BioLegend, San Diego, CA), and CD146 (P1H12) (BD Biosciences, San Jose, CA). Cells were sorted by FACS ARIA III (BD Biosciences),and MSPCs were characterized as DAPI–CD45–CD235a–CD31–CD146low/+CD271+ as previously described,8,9 and stromal cells were detected as DAPI–CD45–CD235a–CD31–CD146–CD271– cells.
Histology, immunohistochemistry, and image acquisition and analysis
Bone marrow trephine biopsy samples underwent formalin fixation and paraffin embedding. Sections were stained with anti-CD271 antibody (ME20.4) (BioLegend). Antibody binding was visualized by incubation with secondary antibody and development with 3,3′-diaminobenzidine (DAB) chromogen, followed by hematoxylin counterstaining. Reticulum staining was performed manually with Gomori’s silver impregnation method. CD271-stained slides were imaged on a Zeiss AxioObserver Z1 inverted microscope with a 10×/0.45 Plan-Apochromat objective lens (Zeiss, Oberkochen, Germany) using an Axiocam 506 (6 Mpix) color camera. The tiled images of whole bone marrow sections were fused to a single image with Zen Pro 2.0 software (Zeiss). Color deconvolution of the images was performed to obtain separate hematoxylin and DAB images using the ImageJ plugin IHC Profiler (https://sourceforge.net/projects/ihcprofiler/). The total bone section area and the DAB-stained area were obtained in ImageJ from setting defined thresholds. For slides stained for reticular fibers, a 40×/0.95 Plan-Apochromat Corr objective (Zeiss) was used on the same inverted microscope. For the quantification of fibers by area, images were segmented using ImageJ with the trainable Weka Segmentation plugin (https://imagej.net/Trainable_Weka_Segmentation), which performs image segmentation based on pixel classification.
Statistics
A Mann-Whitney U test was used for continuous variables vs categorical variables. A Pearson’s χ2 or Fisher’s exact test was used for comparison of the dichotomous variables. The survival variables were estimated by the Kaplan-Meier method. Differences between groups were calculated using the log-rank test for univariable analysis. These calculations were performed using MedCalc Statistical software version 19.0.0 (MedCalc, Ostend, Belgium). GraphPad Prism 8 version 8.0.2 (GraphPad, La Jolla, CA) software was used for the D’Agostino-Pearson omnibus normality test, parametric (unpaired Student t) and nonparametric (Mann-Whitney U) tests to compare the differences between groups.
Results
AML infiltration induces proliferation of bone marrow MSPCs
In a murine model of AML, we previously showed that leukemia infiltration induces an increased niche size.5 To dissect the architecture of the AML bone marrow niche in humans, we first attempted to quantify MSPCs in the bone marrow. We stained bone marrow sections for CD271 and scanned the whole tissue surface of each biopsy section reaching an average area of 25.4 mm2 (range, 3.5-92.7 mm2). To avoid any bias, we automatically quantified the CD271+ area within the total tissue surface using an in-house written script for ImageJ (Figure 1A). In fact, the positive stained area of CD271+ MSPCs in leukemic bone marrow was significantly increased by 1.5-fold, with a median CD271+ area of 5.5% (interquartile range [IQR], 2.8% to 9.5%; n = 36) compared with 3.7% (IQR, 2.1% to 5.7%; n = 58) in controls (Figure 1B-C). MSPCs are known to produce reticular fibers in the bone marrow,10 and their abundance is frequently associated with different malignant states.11-13 In AML, an increase in reticular fibers at first diagnosis was correlated with a higher rate of induction therapy failure and an inferior relapse-free and overall survival.14 To quantify the numbers of reticular fibers in AML patients compared with those in non-leukemic donors, we used silver staining on bone marrow sections. For automatic quantification, we used trainable Weka segmentation, a plugin of ImageJ software, to produce pixel-based segmentations which allowed us to calculate the total tissue surface and silver-stained area (average area, 61 100 µm2 per sample; range, 24 400-112 700 µm2 per sample) (Figure 1D). Strikingly, non-leukemic controls showed only scarce reticular fibers in the bone marrow, but AML patients showed a significant twofold increment with a median silver-stained area of 3.4% (IQR, 1.8% to 4.5%; n = 37), compared with 1.6% (IQR, 1.1% to 3.3%; n = 19) in controls (Figure 1E-F). Of note, the increase in reticular fibers in AML bone marrow at first diagnosis showed a significant negative correlation with hemoglobin levels (Pearson r2 = 0.0914; P = .0278) and platelet numbers (Pearson r2 = 0.0933; P = .0261) but, similar to CD271+ MSPCs, there was no significant correlation to clinical outcome (data not shown). In summary, along with leukemia infiltration, MSPCs and reticular fibers were found to be significantly increased in the human AML bone marrow niche.
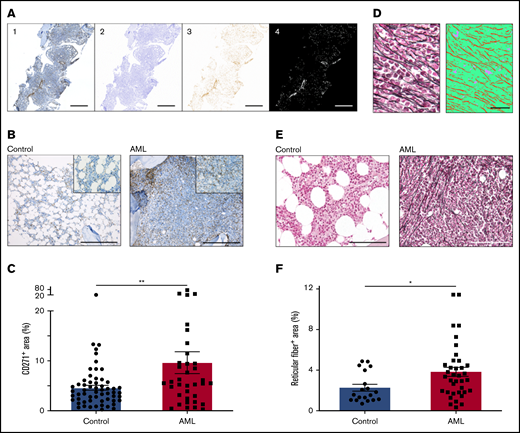
AML infiltration induces proliferation of bone marrow MSPCs. (A) Exemplary procedure for quantification of CD271. First, tile images were fused into larger images (1). Second, a color deconvolution was performed (ImageJ, IHC Profiler plugin) to obtain separate hematoxylin and DAB images. The hematoxylin image was thresholded to obtain a mask of the total bone region (2). The DAB image (3) was inverted and thresholded to obtain a mask of the positive DAB regions (4). Scale bars, 1 mm. (B) Representative images of bone marrow biopsy samples of non-leukemic donors (controls) and AML patients stained for CD271+ MSPCs (brown) and counterstained with hematoxylin (blue). Scale bars, 400 µm. (C) Quantification of CD271+ bone marrow MSPCs in controls (n = 58) and AML patients (n = 36); CD271+ area is calculated by CD271+ stained area divided by total tissue surface. (D) Left: representative image from bone marrow after silver staining representing reticular fibers. Right: image converted by trainable Weka segmentation showing 3 different classes: red, reticular fiber; green, tissue; purple, background. Scale bars, 50 µm. (E) Representative images of bone marrow biopsy samples from controls and AML patients stained for reticular fibers with silver staining (black fiber) and counterstained with the fast-red nuclear solution. Scale bars, 100 µm. (F) Quantification of reticular fibers in control (n = 19) and AML (n = 37) bone marrow by calculating positive silver stained area divided by total tissue surface (n = 56). Data are shown as mean ± standard error of the mean (SEM). *P < .05; **P < .01 (determined by Mann-Whitney U test).
AML infiltration induces proliferation of bone marrow MSPCs. (A) Exemplary procedure for quantification of CD271. First, tile images were fused into larger images (1). Second, a color deconvolution was performed (ImageJ, IHC Profiler plugin) to obtain separate hematoxylin and DAB images. The hematoxylin image was thresholded to obtain a mask of the total bone region (2). The DAB image (3) was inverted and thresholded to obtain a mask of the positive DAB regions (4). Scale bars, 1 mm. (B) Representative images of bone marrow biopsy samples of non-leukemic donors (controls) and AML patients stained for CD271+ MSPCs (brown) and counterstained with hematoxylin (blue). Scale bars, 400 µm. (C) Quantification of CD271+ bone marrow MSPCs in controls (n = 58) and AML patients (n = 36); CD271+ area is calculated by CD271+ stained area divided by total tissue surface. (D) Left: representative image from bone marrow after silver staining representing reticular fibers. Right: image converted by trainable Weka segmentation showing 3 different classes: red, reticular fiber; green, tissue; purple, background. Scale bars, 50 µm. (E) Representative images of bone marrow biopsy samples from controls and AML patients stained for reticular fibers with silver staining (black fiber) and counterstained with the fast-red nuclear solution. Scale bars, 100 µm. (F) Quantification of reticular fibers in control (n = 19) and AML (n = 37) bone marrow by calculating positive silver stained area divided by total tissue surface (n = 56). Data are shown as mean ± standard error of the mean (SEM). *P < .05; **P < .01 (determined by Mann-Whitney U test).
Bone marrow MSPCs from AML patients harbor a distinct gene expression profile
To get more insight into the nature of bone marrow MSPCs from AML patients at first diagnosis, we assessed their global gene expression profile compared with that of MSPCs from matching non-leukemic donors by performing microarray analysis on freshly isolated DAPI–CD45–CD235a–CD31–CD146 low/+CD271+ MSPCs (supplemental Figure 1A). We confirmed the accuracy of our sorting strategy by comparing the expression profile of DAPI–CD45–CD235a–CD31–CD146–CD271– stromal cells and MSPCs from individual samples from non-leukemic controls. Phenotypic MSPCs harbored a distinct gene expression profile compared with bone marrow stromal cells (supplemental Figure 1B). In particular, genes known to be enriched in bone marrow MSPCs such as HSC-regulating factors15,16 and genes related to niche-regulating activity17-19 proved to have significantly higher expression in phenotypic MSPCs (supplemental Figure 1C). Comparing the gene expression of bone marrow MSPCs from AML patients with non-leukemic controls revealed, in the principal component analysis, a high variability among AML samples (Figure 2A). Despite this variability, 1952 of 21 448 analyzed gene symbols showed significant differences, as depicted in the supervised hierarchical cluster analysis, suggesting a distinct gene expression pattern for bone marrow MSPCs in AML (Figure 2B). To gain insight into the altered canonical pathways in AML MSPCs, we used Ingenuity Pathway Analysis (IPA) software (QIAGEN). In total, 51 canonical pathways were significantly altered (supplemental Table 1). The top 20 differently regulated pathways ranked by P value could be classified into 4 functional groups: protein synthesis, MSPC survival and differentiation, angiogenesis, and neuron survival and differentiation-related pathways (Figure 2C). These top-ranked pathways share common genes, which is shown in the overlapping canonical pathway map (Figure 2D). To better understand the biological phenotype in MSPCs from AML bone marrow, we next applied gene set enrichment analysis (GSEA). In total, 80 gene sets showed significant differences between bone marrow MSPCs from AML patients and controls, which are summarized according to their category as well as normalized enrichment score (NES) and P value (supplemental Table 2). Strikingly, ribosome and protein synthesis–related gene sets were most significantly changed, which is consistent with the IPA canonical pathway analysis. On the basis of that, we further evaluated pathways involving proliferation and differentiation of MSPCs and created a collection of gene sets related to cell proliferation, osteogenesis, adipogenesis, and chondrogenesis from the Molecular Signatures Database (MSigDB). Six of the 7 proliferation-associated gene sets were found to be significantly (NES >1.5; P < .05) enriched in bone marrow MSPCs from AML patients, which is linked with an induction of proliferation and cell survival in bone marrow MSPCs from AML patients. One gene set enriched in control samples was functionally linked to decreased proliferation (Figure 2E), which is in line with the above-mentioned expansion of MSPCs in AML bone marrow. As for the lineage differentiation, 5 osteogenesis-related gene sets were significantly less enriched in bone marrow MSPCs from AML patients, implying inhibition of osteogenesis and bone formation in MSPCs from AML patients (Figure 2F). Neither adipogenesis- nor chondrogenesis-related gene sets showed a clear enrichment in either group (supplemental Figure 1D-E). Next to niche-regulating functions, MSPCs strictly regulate maintenance and retention of HSCs in the bone marrow through the expression of certain soluble mediators.1 Strikingly, MSPCs from AML patients showed significantly lower expression of CXCL12, ANGPT1, and VCAM1 in comparison with those from non-leukemic donors (Figure 2G). Of note, the decreased expression of HSC-regulating genes correlated with the degree of hematopoietic failure (Figure 2G).
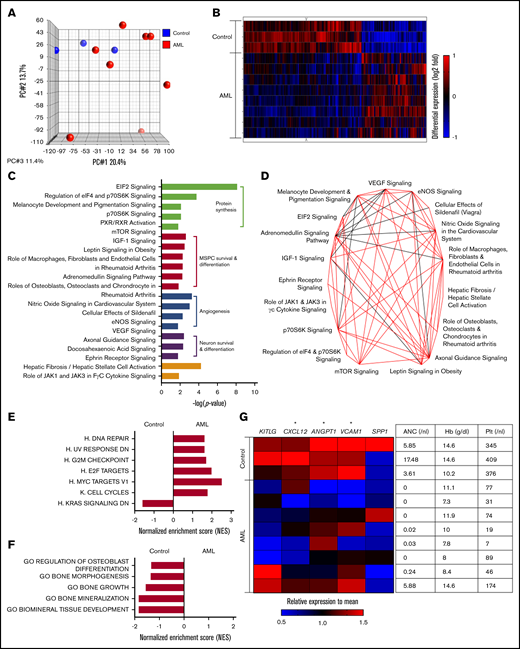
Bone marrow MSPCs from AML patients harbor a distinct gene expression profile. (A) Principal component (PC) analysis of MSPCs isolated from AML patients and non-leukemic donors. (B) Hierarchical cluster analysis of genes with significantly different expression between MSPCs from AML patients (n = 8) and controls (n = 3) by the unweighted pair-group method with arithmetic averages. Gene signal intensities were normalized to the mean signal of all samples with log10 transformation. Horizontal rows represent individual samples; vertical columns represent individual genes. Black indicates average signal intensity, brightest red represents twofold or higher upregulated, and brightest blue represents twofold or lower downregulated gene expression relative to the mean. (C) Twenty top altered canonical pathways (P < .05) in bone marrow MSPCs from AML patients compared with controls were generated by Ingenuity Pathway Analysis (IPA) software (QIAGEN) and subcategorized into 4 functional groups. (D) Overlapping canonical pathway analysis generated by IPA. Black line indicates 4 genes and red line indicates more than 4 genes were shared between connected pathways. (E) Gene set enrichment analysis (GSEA) of proliferation-related gene sets with normalized enrichment score (NES) >1.5 and P < .05. (F) GSEA of osteogenesis-related gene sets with NES >1.5 and P < .05. (G) Left: heatmap of HSC-regulating genes in MSPCs from AML patients and controls. Gene signal intensities were central to the mean signal of individual gene symbols. Horizontal rows represent individual samples; vertical columns represent individual genes. Black indicates average signal intensity, brightest red represents 1.5-fold or higher upregulated, and brightest blue represents twofold or higher downregulated gene expression relative to the mean. Right: complete blood count of peripheral blood from corresponding patients at diagnosis including hemoglobin (Hb), absolute neutrophil count (ANC), and platelet (Plt). *P < .05 (determined by unpaired Student t test).
Bone marrow MSPCs from AML patients harbor a distinct gene expression profile. (A) Principal component (PC) analysis of MSPCs isolated from AML patients and non-leukemic donors. (B) Hierarchical cluster analysis of genes with significantly different expression between MSPCs from AML patients (n = 8) and controls (n = 3) by the unweighted pair-group method with arithmetic averages. Gene signal intensities were normalized to the mean signal of all samples with log10 transformation. Horizontal rows represent individual samples; vertical columns represent individual genes. Black indicates average signal intensity, brightest red represents twofold or higher upregulated, and brightest blue represents twofold or lower downregulated gene expression relative to the mean. (C) Twenty top altered canonical pathways (P < .05) in bone marrow MSPCs from AML patients compared with controls were generated by Ingenuity Pathway Analysis (IPA) software (QIAGEN) and subcategorized into 4 functional groups. (D) Overlapping canonical pathway analysis generated by IPA. Black line indicates 4 genes and red line indicates more than 4 genes were shared between connected pathways. (E) Gene set enrichment analysis (GSEA) of proliferation-related gene sets with normalized enrichment score (NES) >1.5 and P < .05. (F) GSEA of osteogenesis-related gene sets with NES >1.5 and P < .05. (G) Left: heatmap of HSC-regulating genes in MSPCs from AML patients and controls. Gene signal intensities were central to the mean signal of individual gene symbols. Horizontal rows represent individual samples; vertical columns represent individual genes. Black indicates average signal intensity, brightest red represents 1.5-fold or higher upregulated, and brightest blue represents twofold or higher downregulated gene expression relative to the mean. Right: complete blood count of peripheral blood from corresponding patients at diagnosis including hemoglobin (Hb), absolute neutrophil count (ANC), and platelet (Plt). *P < .05 (determined by unpaired Student t test).
Previously published gene expression analyses of MSPCs from human AML bone marrow have been performed in in vitro expanded stromal cells. We aimed to assess the overlap of differently expressed genes between our gene expression array of freshly isolated MSPCs and in vitro expanded MSPCs previously published by our group.20 In the study by Li et al,20 only 29 genes were reported to be significantly altered in AML fibroblasts, of which 24 could be retrieved in our data, whereas only 5 genes showed similar expression behavior (supplemental Table 3). In summary, freshly isolated bone marrow MSPCs from AML patients have a distinct gene expression profile with a striking enrichment in proliferation-associated genes which supports the expansion of MSPCs in AML bone marrow as well as inhibition of osteogenesis and HSC-regulating gene expression profiles.
AML cells inhibit osteoblast mineralization
Our microarray analyses revealed that the niche activity of MSPCs in AML bone marrow is impaired with significantly decreased expression of bone growth and mineralization-related gene sets. We wondered whether the inhibition of osteoblast mineralization is specifically due to AML infiltration. We therefore established an in vitro coculture system in which mineralization is induced in immortalized human bone marrow MSPCs or in the osteolineage cell line SaOS2 in the presence of different human AML cell lines, primary human AML cells, or healthy human peripheral blood mononuclear cells (PBMNCs). Immortalized human bone marrow MSPCs (hereafter referred to as HuMSPCs) fulfilled all characteristics of bone marrow MSPCs (supplemental Figure 2A-D). In addition, HuMSPCs showed obvious calcium deposition after 11 days of mineralization induction (supplemental Figure 2E). As a model for osteoprogenitor cells, we used the SaOS2 cell line, which is derived from a human bone marrow osteosarcoma specimen and is often used as an in vitro model for osteogenesis.21,22 SaOS2 cells showed robust calcium deposition after 4 days of mineralization, indicating their osteolineage commitment (supplemental Figure 2E). After culturing either HuMSPC or SaOS2 cells with certain AML cell lines, osteoblast maturation and mineralization showed remarkable defects, whereas healthy human PBMNCs did not influence osteoblast differentiation and mineralization (Figure 3A-C; supplemental Figure 3A). To quantify the decrease in mineralization, we measured the absorbance of alizarin red stain. In fact, HuMSPCs cocultured with U937, K562, THP-1, and OCI-AML3 cell lines showed a twofold lower mineralization compared with controls. In contrast, KG-1, Kasumi-1, and MOLM-13 cell lines did not affect mineralization (Figure 3B). Similarly, U937 and K562 impaired SaOS2 mineralization by more than a twofold decrement in alizarin red stain (Figure 3C). Given the different proliferation rates of AML cell lines, we aimed to exclude any influence on osteoblast differentiation in dependence of cell density by adjusting the cell numbers with respect to their doubling time and plating serial cell dilutions. We demonstrated that inhibition of osteoblast mineralization is not influenced by different proliferation kinetics of AML cell lines (supplemental Figure 3B). To further interrogate the specificity of myeloid cells to inhibit osteoblast maturation and the possibility of dependencies from different proliferation rates of hematopoietic cells, we cocultured HuMSPCs and SaOS2 cells with a series of different cell lines of lymphoid neoplasms with different proliferation kinetics. Coculture of these lymphoid cell lines with SaOS2 stromal cells did not lead to significant inhibition of osteoblast mineralization (supplemental Figure 3C), even at the highest plated cell density (data not shown), although co-culturing HuMSPCs with Jurkat and MEC-1 cells led to a significant inhibition of mineralization (supplemental Figure 3D). This indicates that inhibition of osteoblast maturation does not depend on proliferation rate, while not being definitively specific to AML. To emphasize the clinical relevance, we next cocultured primary human AML cells or healthy PBMNCs with HuMSPCs. In fact, coculture with 7 of 9 primary AML cells led to a significant inhibition of mineralization (Figure 3D). Of note, inhibition of mineralization did not correlate with either genetic or morphologic AML subtype. Importantly, coculture with PBMNCs from different healthy donors or primary T-cell acute lymphoblastic leukemia and chronic B-cell leukemia did not affect mineralization (supplemental Figure 3A,E). Furthermore, coculture of primary AML cells with primary bone marrow–derived MSPCs from non-leukemic donors showed significant inhibition of osteoblast mineralization in 4 of 6 AML samples, independent of the number of plated AML cells (supplemental Figure 3F).
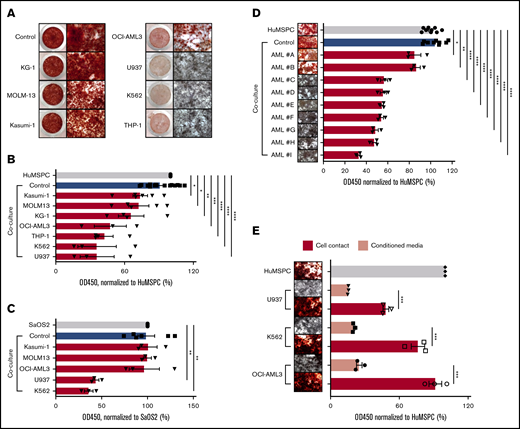
AML infiltration inhibits osteogenesis. (A) Alizarin red staining to detect calcium deposition after 14 days of induction of mineralization in HuMSPCs in the presence of PBMNCs from healthy donors (control) or different AML cell lines. Left: low-magnification image of a 48-well plate; right: images (4× objective) showing calcium deposition. (B) Colorimetric detection of alizarin red staining using absorbance at 450 nm to quantify calcium deposition in HuMSPCs after 14 days of induction of mineralization in the presence of healthy PBMNCs as controls or different AML cell lines (representative of 9 independent experiments). (C) Colorimetric detection of alizarin red staining using absorbance at 450 nm to quantify calcium deposition in SaOS2 cells after 7 days of induction of mineralization in the presence of controls or different AML cell lines (representative of 6 independent experiments). (D) Images (4× objective) of 96-well plate and colorimetric detection of alizarin red staining using absorbance at 450 nm to quantify calcium deposition in HuMSPCs after 14 days of induction of mineralization in the presence of controls or primary AML cells (3 replicates per sample). (E) Image (4× objective) and colorimetric detection of alizarin red staining using absorbance at 450 nm to quantify calcium deposition in HuMSPCs after 21 days of induction of mineralization in the presence of different AML cell lines or corresponding conditioned medium (representative of 3 independent experiments). Data are shown as mean ± SEM. *P < .05; **P < .01; ***P < .001; ****P < .0001 (determined by unpaired Student t test).
AML infiltration inhibits osteogenesis. (A) Alizarin red staining to detect calcium deposition after 14 days of induction of mineralization in HuMSPCs in the presence of PBMNCs from healthy donors (control) or different AML cell lines. Left: low-magnification image of a 48-well plate; right: images (4× objective) showing calcium deposition. (B) Colorimetric detection of alizarin red staining using absorbance at 450 nm to quantify calcium deposition in HuMSPCs after 14 days of induction of mineralization in the presence of healthy PBMNCs as controls or different AML cell lines (representative of 9 independent experiments). (C) Colorimetric detection of alizarin red staining using absorbance at 450 nm to quantify calcium deposition in SaOS2 cells after 7 days of induction of mineralization in the presence of controls or different AML cell lines (representative of 6 independent experiments). (D) Images (4× objective) of 96-well plate and colorimetric detection of alizarin red staining using absorbance at 450 nm to quantify calcium deposition in HuMSPCs after 14 days of induction of mineralization in the presence of controls or primary AML cells (3 replicates per sample). (E) Image (4× objective) and colorimetric detection of alizarin red staining using absorbance at 450 nm to quantify calcium deposition in HuMSPCs after 21 days of induction of mineralization in the presence of different AML cell lines or corresponding conditioned medium (representative of 3 independent experiments). Data are shown as mean ± SEM. *P < .05; **P < .01; ***P < .001; ****P < .0001 (determined by unpaired Student t test).
To gain more insight on the stage at which AML cells affect osteolineage differentiation, we added AML cell lines at different steps of MSPC/osteolineage differentiation. Strikingly, coculture before or during mineralization showed comparably strong inhibition of mineralization, whereas adding AML cells after induced mineralization did not affect mineralization, indicating that AML cells affect maturation at an early stage of osteogenesis (supplemental Figure 3G-J). Of note, only direct cell contact, but not AML-conditioned medium affected osteoblast mineralization (Figure 3E). Given the fact that AML cells interfere in the early stages of osteolineage differentiation through direct cell contact, we next aimed to identify the underlying mechanisms. For that, we took advantage of our microarray data. In fact, the WNT/β-catenin canonical pathway turned out to be significantly altered in bone marrow MSPCs after AML infiltration (Figure 4A). Therefore, we assessed the activity of the WNT/β-catenin pathway by measuring cytoplasmic β-catenin levels in MSPCs in the presence of different AML cell lines or healthy PBMNCs. Cytoplasmic β-catenin levels measured by flow cytometry were significantly decreased in HuMSPCs after 4 days of coculture with certain AML cell lines, but not with healthy PBMNCs (Figure 4B-C). Similar results were also found in SaOS2 after 4 days of coculture with different AML cell lines (supplemental Figure 4A). In fact, genetic downregulation of β-catenin by short hairpin RNA (shRNA) in HuMSPCs and SaOS2 cells led to significantly lower messenger RNA (mRNA) and protein levels of β-catenin and significant inhibition of mineralization in SaOS2 cells (Figure 4D; supplemental Figure 4B-C). However, after downregulation of β-catenin in HuMSPCs, cells could no longer be propagated in vitro. To prove the association between decreased WNT/β-catenin signaling and deficient osteolineage differentiation after AML infiltration, we increased cytoplasmic β-catenin levels by applying SKL2001, an AXIN inhibitor, which proved to efficiently increase cytoplasmic β-catenin levels.23 We added SKL2001 during induction of mineralization of HuMSPCs in the presence of different AML cell lines or healthy PBMNCs. Strikingly, adding SKL2001 successfully increased mineralization in HuMSPCs cocultured with THP-1 and OCI-AML3 cells compared with vehicle (dimethyl sulfoxide [DMSO]) by more than 1.5-fold (Figure 4E). Furthermore, treatment with SKL2001 increased cytoplasmic β-catenin levels at the end of mineralization (Figure 4F). SKL2001 did not increase cytoplasmic β-catenin level or mineralization in HuMSPCs cocultured with U937 (Figure 4E-F). Importantly, inhibition and restoration of mineralization through SKL2001 was comparable within different plated AML numbers (supplemental Figure 4D). Furthermore, genetically enforced overexpression of β-catenin in SaOS2 cells led to significantly higher mRNA levels and moderately increased protein levels of β-catenin (supplemental Figure 4E-F). In fact, overexpression of β-catenin led to a significantly higher degree of mineralization in the presence of certain AML cell lines, which almost reached levels of mono-cultured SaOS2 cells (Figure 4G). Again, after genetic overexpression of β-catenin in HuMSPCs, cells could no longer be cultured in vitro. In summary, AML cells affect osteolineage differentiation at an early stage in a cell contact–dependent manner by at least partly inhibiting cytoplasmic β-catenin.
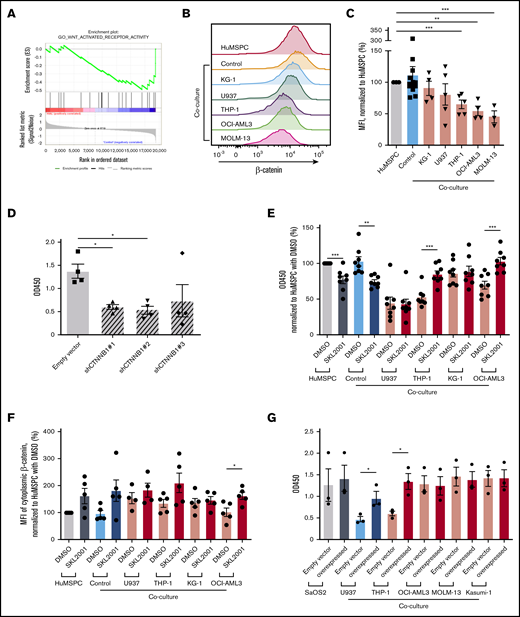
AML inhibits osteogenesis through interference in WNT/β-catenin pathway. (A) GSEA enrichment plot of GO_WNT_ACTIVATED_RECEPTOR_ACTIVITY of bone marrow MSPCs from AML patients and controls (NES, −1.55; P = .021; false discovery rate q = 0.114). (B) Representative overlay histogram of cytoplasmic β-catenin fluorescence intensity in HuMSPCs after mono- or coculture with healthy PBMNCs (controls) or indicated AML cell lines. (C) Mean fluorescence intensity (MFI) of cytoplasmic β-catenin levels in HuMSPCs after mono- or coculture with the indicated cells, normalized to HuMSPCs (representative of 5 independent experiments). (D) Colorimetric detection of alizarin red staining using absorbance at 450 nm to quantify calcium deposition in SaOS2 cells transduced with either empty vector or different CTNNB1 short hairpin RNAs after 7 days of induction of mineralization (representative of 4 independent experiments). (E) Colorimetric detection of alizarin red staining using absorbance at 450 nm to quantify calcium deposition in HuMSPCs after 14 days of induction of mineralization in the presence of healthy PBMNCs or different AML cell lines with either 10 µM SKL2001 or dimethyl sulfoxide (DMSO) (representative of 8 independent experiments; result is normalized to HuMSPCs with DMSO). (F) MFI of cytoplasmic β-catenin levels in HuMSPCs after mono- or coculture in the presence of healthy PBMNCs or different AML cell lines with either 10 µM SKL2001 or DMSO (representative of 5 independent experiments; result is normalized to HuMSPCs with DMSO). (G) Colorimetric detection of alizarin red staining using absorbance at 450 nm to quantify calcium deposition in SaOS2 cells transduced with either empty vector or CTNNB1 overexpressing plasmids after 7 days of induction of mineralization in the presence of different AML cell lines (representative of 3 independent experiments). Data are shown as mean ± SEM. *P < .05; **P < .01; ***P < .001 (determined by unpaired Student t test).
AML inhibits osteogenesis through interference in WNT/β-catenin pathway. (A) GSEA enrichment plot of GO_WNT_ACTIVATED_RECEPTOR_ACTIVITY of bone marrow MSPCs from AML patients and controls (NES, −1.55; P = .021; false discovery rate q = 0.114). (B) Representative overlay histogram of cytoplasmic β-catenin fluorescence intensity in HuMSPCs after mono- or coculture with healthy PBMNCs (controls) or indicated AML cell lines. (C) Mean fluorescence intensity (MFI) of cytoplasmic β-catenin levels in HuMSPCs after mono- or coculture with the indicated cells, normalized to HuMSPCs (representative of 5 independent experiments). (D) Colorimetric detection of alizarin red staining using absorbance at 450 nm to quantify calcium deposition in SaOS2 cells transduced with either empty vector or different CTNNB1 short hairpin RNAs after 7 days of induction of mineralization (representative of 4 independent experiments). (E) Colorimetric detection of alizarin red staining using absorbance at 450 nm to quantify calcium deposition in HuMSPCs after 14 days of induction of mineralization in the presence of healthy PBMNCs or different AML cell lines with either 10 µM SKL2001 or dimethyl sulfoxide (DMSO) (representative of 8 independent experiments; result is normalized to HuMSPCs with DMSO). (F) MFI of cytoplasmic β-catenin levels in HuMSPCs after mono- or coculture in the presence of healthy PBMNCs or different AML cell lines with either 10 µM SKL2001 or DMSO (representative of 5 independent experiments; result is normalized to HuMSPCs with DMSO). (G) Colorimetric detection of alizarin red staining using absorbance at 450 nm to quantify calcium deposition in SaOS2 cells transduced with either empty vector or CTNNB1 overexpressing plasmids after 7 days of induction of mineralization in the presence of different AML cell lines (representative of 3 independent experiments). Data are shown as mean ± SEM. *P < .05; **P < .01; ***P < .001 (determined by unpaired Student t test).
Deficient bone metabolism predicts clinical outcome
Given the fact that AML cells proved to specifically inhibit osteolineage maturation, we next quantified mineralized bone mass. Osteocalcin levels in the peripheral blood were shown to positively correlate with the number of osteoblasts and are used as a specific marker to measure bone turnover.6 On that basis, we prospectively measured peripheral blood osteocalcin levels in AML or non-Hodgkin lymphoma patients without bone marrow involvement as controls at first diagnosis before beginning any treatment. The median age was 62 years among AML patients and 61 years in controls; the distribution of sex was slightly shifted toward males in the control group (64.5% vs 43.1%). However, there were no significant differences in osteocalcin levels independent of sex or age; median, 13.3 ng/mL (IQR, 11.5-21.9 ng/mL; n = 45) in men vs 12.7 ng/mL (IQR, 7.3-17.3 ng/mL; n = 44) in women; median, 13.9 ng/mL (IQR, 10.3-20.7 ng/mL; n = 42) for those age 60 years or younger vs 12.3 ng/mL (IQR, 7.1-16.9 ng/mL; n = 47) for those older than age 60 years.
Strikingly, AML patients at first diagnosis showed significantly lower osteocalcin levels with a median of 12.15 ng/mL (IQR, 7.53-16.28 ng/mL; n = 58) compared with 17.2 ng/mL (IQR, 12.5-23.45 ng/mL; n = 31) in non-leukemic donors (Figure 5A). Among AML patients, a lower osteocalcin level of ≤11 ng/mL correlated with an eightfold higher peripheral and 1.5-fold higher bone marrow blast count compared with patients with osteocalcin levels >11 ng/mL (Table 1; Figure 5B-C). As for the outcome, osteocalcin levels of ≤11 ng/mL at first diagnosis went along with an inferior 1-year overall survival rate of 38.7%, with a median survival of 280 days compared with 66.8% 1-year overall survival in patients with higher osteocalcin levels, whereas the median overall survival was not reached (log-rank test P = .0339) (Figure 5D). Furthermore, in patients who received curative-intent intensive chemotherapy (∼70% of patients), low osteocalcin levels correlated with a trend for inferior relapse-free survival, which did not reach significance (log-rank test P = .1105) (Figure 5E). In the univariable analysis, only osteocalcin levels below 11 ng/mL and age older than 60 years significantly correlated with poor overall survival (supplemental Table 4). In summary, AML patients showed lower osteocalcin levels, indicating perturbed osteogenesis in AML bone marrow at first diagnosis whereby the degree of osteocalcin level proved to predict clinical outcome.
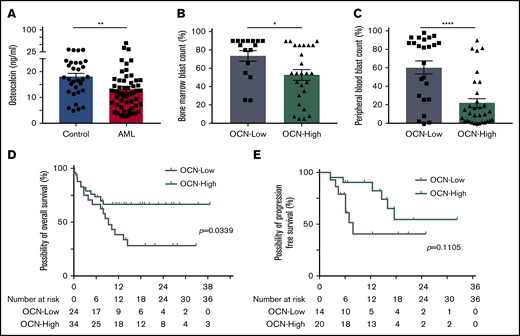
Deficient bone metabolism predicts clinical outcome. (A) Osteocalcin (OCN) levels measured in the peripheral blood of controls (n = 31) and AML patients (n = 58). Data are shown as mean ± SEM. **P < .01 (determined by Mann-Whitney U test). (B) Bone marrow blast infiltration in patients with osteocalcin level ≤11 ng/mL (OCN-Low, n = 16) and osteocalcin levels >11 ng/mL (OCN-High, n = 26). Data are shown as mean ± SEM. *P < .05 (determined by Mann-Whitney U test). (C) Peripheral blood blast percentage in patients with OCN-Low (n = 24) and OCN-High (n = 32). Data are shown as mean ± SEM. ****P < .0001 (determined by Mann-Whitney U test). (D) Overall survival of OCN-Low (n = 24) and OCN-High (n = 34). *P = .0339 (determined by log-rank test). (E) Relapse-free survival of AML patients receiving curative-intent treatment with OCN-Low (n = 14) and OCN-High (n = 20). P = .1105 (determined by log-rank test).
Deficient bone metabolism predicts clinical outcome. (A) Osteocalcin (OCN) levels measured in the peripheral blood of controls (n = 31) and AML patients (n = 58). Data are shown as mean ± SEM. **P < .01 (determined by Mann-Whitney U test). (B) Bone marrow blast infiltration in patients with osteocalcin level ≤11 ng/mL (OCN-Low, n = 16) and osteocalcin levels >11 ng/mL (OCN-High, n = 26). Data are shown as mean ± SEM. *P < .05 (determined by Mann-Whitney U test). (C) Peripheral blood blast percentage in patients with OCN-Low (n = 24) and OCN-High (n = 32). Data are shown as mean ± SEM. ****P < .0001 (determined by Mann-Whitney U test). (D) Overall survival of OCN-Low (n = 24) and OCN-High (n = 34). *P = .0339 (determined by log-rank test). (E) Relapse-free survival of AML patients receiving curative-intent treatment with OCN-Low (n = 14) and OCN-High (n = 20). P = .1105 (determined by log-rank test).
Demographic characteristics of AML patients grouped by osteocalcin level in peripheral blood
| Characteristic | Osteocalcin ≤11 ng/mL | Osteocalcin >11 ng/mL |
|---|---|---|
| No. of patients | 24 | 34 |
| Median age (range), y | 63 (25-79) | 61.5 (35-88) |
| Age >60 y, n (%) | 13 (54.2) | 18 (52.9) |
| Male, n (%) | 7 (29.2) | 18 (52.9) |
| European LeukemiaNet, n | 1 patient missing | 2 patients missing |
| Favorable | 3 | 3 |
| Intermediate I | 12 | 17 |
| Intermediate II | 2 | 4 |
| Unfavorable | 6 | 8 |
| Median blood counts (IQR) | ||
| WBC, ×109/L | 46.49 (6.53-122.79) | 2.75 (1.53-12.51) |
| Absolute neutrophil count, ×109/L | 0 (0-0.08) | 0.255 (0-0.525) |
| Peripheral blood blasts, % | 82.5 (29-88) | 10.5 (2.75-27) |
| Hemoglobin, g/dL | 9.1 (8.1-10.1) | 9.2 (8.25-10.93) |
| Platelet count, ×109/L | 55 (24.75-89) | 78 (40-130.75) |
| Median bone marrow (IQR) | ||
| Blast count by cytology, % | 85 (62.5-90); 8 patients missing | 55 (31.25-85); 8 patients missing |
| Treatment modality, n (%) | ||
| Curative | 17 (70.8) | 24 (70.6) |
| Palliative | 7 (29.2) | 10 (29.4) |
| Median days of follow-up (range) | 247 (10-982) | 355 (175-601) |
Discussion
Despite all of the novel therapies aimed at inhibiting mitochondrial, epigenetic, or protein kinase targets in patients with AML, the overall prognosis remains dismal. Murine models have elegantly uncovered the bidirectional influence of AML cells within the bone marrow microenvironment. These insights led to the assumption that therapy resistance and relapse are the result of aberrant regulation of leukemia-initiating cells through the niche. Therefore, it seems appealing to combine drugs that target cell-autonomous mechanisms with niche-targeted therapies. For that, a comprehensive understanding of the structural and functional characteristics of the bone marrow niche in human AML is required. Here, we have revealed that freshly isolated MSPCs from AML bone marrow show significant alterations, in particular with respect to their proliferation state and altered HSC and niche regulating capacities.
Previously, ex vivo expanded MSPCs from AML bone marrow also revealed aberrant gene expression and DNA methylation profiles compared with non-leukemic controls, with little overlap among the different studies.18,24-26 The feasibility of molecular characterization of freshly isolated MSPCs has been shown in human myelodysplastic syndrome, in which limited molecular overlap was found between in vitro cultured cells and their in situ mesenchymal counterparts.27 In line with that, we did not observe significant coherence of differently expressed genes between our data set and ex vivo expanded MSPCs, which supports a substantial impact of culture-induced artifacts on the gene expression profile. Our gene expression analyses revealed an enrichment for proliferation-associated genes, which agrees with a significantly increased number of AML-derived bone marrow MSPCs in situ. This is in line with previous findings in the murine AML bone marrow.5 Conversely, several human studies described a lower fibroblast colony-forming capacity in unfractionated AML bone marrow cells,24,28 but another more recent study that analyzed a large set of patient samples detected higher colony formation.29 These experiments do not account for the different cellularity and composition in AML bone marrow compared with non-leukemic controls, which might underestimate the colony-forming capacity in AML bone marrow–derived MSPCs. Next to their niche-regulating capacities, bone marrow MSPCs steer maintenance and retention of HSCs in the bone marrow. Murine models of AML revealed a dramatically impaired HSC-regulating capacity of bone marrow MSPCs.5,30,31 In fact, we also observed significantly lower expression of HSC-regulating genes in MSPCs from AML patients that correlates with an impaired capacity to maintain HSPCs in vitro, as our group has recently shown.20 The decreased expression of HSC-regulating factors were referred to a more differentiated state of MSPCs in murine AML.5,31 Our microarray data revealed decreased expression of osteogenesis-related gene sets in MSPCs isolated from AML patients correlating with AML-specific inhibition of osteoblast maturation in a cell contact–dependent manner in our coculture model. Loss of mature osteoblasts in AML has been observed in murine AML models.5,30,32,33 In addition, decreased osteogenic differentiation potential has been observed in AML patients,24 in particular for adverse-risk AML.29 In contrast, Battula et al34 observed an increased osteoblast maturation of human AML-derived MSPCs in the presence of certain AML cell lines. We have learned from murine models that myeloid neoplasms depend on distinct subsets of osteolineage cells. Deletion of Dicer-1 in osterix-expressing osteoprogenitor cells, but not osteocalcin-expressing mature osteoblasts, resulted in disruption of hematopoiesis with characteristics of myelodysplasia and AML.35 And more recently, specific deletion of col1(2.3)-expressing mature osteoblasts accelerated MLL-AF9 AML.6 Therefore, it seems to be important to distinguish between different stages of osteolineage maturation in the context of myeloid neoplasms. Our data indicate a defect in early-stage osteogenesis that is at least partially mediated through inhibition of cytoplasmic β-catenin, the key mediator of the WNT canonical signaling pathway, which plays a central role in osteogenesis.36 In AML, WNT/β-catenin signaling turned out to be essential for self-renewal of leukemia-initiating cells37 and is overexpressed in many AML samples.38 Therefore, targeting WNT/β-catenin signaling has been frequently approached in preclinical models and early-phase clinical trials. However, their effects on the microenvironment have not been evaluated and might result in opposite actions on leukemogenesis.
That altered niche features have prognostic value has been reported in a study by Kim et al28 in which AML patients who relapsed early had more CD146+ MSPCs at first diagnosis compared with those who attained remission. Here we discovered that the AML-induced inhibition of mature osteoblasts is reflected by lower peripheral blood osteocalcin levels at first diagnosis, which predict long-term outcomes in patients with AML. To what extent leukemia progression can be delayed by restoring osteoblast maturation is still pending. These novel insights into the human AML bone marrow microenvironment have helped translate findings from preclinical models and detect new targets that might pave the way for niche-targeted therapies in AML patients with the ultimate goal of eradicating leukemia-initiating cells.
For original data, please contact maher.hanoun@uk-essen.de.
Acknowledgments
The authors thank the staff at the Imaging Center Essen imaging facility for their assistance with expert cell sorting and imaging, and staff at the Institute of Pathology of the University Hospital Essen for help with staining.
This work was supported by a grant from the José Carreras Leukemia Foundation (DJCLS 01SP/2017 Foundation).
Authorship
Contribution: Y.C. designed and performed experiments, analyzed data, and helped write the manuscript; Y.Z. analyzed clinical data; L.A performed experiments and analyzed data; L.M.H. and H.H. performed knockdown and overexpression of β-catenin; K.W.S. and S.B. assisted with histology analyses; B.G. provided HuMSPCs and provided valuable input on the manuscript; L.K.-H. performed microarray analysis; A.S. assisted with image analysis, discussed data, and provided valuable input on the manuscript; U.D. and H.C.R. discussed the data and provided valuable input on the manuscript; and M.H. designed, performed, and supervised the study, discussed the data, and helped write the manuscript.
Conflict-of-interest disclosure: The authors declare no competing financial interests.
Correspondence: Maher Hanoun, Department of Hematology, University Hospital Essen, University of Duisburg-Essen, Hufelandstr 55, 45147 Essen, Germany; e-mail: maher.hanoun@uk-essen.de.

