

Key Points
TP53 mutations correlate with enhanced immune infiltration and high levels of actionable immune checkpoints in AML.
TP53 mutations associate with complete responses to flotetuzumab, an investigational immunotherapy, in R/R AML.

Abstract
Somatic TP53 mutations and 17p deletions with genomic loss of TP53 occur in 37% to 46% of acute myeloid leukemia (AML) with adverse-risk cytogenetics and correlate with primary induction failure, high risk of relapse, and dismal prognosis. Herein, we aimed to characterize the immune landscape of TP53-mutated AML and determine whether TP53 abnormalities identify a patient subgroup that may benefit from immunotherapy with flotetuzumab, an investigational CD123 × CD3 bispecific dual-affinity retargeting antibody (DART) molecule. The NanoString PanCancer IO360 assay was used to profile 64 diagnostic bone marrow (BM) samples from patients with TP53-mutated (n = 42) and TP53-wild-type (TP53-WT) AML (n = 22) and 45 BM samples from patients who received flotetuzumab for relapsed/refractory (R/R) AML (15 cases with TP53 mutations and/or 17p deletion). The comparison between TP53-mutated and TP53-WT primary BM samples showed higher expression of IFNG, FOXP3, immune checkpoints, markers of immune senescence, and phosphatidylinositol 3-kinase-Akt and NF-κB signaling intermediates in the former cohort and allowed the discovery of a 34-gene immune classifier prognostic for survival in independent validation series. Finally, 7 out of 15 patients (47%) with R/R AML and TP53 abnormalities showed complete responses to flotetuzumab (<5% BM blasts) on the CP-MGD006-01 clinical trial (NCT #02152956) and had significantly higher tumor inflammation signature, FOXP3, CD8, inflammatory chemokine, and PD1 gene expression scores at baseline compared with nonresponders. Patients with TP53 abnormalities who achieved a complete response experienced prolonged survival (median, 10.3 months; range, 3.3-21.3 months). These results encourage further study of flotetuzumab immunotherapy in patients with TP53-mutated AML.
Introduction
Acute myeloid leukemia (AML) is a molecularly and clinically heterogeneous disease. The patients with the poorest outcomes are those with refractory disease, including individuals with primary induction failure (PIF) who fail initial induction attempts.1 Complex karyotypes, including deletions affecting chromosome arm 17p, frequently coexist with TP53 mutations and define a “very unfavorable” subgroup of AML with a 5-year relapse-free survival (RFS) and overall survival (OS) of 0%.2-4 Somatic TP53 mutations and deletions of 17p, to which TP53 is mapped, occur in 8% to 10% of de novo AML5-7 and in up to 37% to 46% of patients with adverse-risk cytogenetics and treatment-related myeloid neoplasms.2,8 Furthermore, patients with mutated TP53 and/or 17p deletion tend to be older and have low performance status, and therefore, only a few of them are candidates for allogeneic hematopoietic stem cell transplantation (HSCT), which offers the highest curative potential.9 Response rates to standard-of-care (SOC) cytarabine-based induction chemotherapy in patients with TP53-mutated AML range between 14% and 42%, with a median OS of 2 to 12 months.2,5 In the relapsed and refractory (R/R) setting, where TP53 mutations are highly prevalent, response rates to standard salvage cytotoxic regimens are <20%.2,10,11
Emerging evidence implicates mutant TP53, in addition to its well-characterized function as a tumor suppressor, in activating genes involved in immune responses and inflammation, including chemokines, cytokines, and extracellular matrix modulators.12 A recent analysis of The Cancer Genome Atlas (TCGA) transcriptomic data from 10 000 nonhematologic tumors has indicated that TP53 mutations correlate with increased leukocyte infiltration across 30 diverse cancer types and are enriched in the C1 (wound healing) and C2 (interferon-γ [IFN-γ] dominant) immune subtypes.13 Importantly, higher proportions of PD-L1–expressing CD8+ T cells, higher tumor mutational burden, and increased expression of T-cell effector genes and IFN-γ–related genes associate with favorable responses to pembrolizumab immunotherapy in patients with TP53-mutated lung cancer.14
We have recently identified microenvironmental immune gene sets that capture elements of both type I– and IFN-γ–driven biology and stratify newly diagnosed AML into an immune-infiltrated and an immune-depleted subtype.15 Our immune classifier increased the accuracy of survival prediction in patients receiving cytarabine-based induction chemotherapy beyond the current capabilities of individual molecular markers. Herein, we aimed to investigate whether TP53 mutations shape the immune landscape of AML and whether they identify patients that derive benefit from flotetuzumab, an investigational CD123 × CD3 bispecific dual-affinity retargeting antibody (DART) molecule.16
Materials and methods
Patient demographics and study approval
Patient and disease characteristics as well as induction treatment regimens are summarized in Table 1. TP53 mutational status is detailed in supplemental Tables 1 and 2. The first wet-laboratory cohort consisted of 40 primary bone marrow (BM) samples from patients with newly diagnosed, TP53-mutated AML treated with curative intent (SAL cohort). The second wet-laboratory cohort included 24 primary BM samples from patients with newly diagnosed AML treated with curative intent (Bologna cohort; 2 cases with mutated TP53). The third wet-laboratory cohort consisted of 45 primary BM samples from patients with PIF, early-relapse AML (duration of complete remission 1 [CR1] <6 months), and late-relapse AML (duration of CR1 ≥6 months) treated with flotetuzumab at the recommended phase 2 dose (500 ng/kg per day) on the CP-MGD006-01 clinical trial (NCT #02152956). Patients with prior HSCT were ineligible. Fifteen patients from the flotetuzumab cohort harbored TP53 mutations or 17p deletions with genomic loss of TP53. Patients received a lead-in dose of flotetuzumab during week 1, followed by 500 ng/kg per day during weeks 2 to 4 of cycle 1 and a 4-day on/3-day off schedule for cycle 2 and beyond. Disease status was assessed by modified International Working Group criteria.17 Specifically, complete responses were defined as either CR, CR with partial hematological recovery (CRh), CR with incomplete hematological recovery (CRi), or morphological leukemia-free state (MLFS) at the end of cycle 1. Other responses were defined as either partial response (>50% decrease in BM blasts from baseline or decrease to 5% to 25% BM blasts) or other benefit (>30% reduction of BM blasts from baseline) at the end of cycle 1. Human studies were approved by the institutional review boards at SAL (Germany) and the University of Bologna (Italy), and by the institutional review boards of the centers participating to the flotetuzumab immunotherapy clinical trial. Written informed consent was received from all participants prior to inclusion in the study.
Patient series
| Wet laboratory | In silico | ||
|---|---|---|---|
| SAL | Bologna | TCGA* | |
| No. of patients | 40 | 24 | 147 |
| Males/females, n | 26/14 | 17/7 | 81/66 |
| Age, n | |||
| 0-14 y | 0 | 0 | 0 |
| 15-39 y | 2 | 3 | 27 |
| 40-59 y | 13 | 12 | 45 |
| >60 y | 25 | 9 | 75 |
| WBC count at presentation, median (range), ×103/μL | 10.55 (0.8-218.5) | 45 (1.5-153) | 20 (1-297) |
| Percentage of BM blasts, median (range) | 63.7 (30-90) | 16.5 (0.4-57) | 72 (11-99) |
| Cytogenetic risk group, n (%) | |||
| ELN favorable | 0 (0) | 6 (26.1) | 17 (12) |
| ELN intermediate | 0 (0) | 7 (30.4) | 96 (65) |
| ELN adverse | 40 (100) | 5 (21.7) | 32 (22) |
| NA | 0 (0) | 5 (21.7) | 2 (1) |
| TP53 status | |||
| Mutated | 40 | 2 | 14 |
| WT | 0 | 22 | — |
| Not tested/not available | — | — | 133 |
| Induction chemotherapy | |||
| 7 + 3 | 5 | 2 | 113 |
| Fludarabine based | — | 8 | — |
| Daunorubicin + cytarabine | 21 | 0 | — |
| MAV | 12 | 5 | — |
| HMAs | — | 3 | 14 |
| Lenalidomide | 1 | — | 9 |
| Other | 1 | 6 | 11 |
| Cohort-wide OS (mo from diagnosis), median (range) | 5.06 (0.03-158.3) | 16.5 (0.3-57) | 15.5 (0.1-118.1) |
SAL, Studien-Allianz Leukämie; ELN, European Leukemia-Net; HMAs, hypomethylating agents; MAV, mitoxantrone, cytarabine, and etoposide; WBC, white blood cell.
Cases of newly diagnosed nonpromyelocytic AML with RNA-sequencing data and clinical annotation.
Details on immune gene expression profiling, in silico data sources, gene set enrichment analysis, in vitro propagation of AML cell lines and flow cytometry-based assays are provided in the supplemental Appendix and in previous publications.15,18
Statistical analyses
Descriptive statistics included calculation of mean, median, standard deviation, and proportions to summarize study outcomes. Comparisons were performed with the Mann-Whitney U test for paired or unpaired data (2 sided), as appropriate, or with the analysis of variance with correction for multiple comparisons. A 2-tailed P < .05 was considered to reflect statistically significant differences. The log-rank (Mantel-Cox) test was used to compare survival distributions. OS was computed from the date of diagnosis to the date of death. RFS was measured from the date of first CR to the date of relapse or death. Subjects lost to follow-up were censored at their date of last known contact. IBM SPSS Statistics (version 24) and GraphPad Prism (version 8) were used for statistical analyses.
Results
TP53 mutational status correlates with immune infiltration in TCGA-AML cases
We first asked whether the expression of known AML drivers, including TP53, correlates with the immune composition and functional orientation of the BM tumor microenvironment (TME). To address this hypothesis, we retrieved RNA-sequencing data with cytogenetic and clinical annotation, including RFS and OS, from adult patients with newly diagnosed, nonpromyelocytic AML profiled in the TCGA project (n = 147 cases available through cBioPortal for Cancer Genomics; n = 118 cases with information on prognostic molecular lesions). Signature scores that identify immune subtypes of AML with poor sensitivity to induction chemotherapy and worse clinical outcomes were derived from messenger RNA (mRNA) expression, as previously published (supplemental Table 1),15,19 and included the tumor inflammation signature (TIS), an established predictor of response to immune checkpoint blockade in solid tumors.20,21 ELN intermediate cases with information on NPM1 mutational status and FLT3-ITD were further subclassified into molecular low risk (NPM1 mutations without FLT3-ITD) and molecular high risk (NPM1 wild-type [WT] with FLT3-ITD).22 TP53 mutations (8 missense, 3 frameshift, 3 splice site, 1 nonsense, and 1 homozygous deletion) were present in 14 patients (lollipop plot in supplemental Figure 1A and supplemental Table 2). TP53-mutated cases harboring comutations in genes with known prognostic relevance in AML, such as DNMT3A and TET2,23-25 were excluded from the analysis (supplemental Figure 1B). As expected, median OS from diagnosis was 4.5 months in TCGA cases with mutated TP53 compared with 18.5 months in patients with other prognostic molecular lesions (hazard ratio [HR, 3.43; P < .0001; supplemental Figure 1C).
As shown in Figure 1A-B, TP53-mutated AML cases showed higher immune infiltration, a higher number of mutations, and a higher fraction of genome altered (fraction of copy-number–altered chromosome regions out of measured regions), consistent with the role of mutant TP53 in promoting genomic instability,26 compared with patients harboring other high-risk molecular features (NPM1 WT with FLT3-ITD) and patients with low or intermediate risk. The TIS score was significantly higher in TP53-mutated cases relative to cases with molecular lesions associated with favorable clinical outcomes (NPM1 mutations without FLT3-ITD) and cases with clonal hematopoiesis of indeterminate potential (CHIP)–defining mutations in ASXL1, TET2, and DNMT3A (P < .0001; Figure 1C). Overall, the higher IFN-γ signaling, inflammatory chemokine, and lymphoid scores in patients with TP53 mutations suggested a higher degree of immune infiltration and the activation of IFN-γ–related signaling pathways (Figure 1C). TP53 alterations commonly occur in patients with complex karyotype (CK) AML.4 As shown in Figure 1D, the TIS, IFN-γ signaling, inflammatory chemokine, and lymphoid signature scores were higher in TP53-mutated AML than CK AML with WT TP53. This observation suggests that changes in immune gene expression are unlikely to be attributable to chromosome gains and losses.
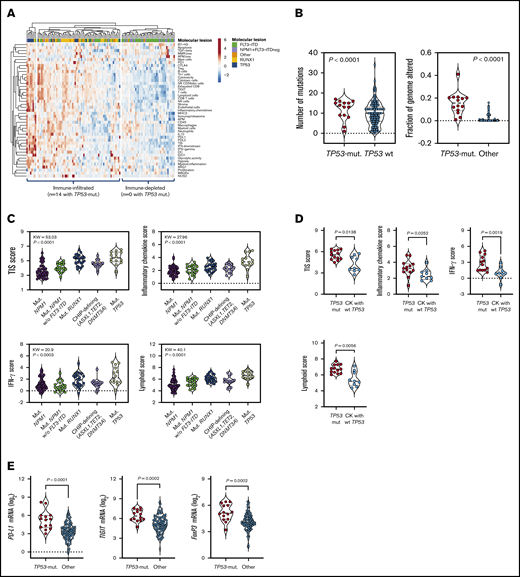
TP53 mutations correlate with an immune-infiltrated TME in TCGA-AML. (A) Heatmap of immune-cell-type–specific scores and biological activity scores in TCGA-AML cases with information on prognostic molecular lesions (n = 118; unsupervised hierarchical clustering; Euclidean distance; complete linkage). ClustVis, an online tool for clustering of multivariate data, was used for data analysis and visualization.47 The optimal number of clusters was defined through silhouette scoring using an open-source machine learning toolkit (Orange3, version 3.25.0). FLT3-ITD, fms-like tyrosine kinase 3 internal tandem duplication; NPM1, nucleophosmin-1. ELN intermediate cases were further subclassified into molecular low-risk cases (NPM1 mutations without FLT3-ITD) and molecular high-risk cases (NPM1 WT with FLT3-ITD).22 (B) Fraction of genome altered in TCGA-AML cases with TP53 mutations (n = 14) and other prognostic molecular lesions (n = 104). Bars denote median values. Data were retrieved through cBioPortal and were compared using the Mann-Whitney U test for unpaired determinations. (C) Box plots showing immune signature scores in TCGA-AML cases with TP53 mutations (n = 14) and other prognostic molecular lesions (n = 19 with NPM1 mutations; n = 22 with RUNX1 mutations; n = 48 with FLT3-ITD without NPM1 mutations; n = 15 with CHIP-defining mutations). Data were compared using the Kruskal-Wallis test for unpaired determinations with Bonferroni’s correction for multiple comparisons. (D) TIS, inflammatory chemokine, IFN-γ, and lymphoid signature scores in TCGA cases with TP53 mutations with (n = 9 cases) or without a CK (n = 13 cases) for whom immune gene signature scores could be computed. Data were compared using the Mann-Whitney U test for unpaired determinations. (E) Expression of FOXP3 and immune checkpoints PD-L1 and TIGIT in TCGA-AML cases with TP53 mutations (n = 14) and other prognostic molecular lesions (n = 104). Bars denote median values. Data were compared using the Mann-Whitney U test for unpaired determinations. ND, not determined.
TP53 mutations correlate with an immune-infiltrated TME in TCGA-AML. (A) Heatmap of immune-cell-type–specific scores and biological activity scores in TCGA-AML cases with information on prognostic molecular lesions (n = 118; unsupervised hierarchical clustering; Euclidean distance; complete linkage). ClustVis, an online tool for clustering of multivariate data, was used for data analysis and visualization.47 The optimal number of clusters was defined through silhouette scoring using an open-source machine learning toolkit (Orange3, version 3.25.0). FLT3-ITD, fms-like tyrosine kinase 3 internal tandem duplication; NPM1, nucleophosmin-1. ELN intermediate cases were further subclassified into molecular low-risk cases (NPM1 mutations without FLT3-ITD) and molecular high-risk cases (NPM1 WT with FLT3-ITD).22 (B) Fraction of genome altered in TCGA-AML cases with TP53 mutations (n = 14) and other prognostic molecular lesions (n = 104). Bars denote median values. Data were retrieved through cBioPortal and were compared using the Mann-Whitney U test for unpaired determinations. (C) Box plots showing immune signature scores in TCGA-AML cases with TP53 mutations (n = 14) and other prognostic molecular lesions (n = 19 with NPM1 mutations; n = 22 with RUNX1 mutations; n = 48 with FLT3-ITD without NPM1 mutations; n = 15 with CHIP-defining mutations). Data were compared using the Kruskal-Wallis test for unpaired determinations with Bonferroni’s correction for multiple comparisons. (D) TIS, inflammatory chemokine, IFN-γ, and lymphoid signature scores in TCGA cases with TP53 mutations with (n = 9 cases) or without a CK (n = 13 cases) for whom immune gene signature scores could be computed. Data were compared using the Mann-Whitney U test for unpaired determinations. (E) Expression of FOXP3 and immune checkpoints PD-L1 and TIGIT in TCGA-AML cases with TP53 mutations (n = 14) and other prognostic molecular lesions (n = 104). Bars denote median values. Data were compared using the Mann-Whitney U test for unpaired determinations. ND, not determined.
The expression of actionable immune checkpoints (PD-L1 and TIGIT) and genes associated with a highly immune-suppressed TME, such as the regulatory T (Treg) cell transcription factor FOXP3, was higher in TP53-mutated cases (Figure 1E; P values adjusted for multiple testing). Gene set enrichment analysis using published gene sets from landmark studies characterizing CD8+ T-cell dysfunction in AML (supplemental Table 3),27 as well as curated gene sets from the Molecular Signature Database, indicated functional enrichment of an immune senescence–related 8-gene set in TCGA-AML cases with TP53 mutations (supplemental Figure 2A-B). In contrast, no enrichment was observed in TP53-mutated cases when probing gene sets defining T-cell exhaustion (supplemental Figure 2A). The enrichment of TP53-mutated BM samples with CD8+ T cells, Treg cells, and other innate and adaptive immune cell types was validated using CIBERSORT, a deconvolution algorithm that allows the enumeration of 22 functionally defined hematopoietic cell subsets from gene expression profiles, including T-cell subsets, naive and memory B cells, plasma cells, natural killer cells, and myeloid-cell subsets (supplemental Figure 2C).28 The increased T-cell frequency in TP53-mutated AML (n = 3) compared with TP53-WT AML (n = 13) and BM samples from healthy donors (n = 4) was also confirmed using publicly available single-cell RNA-sequencing datasets (GSE116256; supplemental Figure 3).29
Primary BM samples from patients with TP53-mutated AML express inflammatory and IFN-related gene sets
We next compared immune gene expression profiles between bulk BM specimens from patients with TP53-mutated (n = 42) and TP53-WT AML (n = 22). The predicted functional consequences of TP53 mutations (84% missense; Figure 2A) are listed in supplemental Table 4 and were inferred using the IARC TP53 database (http://p53.iarc.fr/) and prior knowledge.30,31 These data are in agreement with the reported frequency of TP53 missense mutations (83.7%) in the German-Austrian AML series.32 Our set of predefined immune-cell-type–specific scores and biological activity scores distinguished patients with TP53-mutated AML from individuals with TP53-WT AML, as highlighted by data dimensionality reduction using principal-component analysis (Figure 2B). The frequency of TP53-mutated cases in patients with high, intermediate, and low immune infiltration was 87% (n = 20/23), 75% (n = 21/28), and 8% (n = 1/13), respectively (Figure 2C). We also computed scores that capture frequently dysregulated signaling pathways in cancer using predefined sets of relevant genes. As shown in Figure 2D, TP53-mutated cases expressed higher amounts of NF-κB, JAK/STAT, and phosphatidylinositol 3-kinase (PI3K)-Akt signaling molecules relative to BM samples from patients with TP53-WT AML. In contrast, DNA damage repair genes as well as Hedgehog and Wnt signaling pathway genes were upregulated in TP53-WT compared with TP53-mutated AML (Figure 2E). These findings are congruent with previous studies showing that TP53 is a suppressor of canonical Wnt signaling in solid tumors.33 TP53-mutated AML also expressed IFNG, FOXP3, PD-L1, LAG3, CD8A, PTGER4, and GZMB (Figure 2F), a molecule recently associated with features of exhaustion and senescence in AML-infiltrating CD8+ T cells27 and with worse clinical outcomes.15
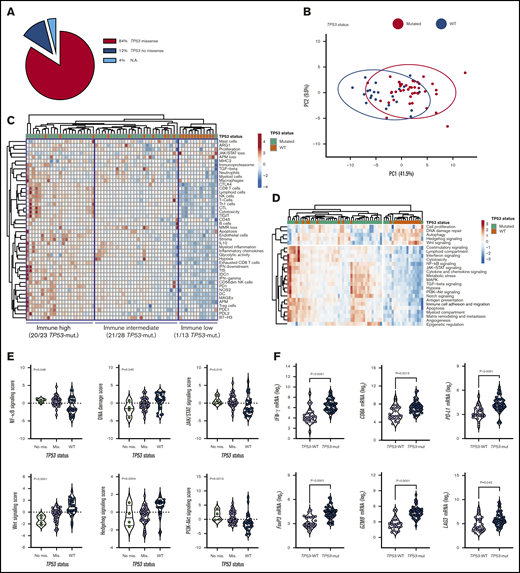
TP53-related cancer pathways and expression of actionable immune checkpoints in patients with TP53-mutated AML (SAL and Bologna cohorts). (A) TP53 mutations were categorized as missense or no missense (frameshift, splice site and nonsense) using the IARC TP53 database (http://p53.iarc.fr/) and based on prior knowledge.30,31 (B) Principal-component (PC) analysis of 770 immune genes (IO 360 panel) in patients with TP53-mutated (n = 42) and TP53WT AML (n = 22). Points are colored by TP53 mutational status (mutated, red; WT, blue). ClustVis was used for data analysis and visualization. (C) Heatmap of immune-cell-type–specific and biological activity scores in patients with TP53-mutated and TP53-WT AML (unsupervised hierarchical clustering; Euclidean distance; complete linkage). The number of TP53-mutated cases in each immune cluster (high, intermediate, and low) is indicated. ClustVis, an online tool for clustering of multivariate data, was used for data analysis and visualization. (D) Heatmap of cancer pathway scores in patients with TP53-mutated and TP53-WT AML (unsupervised hierarchical clustering; Euclidean distance; complete linkage). (E) Cancer pathway scores in patients with TP53-mutated and TP53-WT AML. Bars denote median values. Data were compared using the Kruskal-Wallis test for unpaired determinations. (F) Box plots summarizing the expression of negative immune checkpoints and immune genes related to T-cell infiltration, regulatory T cells, and cytolytic activity in patients with TP53-mutated and TP53-WT AML. Bars denote median values. Data were compared using the Mann-Whitney U test for unpaired determinations. NA, not available; PI3K, phosphatidylinositol 3-kinase.
TP53-related cancer pathways and expression of actionable immune checkpoints in patients with TP53-mutated AML (SAL and Bologna cohorts). (A) TP53 mutations were categorized as missense or no missense (frameshift, splice site and nonsense) using the IARC TP53 database (http://p53.iarc.fr/) and based on prior knowledge.30,31 (B) Principal-component (PC) analysis of 770 immune genes (IO 360 panel) in patients with TP53-mutated (n = 42) and TP53WT AML (n = 22). Points are colored by TP53 mutational status (mutated, red; WT, blue). ClustVis was used for data analysis and visualization. (C) Heatmap of immune-cell-type–specific and biological activity scores in patients with TP53-mutated and TP53-WT AML (unsupervised hierarchical clustering; Euclidean distance; complete linkage). The number of TP53-mutated cases in each immune cluster (high, intermediate, and low) is indicated. ClustVis, an online tool for clustering of multivariate data, was used for data analysis and visualization. (D) Heatmap of cancer pathway scores in patients with TP53-mutated and TP53-WT AML (unsupervised hierarchical clustering; Euclidean distance; complete linkage). (E) Cancer pathway scores in patients with TP53-mutated and TP53-WT AML. Bars denote median values. Data were compared using the Kruskal-Wallis test for unpaired determinations. (F) Box plots summarizing the expression of negative immune checkpoints and immune genes related to T-cell infiltration, regulatory T cells, and cytolytic activity in patients with TP53-mutated and TP53-WT AML. Bars denote median values. Data were compared using the Mann-Whitney U test for unpaired determinations. NA, not available; PI3K, phosphatidylinositol 3-kinase.
We next analyzed the immune transcriptomic profile at the gene level, and we identified a set of 34 differentially expressed (DE) immune genes at a false discovery rate <0.01 between patients with TP53-mutated and TP53-WT AML (Figure 3A-B; supplemental Table 5). The TP53 immune signature genes have not been previously implicated in the TP53 pathway (supplemental Figure 4A). Neutrophil chemoattractants (proinflammatory CXCL1, CXCL2, and CXCL8 or IL8) and IFN-inducible molecules such as CCL2, IL33, IL6, OASL, and RIPK2 were more highly expressed in TP53-mutated compared with TP53-WT patients. The DE genes exhibited enrichment of Gene Ontology and Kyoto Encyclopedia of Genes and Genomes pathways related to inflammatory responses, cellular response to cytokine stimuli, response to stress, cytokine-cytokine receptor interactions, and interleukin-17 (IL-17)–mediated and tumor necrosis factor–mediated signaling (Figure 3C; supplemental Table 6).
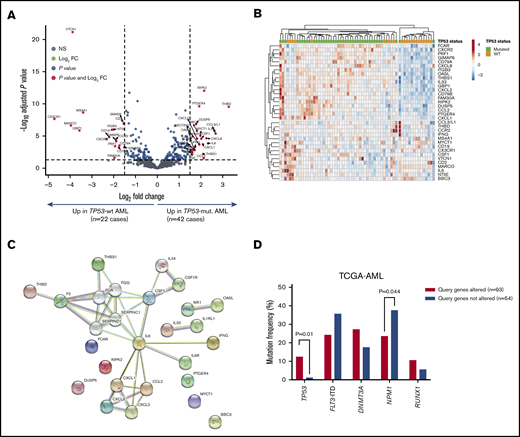
Identification of a TP53-related immune gene set in patients with TP53-mutated AML (SAL and Bologna cohorts). (A) Volcano plot (R package version 1.4.0) showing DE genes (P threshold = .01; log2 fold change ≥1.5) between patients with TP53-mutated (n = 42) and TP53-WT AML (n = 22). B) Heatmap displaying the 34 genes with the greatest differential expression between patients with TP53-mutated and TP53-WT AML (P threshold = .01; log2 fold change ≥1.5). ClustVis, an online tool for clustering of multivariate data, was used for data analysis and visualization. (C) Analysis of functional protein association networks using STRING (https://string-db.org/). Top 10 molecules interacting with DE genes between TP53-mutated and TP53-WT AML are shown together with their predicted mode of action (highest-confidence interaction scores >0.900). Network nodes (query proteins) represent proteins produced by a single protein-coding gene locus. White nodes represent second shells of interactors. Empty and filled nodes indicate proteins of unknown or partially known 3-dimensional structure, respectively. Edges represent protein-protein associations. Line shapes denote predicted modes of action. (D) Correlation between abnormalities of genes in the TP53 immune classifier and prognostic molecular lesions, including TP53 mutations, in TCGA-AML cases. Data were retrieved and analyzed using cBioPortal for Cancer Genomics (http://www.cbioportal.org/) and were compared using the Fisher's exact test. NS, not significant.
Identification of a TP53-related immune gene set in patients with TP53-mutated AML (SAL and Bologna cohorts). (A) Volcano plot (R package version 1.4.0) showing DE genes (P threshold = .01; log2 fold change ≥1.5) between patients with TP53-mutated (n = 42) and TP53-WT AML (n = 22). B) Heatmap displaying the 34 genes with the greatest differential expression between patients with TP53-mutated and TP53-WT AML (P threshold = .01; log2 fold change ≥1.5). ClustVis, an online tool for clustering of multivariate data, was used for data analysis and visualization. (C) Analysis of functional protein association networks using STRING (https://string-db.org/). Top 10 molecules interacting with DE genes between TP53-mutated and TP53-WT AML are shown together with their predicted mode of action (highest-confidence interaction scores >0.900). Network nodes (query proteins) represent proteins produced by a single protein-coding gene locus. White nodes represent second shells of interactors. Empty and filled nodes indicate proteins of unknown or partially known 3-dimensional structure, respectively. Edges represent protein-protein associations. Line shapes denote predicted modes of action. (D) Correlation between abnormalities of genes in the TP53 immune classifier and prognostic molecular lesions, including TP53 mutations, in TCGA-AML cases. Data were retrieved and analyzed using cBioPortal for Cancer Genomics (http://www.cbioportal.org/) and were compared using the Fisher's exact test. NS, not significant.
The DE genes that we identified in primary BM samples were further assessed in silico for potential prognostic value in TCGA-AML cases. Data were accessed, analyzed and visualized using the cBio cancer genomics portal.34 Abnormalities of the 18 immune genes that were overexpressed in patients with TP53-mutated AML (by default, mRNA upregulation, amplification, deep deletion and missense mutations) significantly correlated with TP53 mutational status (P = .041; Figure 3D), higher immune infiltration, and expression of immune checkpoints and IFN signaling molecules (Figure 4A-B). Importantly, RFS and OS estimates were significantly worse for TCGA-AML patients with abnormalities in query genes (median RFS and median OS, 11.4 months) compared with patients without abnormalities in query genes (median RFS, 24.1 months; median OS, 27.0 months; P = .0068 and P = .0009, respectively; Figure 4C). By contrast, the 16 immune genes that were downregulated in patients with TP53-mutated AML (supplemental Table 5) carried no prognostic significance (supplemental Figure 5). Taken together, these findings suggest that the immunological TME of TP53-mutated AML is inherently proinflammatory and IFN-γ dominant and that these molecular features are associated with poor clinical outcomes.
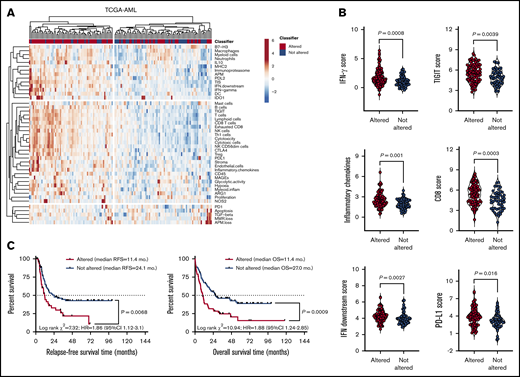
Upregulated genes in the TP53 immune gene classifier correlate with immune infiltration in TCGA-AML cases. (A) Heatmap of immune-cell-type–specific scores and biological activity scores (unsupervised hierarchical clustering; Euclidean distance; complete linkage) in TCGA-AML cases with (n = 93) or without (n = 54) abnormalities in the DE genes (TP53 immune classifier) between patients with TP53-mutated (n = 42) and TP53-WT AML (n = 22). Abnormalities were defined as mRNA upregulation, gene amplification, deep deletion, and missense mutations relative to the gene’s expression distribution in all profiled AML samples. Abnormalities in only 1 gene used in the cBioPortal query (by default, nonsynonymous mutations, fusions, amplifications, and deep deletions) were sufficient to define that particular patient sample as “altered." (B) Expression of IFN-γ signaling molecules, immune checkpoints, and markers of T-cell infiltration in TCGA-AML cases with or without abnormalities in the TP53 classifier genes. Bars denote median values. (C) Abnormalities in the 18 upregulated immune genes in the TP53 classifier in pretreatment BM samples from TCGA-AML cases. Data were retrieved, analyzed, and visualized using cBioPortal.34 The Kaplan-Meier method was used to generate survival curves, which were compared using a log-rank test.
Upregulated genes in the TP53 immune gene classifier correlate with immune infiltration in TCGA-AML cases. (A) Heatmap of immune-cell-type–specific scores and biological activity scores (unsupervised hierarchical clustering; Euclidean distance; complete linkage) in TCGA-AML cases with (n = 93) or without (n = 54) abnormalities in the DE genes (TP53 immune classifier) between patients with TP53-mutated (n = 42) and TP53-WT AML (n = 22). Abnormalities were defined as mRNA upregulation, gene amplification, deep deletion, and missense mutations relative to the gene’s expression distribution in all profiled AML samples. Abnormalities in only 1 gene used in the cBioPortal query (by default, nonsynonymous mutations, fusions, amplifications, and deep deletions) were sufficient to define that particular patient sample as “altered." (B) Expression of IFN-γ signaling molecules, immune checkpoints, and markers of T-cell infiltration in TCGA-AML cases with or without abnormalities in the TP53 classifier genes. Bars denote median values. (C) Abnormalities in the 18 upregulated immune genes in the TP53 classifier in pretreatment BM samples from TCGA-AML cases. Data were retrieved, analyzed, and visualized using cBioPortal.34 The Kaplan-Meier method was used to generate survival curves, which were compared using a log-rank test.
Truncating TP53 mutations correlate with enhanced IFN-γ and inflammatory signaling in AML cell lines
It has recently been shown that TP53 missense mutations in AML carry a gene signature of TP53 inactivation.32 Having previously identified IFN-γ–related microenvironmental signatures that correlate with chemotherapy resistance in AML,15 we performed in vitro modeling experiments with commercial AML cell lines to elucidate the potential impact of missense TP53 mutations on IFN signaling. DNA single-nucleotide variant amplicons, RNA and protein lysates were prepared as detailed in Materials and Methods. The inter-assay reproducibility of RNA and protein measurements is shown in supplemental Figure 6A. KG-1 cells harbor a sequence change (c.672+1G>A) that affects a donor splice site in intron 6 of the TP53 gene, resulting in a loss of protein function. Kasumi-1 AML cells harbor a known missense mutation of TP53 (R248Q). In agreement with this knowledge, TP53 protein and RNA were not detected in KG-1 cells (supplemental Figure 6B). The single-nucleotide variant assay confirmed the presence of TP53 (R248Q) mutations in control HuT-78 cells (data not shown), in accordance with available knowledge from the COSMIC database (https://cancer.sanger.ac.uk/cosmic).
A list of DE genes between KG-1 and Kasumi-1 cells was generated by considering false discovery rate <0.01 and ≥1.7-fold change (Figure 5A). Specifically, KG-1 AML cells with a truncating, loss-of-function TP53 mutation overexpressed genes involved in IFN-γ–mediated signaling and inflammation, including HGF, CIITA, PIM1, OSM, STAT1, and IRF1 (Figure 5B; supplemental Table 7). KG-1 cells also showed higher expression of PD-L1 and major histocompatibility complex class I, which are known to be regulated by IFN-γ, at the protein level compared with Kasumi-1 cells (supplemental Figure 6C). PI3K-Akt, NF-κB, JAK/STAT and TP53 pathway genes, as well as genes associated with T helper 17 (Th17) differentiation, were significantly enriched in KG-1 cells (Figure 5C; supplemental Table 8). Interestingly, supplemental Figure 6D highlights that 3 functions (pathways in cancer, PI3K-Akt signaling, and Th17 cell differentiation) were shared between DE genes in AML cells lines and DE genes in patients with TP53-mutated and TP53-WT AML. To assess whether the experimentally derived gene/protein signatures could be of potential significance for survival prediction, we split TCGA-AML cases into 2 subgroups with greater and lower than median gene expression. As shown in Figure 5D, genes/proteins overexpressed in KG-1 AML (n = 34; supplemental Table 7) predicted for shorter OS (HR, 1.7; log-rank P = .048). In contrast, genes upregulated in Kasumi-1 AML were unable to stratify patient survival (Figure 5D).
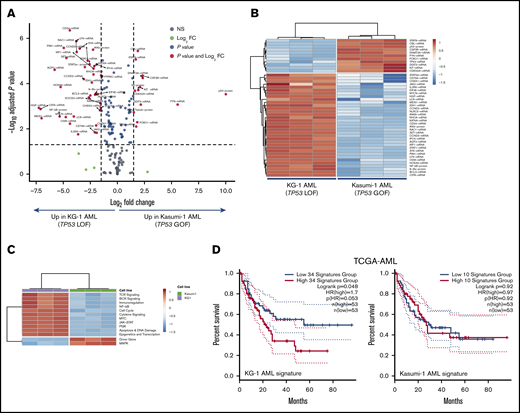
Integrated mRNA and protein profiling of AML cells lines with missense and truncating TP53 mutations. (A) Volcano plot (R package version 1.4.0) showing DE mRNA species and proteins between AML cell lines with missense (Kasumi-1 cells; p.R248Q; Broad Institute Cancer Cell Line Encyclopedia) and truncating (splice site) mutations of TP53 (KG-1 cells).30 (B) Heatmap of the top DE mRNA species and proteins between KG-1 AML and Kasumi-1 AML (unsupervised hierarchical clustering; Euclidean distance; complete linkage). ClustVis, an online tool for clustering of multivariate data, was used for data analysis and visualization.47 (C) Heatmap of signaling pathway scores in KG-1 and Kasumi-1 cells (unsupervised hierarchical clustering; Euclidean distance; complete linkage). Signature scores were calculated as detailed in "Materials and methods." (D) Kaplan-Meier estimate of survival from diagnosis in TCGA-AML cases with abnormalities in DE genes between KG-1 (n = 34) and Kasumi-1 cells (n = 10). KM curves (median split of signature scores) were generated using GEPIA2, an enhanced Web server for TCGA gene expression profiling and interactive analysis (http://gepia2.cancer-pku.cn/#index). Signature scores are calculated as the mean value of log2 transcripts per million. GEPIA2 uses the log-rank (Mantel-Cox) test to compare survival distributions.
Integrated mRNA and protein profiling of AML cells lines with missense and truncating TP53 mutations. (A) Volcano plot (R package version 1.4.0) showing DE mRNA species and proteins between AML cell lines with missense (Kasumi-1 cells; p.R248Q; Broad Institute Cancer Cell Line Encyclopedia) and truncating (splice site) mutations of TP53 (KG-1 cells).30 (B) Heatmap of the top DE mRNA species and proteins between KG-1 AML and Kasumi-1 AML (unsupervised hierarchical clustering; Euclidean distance; complete linkage). ClustVis, an online tool for clustering of multivariate data, was used for data analysis and visualization.47 (C) Heatmap of signaling pathway scores in KG-1 and Kasumi-1 cells (unsupervised hierarchical clustering; Euclidean distance; complete linkage). Signature scores were calculated as detailed in "Materials and methods." (D) Kaplan-Meier estimate of survival from diagnosis in TCGA-AML cases with abnormalities in DE genes between KG-1 (n = 34) and Kasumi-1 cells (n = 10). KM curves (median split of signature scores) were generated using GEPIA2, an enhanced Web server for TCGA gene expression profiling and interactive analysis (http://gepia2.cancer-pku.cn/#index). Signature scores are calculated as the mean value of log2 transcripts per million. GEPIA2 uses the log-rank (Mantel-Cox) test to compare survival distributions.
We have recently shown that patients with IFN-γ–dominant AML are less likely to respond to induction chemotherapy.15 It has also been reported that IFN-inducible genes mediate resistance to genotoxic damage in solid tumor cell lines.35 To mimic a proinflammatory TME, KG-1 and Kasumi-1 cells were treated with 100 ng/mL IFN-γ for up to 24 hours. We initially confirmed the expression of CD119, the ligand-binding portion of the IFN-γ receptor, on AML cell lines using flow cytometry (supplemental Figure 7A). Transcriptional changes in response to exogenous IFN-γ were prompter and more robust in Kasumi-1 cells compared with KG-1 cells, as indicated by the higher number of DE transcripts (supplemental Figure 7B). Both the expression of IFN-γ target genes, including STAT1, NLRC5, IRF1, and ISG15 (supplemental Figure 7C), and IFN-γ–induced cytotoxicity (supplemental Figure 7D) were higher in Kasumi-1 cells, suggesting that cellular responses to IFN-γ are blunted in KG-1 cells with heightened basal IFN-γ signaling. Pretreatment with Prima-1MET, which restores the transcriptional transactivation function of mutant TP53, was associated with induction of cell death in Kasumi-1 cells (median 62% reduction of cell viability compared with 21% in KG-1 cells), suggesting the specificity of Prima-1MET for TP53 reactivation (supplemental Figure 7D). The occurrence of cytotoxicity after TP53 reactivation with Prima-1MET was antagonized by exogenous IFN-γ in Kasumi-1 cells, but not in KG-1 cells (supplemental Figure 7D), indicating that Prima-1MET-treated Kasumi-1 AML cells may receive prosurvival rather than cytotoxic signals as a result of IFN pathway activation. Finally, Kasumi-1 cells exhibited changes in gene expression in response to Prima-1MET, but not in response to the MDM2 inhibitor nutlin-3, including the upregulation of inhibitors of IFN signaling, such as SOCS1 and SOCS3, and targets for transactivation by TP53, such as FOS and PTGS2 (supplemental Figure 7E-F; supplemental Table 8). By contrast, transcriptomic changes were minimal in Prima-1MET–treated KG-1 AML cells (supplemental Table 9). In aggregate, in vitro experiments suggest that truncating TP53 mutations may correlate with heightened IFN signaling and with resistance to IFN-γ–induced cell cytotoxicity.
TP53-mutated patients with relapsed/refractory AML show evidence of antileukemic activity from salvage immunotherapy with flotetuzumab
We have previously shown that baseline IFN-γ–related mRNA profiles, including the TIS score, are associated with response to flotetuzumab immunotherapy in patients with PIF and early-relapse AML.15 We therefore correlated TP53 mutational status with immune landscapes and with complete responses to flotetuzumab in a cohort of 45 patients with R/R AML, including 15 patients with TP53 mutations and/or chromosome 17p deletions usually associated with loss of one allele of TP53 and mutation/loss of the other (Table 2). The immune landscape of 30/45 patients in this cohort has been presented in a previous publication.15 Baseline BM samples for immune gene expression profiling were available in 13 patients with TP53 mutations and/or genomic loss of TP53; among these, 77% (10/13) had increased immune infiltration in the TME, and only 23% (3/13) clustered in the immune-depleted subgroup (Figure 6A). Overall response rate (ORR: CR, CRi, MLFS, or partial response) in patients with TP53 mutations and/or 17p abnormalities was 60% (9/15), with 47% (7/15) achieving complete response (<5% BM blasts on study; Figure 6B). Individuals with TP53-mutated AML derived benefit from flotetuzumab immunotherapy when compared with patients with TP53-WT AML (60.0% ORR vs 33.3% ORR, respectively; P = .08; Figure 6C), although this difference failed to reach statistical significance, likely as a result of low patient numbers. In the TP53-mutated patient subgroup, the reduction of BM blasts relative to baseline averaged 51.2% (Figure 6B). Time on treatment and time to patient death and/or censoring are summarized in Figure 6D for individuals with TP53 mutations and/or 17p deletion, including 3 patients who proceeded to receive allogeneic HSCT. In patients harboring TP53 abnormalities who achieved a CR (CRi), median OS was 10.3 months (range, 3.3-21.3), suggesting that flotetuzumab immunotherapy may alleviate the negative prognostic impact of TP53 mutations. Notably, 2 patients with TP53 abnormalities had exceptional responses to flotetuzumab, with a CR duration >6 months (Figure 6D).
Patient characteristics (immunotherapy cohort)
| All patients (N = 45) | Patients with TP53 mutations and/or 17p abnormalities (n = 15*) | |
|---|---|---|
| Age, median (range), y | 61 (27-81) | 61 (27-81) |
| Males/females, n | 24/21 | 8/7 |
| AML risk stratification (2017 ELN), n (%) | ||
| Favorable | 3 (6.7) | 0 (0) |
| Intermediate | 8 (17.8) | 0 (0) |
| Adverse | 34 (75.6) | 15 (100) |
| Secondary AML, n (%) | 15 (33.3) | 7 (46.7) |
| No. of prior lines of therapy, median (range) | 2 (1-9) | 2 (1-4) |
BM samples from 13 out of 15 patients were available for immune gene expression profiling. All 15 patients with TP53 mutations/17p abnormalities were included in clinical analyses.
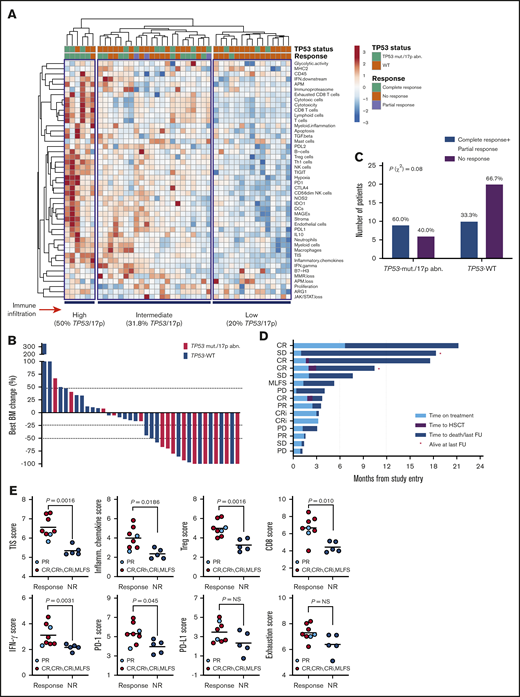
Immune landscape and immunotherapy response in patients with relapsed/refractory AML with and without TP53 mutations and/or 17p abnormalities. (A) Heat-map of immune cell type-specific scores and biological activity scores in patients with relapsed/refractory AML treated with flotetuzumab immunotherapy. ClustVis, an online tool for clustering of multivariate data, was used for data analysis and visualization.47 (B) Waterfall plot depicting changes in BM blasts after cycle 1 of flotetuzumab in patients with TP53 mutations and/or 17p deletion (n = 14; a BM sample was not available in 1 patient who progressed on treatment. (C) Response to flotetuzumab in relation to TP53 abnormalities (χ2 test). (D) Swimmer plot showing time on treatment and time to death and/or censoring in relation to clinical response in the 15 patients with TP53 mutations and/or 17p deletion with genomic loss of TP53. Response criteria are described in "Materials and methods." (E) TIS, inflammatory chemokine, Treg cell, CD8, IFN-γ, PD1, PD-L1, and exhaustion mRNA scores in baseline BM samples from patients with TP53 mutations and/or 17p deletion. Complete responses were defined as either CR, CR with partial hematological recovery, CRi, or MLFS. Data were compared using the Mann-Whitney U test for unpaired determinations. CR, complete remission; CRh, complete remission with partial hematopoietic recovery; FU, follow-up; OB, other benefit (>30% decrease of BM blasts relative to baseline); NR, no response; PD, progressive disease; SD, stable disease.
Immune landscape and immunotherapy response in patients with relapsed/refractory AML with and without TP53 mutations and/or 17p abnormalities. (A) Heat-map of immune cell type-specific scores and biological activity scores in patients with relapsed/refractory AML treated with flotetuzumab immunotherapy. ClustVis, an online tool for clustering of multivariate data, was used for data analysis and visualization.47 (B) Waterfall plot depicting changes in BM blasts after cycle 1 of flotetuzumab in patients with TP53 mutations and/or 17p deletion (n = 14; a BM sample was not available in 1 patient who progressed on treatment. (C) Response to flotetuzumab in relation to TP53 abnormalities (χ2 test). (D) Swimmer plot showing time on treatment and time to death and/or censoring in relation to clinical response in the 15 patients with TP53 mutations and/or 17p deletion with genomic loss of TP53. Response criteria are described in "Materials and methods." (E) TIS, inflammatory chemokine, Treg cell, CD8, IFN-γ, PD1, PD-L1, and exhaustion mRNA scores in baseline BM samples from patients with TP53 mutations and/or 17p deletion. Complete responses were defined as either CR, CR with partial hematological recovery, CRi, or MLFS. Data were compared using the Mann-Whitney U test for unpaired determinations. CR, complete remission; CRh, complete remission with partial hematopoietic recovery; FU, follow-up; OB, other benefit (>30% decrease of BM blasts relative to baseline); NR, no response; PD, progressive disease; SD, stable disease.
The TIS, inflammatory chemokine, Treg, CD8, IFN-γ, and PD1 gene expression scores, but not PD-L1 and markers of T-cell exhaustion (CD244, EOMES, LAG3, and PTGER4), were significantly higher at baseline in responders compared with nonresponders (Figure 6E), highlighting the association between response to T-cell engagers and a T-cell–inflamed TME. Interestingly, CD8B was the top-ranking gene associated with response to flotetuzumab, with an area under the receiver operating characteristic curve value of 0.879 (supplemental Figure 8A-B). The analysis of DE genes between responders with (n = 8) and without (n = 10) TP53 mutations and/or 17p deletion identified gene sets that were specifically upregulated (IFNG, CD8B, NKG7, and SOCS1) or downregulated (CTNNB1 and ANGPT1) in responders with TP53 abnormalities (supplemental Figure 8C-D).
Finally, flow cytometry analyses using paired BM aspirates and blood samples from a subgroup of patients with (n = 9) and without TP53 abnormalities (n = 26) showed a trend toward higher percentages of BM CD8+ T cells, but not blood CD8+ T cells, in individuals with TP53 mutations and/or 17p deletion (median 45.2% vs 28.9%; P = not significant; supplemental Figure 9). The expression of activation markers CD25 and HLA-DR was lower in BM-resident CD8+ and CD4+ T cells from patients with TP53 abnormalities compared with TP53-WT AML (supplemental Figure 10). Furthermore, the expression of IL-7 receptor (CD127), a marker for long-living memory T cells, was lower in TP53-mutated AML. In line with our findings in newly diagnosed TP53-mutated AML, the frequency of GZMB-expressing CD8+ and CD4+ T cells was higher in patients with TP53 abnormalities from the flotetuzumab cohort.
Discussion
Our multicohort AML study shows that patients with mutations in TP53, the most commonly inactivated gene in human cancer, exhibit higher CD8+ T-cell infiltration and IFN-γ signaling than AML subgroups with other risk-defining molecular lesions, including CHIP-related mutations in ASXL1, TET2, and DNMNT3A. Comparison of immune gene expression profiles between primary BM samples from patients with TP53-mutated and TP53-WT AML led to the identification of an immune gene set that is enriched in ontologies related to IFN-γ/inflammatory responses and IL-17/tumor necrosis factor–mediated signaling and that stratifies RFS and OS in a large cohort of TCGA-AML cases. Similar to previous studies that computed an expression signature of TP53-mutated breast cancer,36 our TP53-related immune gene set showed no overlap with known TP53 pathway genes, probably owing to variations in the type of mutants analyzed. IL-17 can exert protumoral roles early in inflammation and cancer initiation.37 IL-17 could contribute to multiple myeloma pathobiology by promoting tumor cell growth and colony formation, as well as increased myeloma growth in murine xenograft models.38 The correlation between TP53 deregulation and IL-17 overexpression remains to be confirmed in larger AML series.
In vitro modeling experiments using commercial AML cell lines with known mutations of TP53 allowed us to identify a set of DE RNAs/proteins between KG-1 and Kasumi-1 cells and suggest that TP53 inactivation, which is frequent among TP53 missense mutants,32,39 is associated with the upregulation of IFN-γ pathway molecules, Th17 genes, and intermediates involved in JAK/STAT and PI3K-Akt signaling and the proinflammatory NF-κB pathway. Abnormalities of the DE RNAs/proteins in the KG-1 AML signature correlated with higher BM immune infiltration and TP53 mutations in TCGA cases and were prognostic, as suggested by the significant separation of the survival curves. In sharp contrast, genes/proteins overexpressed in Kasumi-1 cells harboring a missense mutation of TP53 were unable to stratify survival in TCGA cases. Furthermore, IFN-γ induced more rapid and robust transcriptional changes in Kasumi-1 cells compared with KG-1 cells, with the latter also being less sensitive to IFN-γ–induced cytotoxicity. These mechanistic findings are in line with previous reports that correlate an increased expression of IFN-γ–related mRNA signature scores with poorer OS estimates in patients with AML treated with curative intent on a “7 + 3” chemotherapy backbone.15 Prolonged IFN-γ signaling can also activate a multigenic program conferring resistance to DNA damaging agents, including radiotherapy and chemotherapy, in preclinical models of solid tumors.40 Intriguingly, loss-of-function mutations of BRCA1, a tumor suppressor gene involved in DNA repair and maintenance of genome integrity, have also been shown to correlate with hyperactive IFN-γ signaling at baseline and with altered cellular responses of breast and ovarian cancer cells to IFN-γ, including partial resistance to cytotoxicity.41
Treatment of Kasumi-1 AML cells with Prima-1MET was associated with the upregulation of inhibitors of IFN signaling, including SOCS1 and SOCS3, suggesting that TP53 missense mutations, which carry a gene signature of TP53 inactivation,32 may lead to enhanced IFN signaling. Pharmacological TP53 reactivation is actively being pursued in patients with AML. MDM2 is an E3 ubiquitin ligase that binds to TP53 and induces its proteasomal degradation. Treatment with DS-5272, an inhibitor of the TP53-MDM2 interaction, in mouse models of AML was associated with the upregulation of inflammatory and IFN-associated genes, including PD-L1, and translated into enhanced antileukemia control.42 Whether TP53 reactivation in patients with cancer is associated with immune-mediated therapeutic effects remains to be established in future clinical trials.
Post-hoc analyses of our cohort of patients with R/R AML treated with flotetuzumab suggest that immunotherapy may be efficacious in the salvage setting in individuals with altered TP53 status, who had a mean 51.2% reduction of BM blasts and showed complete responses in 47% of cases.
Responders showed intermediate-to-high immune infiltration at baseline and higher TIS, inflammatory chemokine, Treg, IFN-γ, and CD8 T-cell scores, but not PD-L1 and markers of T-cell exhaustion, compared with nonresponders, suggesting that the presence of TP53 abnormalities does not hamper the response to T-cell engagers providing an inflammatory TME is present. Furthermore, both CD8B and IFNG were higher at baseline in responders with TP53 abnormalities compared with responders having TP53-WT AML. Genes previously implicated in T-cell exclusion from melanoma lesions, such as CTNNB1,43 and angiogenesis-mediated suppression of cell cytotoxicity (ANGPT1) were preferentially expressed in TP53-WT AML, potentially accounting for the observed differences in immune infiltration.
R/R patients with TP53 abnormalities that responded to flotetuzumab experienced a median OS of 10.3 months. Interestingly, 2 patients in the TP53-mutated cohort had exceptional responses to flotetuzumab, with a CR duration >6 months. The molecular and clinical determinants of extraordinary responses in patients with cancer are actively being investigated.44,45 Broader cohorts of TP53-mutated AML will be needed to identify immune correlates of unusual outcome in response to flotetuzumab and other investigational immunotherapies.
Our results also point to the establishment of an inherently immunosuppressive and IFN-γ–driven TME in patients with TP53-mutated AML. Previously described gene expression–based predictors of response to immune checkpoint blockade in solid tumors, such as the TIS score,20,21 as well as immune checkpoints PD-L1, TIGIT, and LAG3 and markers of immune senescence, were overexpressed in AML with TP53 mutations relative to other molecular subtypes. Some of the characterized genes may therefore contribute mechanistically to the poor prognosis associated with TP53-mutated AML through the induction of immune escape.46 Hence, patients with TP53 mutations might require combinatorial immunotherapy approaches that also target Treg cells and immune checkpoints, either concomitantly or sequentially.
In conclusion, our study shows that TP53 mutations in AML are associated with higher T-cell infiltration, expression of immune checkpoints, and IFN-γ–driven transcriptional programs. These gene expression profiles that have previously been shown to enrich in patients with chemotherapy resistance correlate with disease control in response to flotetuzumab immunotherapy.15 Our findings therefore encourage further studies of T-cell–targeting immunotherapeutic approaches in larger series of patients with AML who harbor this molecular lesion.
The data reported in this article have been deposited in the Gene Expression Omnibus database (accession number GSE146204). The results shown in this paper are in part based upon data generated by the TCGA Research Network (https://www.cancer.gov/tcga).
Acknowledgments
The authors thank Barbara Shepherd for providing medical writing support. The Study Alliance of Leukemia (www.sal-aml.org) is gratefully acknowledged for providing primary patient material and clinical data.
This work was supported by grants from the Qatar National Research Fund (NPRP8-2297-3-494) and the John and Lucille van Geest Foundation (S. Rutella) and by the National Institutes of Health, National Cancer Institute (Outstanding Investigator Award R35 CA210084 [J.F.D.] and Research Specialist Award R50 CA211466 [M.P.R.]).
Authorship
Contribution: J.K.D.-M. and S. Rutella contributed to the study concept and design; J.V., S. Reeder, S.E.C., T.H., and S. Rutella developed methodology; I.A., A.S.A., J.G., M.J.W., M.A., J.M., F.R., K.S., H.A., F.S., J.M.M., M.C., A.C., P.J.M.V., B.L., M.B., and J.F.D. acquired, consented, and managed patients and processed patient samples: C.L., J.V., S. Reeder, S.E.C., T.H., A.L., T.O.Y., M.P.R., G.A.F., F.S., J.M.M., P.J.M.V., B.L., I.G., M.B., J.F.D., J.K.D.-M., and S. Rutella analyzed and interpreted data; J.F.D. was principal investigator at Washington University (St. Louis, MO); B.L. was principal investigator at Erasmus University Medical Centre (Rotterdam, The Netherlands); C.L. and S. Rutella wrote the manuscript; C.L., J.V., S. Reeder, S.E.C., T.H., A.L., M.P.R., I.A., J.G., M.J.W., M.A., J.M., F.R., K.S., H.A., G.A.F., F.S., J.M.M., M.C., A.C., P.J.M.V., B.L., I.G., M.B., J.F.D., J.K.D.-M., and S. Rutella reviewed and/or revised the manuscript; and S. Rutella supervised the study.
Conflict-of-interest disclosure: J.M. and J.K.D.-M. are employees of MacroGenics (Rockville, MD). S.E.C. is an employee of NanoString Technologies (Seattle, WA). The remaining authors declare no competing financial interests. The patent “Bispecific CD123 × CD3 Diabodies for the Treatment of Hematologic Malignancies” (provisional application; attorney docket number 1301.0161P3) was filed 25 July 2019 and assigned serial number 62/878 368.
Correspondence: Sergio Rutella, John van Geest Cancer Research Centre, College of Science and Technology, Nottingham Trent University–Clifton Campus, Nottingham NG11 8NS, United Kingdom; e-mail: sergio.rutella@ntu.ac.uk.

