

Key Points
Expression of TNFR2 determines the sensitivity of primary B-cell acute lymphoblastic leukemia to RIP1-dependent cell death by SMs.
TNFR2 is functionally required for the induction of RIP1-dependent cell death in a ligand-independent manner.

Abstract
Despite major advances in the treatment of patients with acute lymphoblastic leukemia in the last decades, refractory and/or relapsed disease remains a clinical challenge, and relapsed leukemia patients have an exceedingly dismal prognosis. Dysregulation of apoptotic cell death pathways is a leading cause of drug resistance; thus, alternative cell death mechanisms, such as necroptosis, represent an appealing target for the treatment of high-risk malignancies. We and other investigators have shown that activation of receptor interacting protein kinase 1 (RIP1)–dependent apoptosis and necroptosis by second mitochondria derived activator of caspase mimetics (SMs) is an attractive antileukemic strategy not currently exploited by standard chemotherapy. However, the underlying molecular mechanisms that determine sensitivity to SMs have remained elusive. We show that tumor necrosis factor receptor 2 (TNFR2) messenger RNA expression correlates with sensitivity to SMs in primary human leukemia. Functional genetic experiments using clustered regularly interspaced short palindromic repeats/Cas9 demonstrate that TNFR2 and TNFR1, but not the ligand TNF-α, are essential for the response to SMs, revealing a ligand-independent interplay between TNFR1 and TNFR2 in the induction of RIP1-dependent cell death. Further potential TNFR ligands, such as lymphotoxins, were not required for SM sensitivity. Instead, TNFR2 promotes the formation of a RIP1/TNFR1-containing death signaling complex that induces RIP1 phosphorylation and RIP1-dependent apoptosis and necroptosis. Our data reveal an alternative paradigm for TNFR2 function in cell death signaling and provide a rationale to develop strategies for the identification of leukemias with vulnerability to RIP1-dependent cell death for tailored therapeutic interventions.
Introduction
Patients with refractory and/or relapsed acute lymphoblastic leukemia (ALL) have a dismal prognosis.1 Dysregulation of cell death pathways leading to deficient apoptosis is widely observed in cancer and represents a leading cause for therapy resistance and relapse in ALL.2 Although many current approaches directly target the oncogenic lesions to resensitize to apoptosis, activating alternative apoptosis-independent cell death mechanisms, such as necroptosis, may serve as attractive strategies for the treatment of high-risk malignancies.3-5
Necroptosis is a recently discovered form of programmed cell death with morphological features and genetic regulation distinct from apoptosis.6 Receptor interacting protein kinase 1 (RIP1) is a central regulator governing cell death by apoptosis and necroptosis, as well as survival and inflammation through the activation of NF-κB signaling.7 When ubiquitinated by cIAP1 and cIAP2, RIP1 maintains survival and inflammatory signaling.8,9 Upon depletion of cIAP1/2 using second mitochondria derived activator of caspases mimetics (SMs), deubiquitination of RIP1 activates a switch from prosurvival to prodeath signaling. Although the role of tumor necrosis factor receptor 1 (TNFR1) as a key upstream activator of RIP1-mediated cell death has been well established,6 TNFR2 activation typically leads to prosurvival and proinflammatory NF-κB signaling, and antagonizing TNFR2 has been suggested to convey antitumor effects.10 We showed earlier that the SM birinapant potently induces RIP1-dependent cell death by concurrent apoptosis and necroptosis in a subset of precursor B-cell ALL,3 and the great promise held by these agents was corroborated in preclinical models of drug-resistant and relapsed leukemia.3,11-13 However, successful clinical translation of novel targeted therapies requires the identification of molecular markers to preselect patients with a high likelihood to respond. Molecular determinants to predict sensitivity to SM are lacking, hindering clinical translation of these compounds. Therefore, we set out to identify the molecular mechanisms that determine sensitivity to SM as a basis to develop strategies that are useful for further development of clinical trials. We found TNFR2 expression to correlate with sensitivity to birinapant in primary relapsed ALL samples and to functionally confer sensitivity to necroptosis in a tumor necrosis factor-α (TNF-α)–independent, but TNFR1-dependent, manner.
Material and methods
Human samples
Primary human ALL samples were cryopreserved bone marrow aspirates of patients enrolled in the ALL-BFM 2000 and ALL-BFM 2009 studies, as well as the ALL-REZ-BFM 2002 study for the validation cohort. Informed consent was given in accordance with the Declaration of Helsinki, and approval was granted by the Ethics Commission of the Kanton Zürich (approval no. 2014-0383). Samples were classified as standard risk, medium risk, high risk, very high risk, morphological nonresponders, or relapse samples, according to the clinical criteria used in the ALL-BFM 2000 study.11
Cell lines
hTERT-immortalized primary bone marrow mesenchymal stromal cells (MSCs) were cultured in RPMI 1640 (Sigma-Aldrich; cat. no. R0883) supplemented with 10% fetal bovine serum (Sigma-Aldrich), 0.5% L-glutamine (Bio-Concept Laboratories), 0.5% penicillin-streptomycin (Life Technologies), and 1 µM hydrocortisone (Sigma-Aldrich; cat. no. H0888). Cells were incubated at 37°C and 5% CO2 and confirmed to be mycoplasma negative by polymerase chain reaction (PCR).
Patient-derived xenograft experiments
Patient-derived xenograft (PDX) cells were obtained by transplanting 106 cells IV into 7- to 12-week-old immunodeficient NOD/SCID/IL2rγnull (NSG) mice (male and female mice were used14 ). Engrafted ALL cells were collected from the spleen. Coculture experiments with MSCs and primary or PDX cells were performed under serum-free conditions in AIM-V (Life Technologies; cat. no. 12055-091).15 Cells were incubated at 37°C and 5% CO2. In vivo clustered regularly interspaced short palindromic repeats (CRISPR) selection experiments were performed as described previously.3 In short, 106 transduced PDX ALL cells were injected into NSG mice, and the engraftment was monitored weekly by staining peripheral blood after red blood cell lysis with human CD19-PE-Cy7 and human CD45–Alexa Fluor 647 and analyzing by flow cytometry (using a FACSCanto II flow cytometer; BD Biosciences) (see supplemental Table 5 for all antibody clone and supplier information). Birinapant was dissolved in 12% Captisol (Ligand Pharmaceuticals) with 0.1% Tris at pH 6.8 and given daily by intraperitoneal injection (30 mg/kg) during the indicated periods. Leukemia progression was monitored weekly, as described above. In vivo experiments were approved by the veterinary office of the Canton of Zurich.
Viability assays
2500 hTERT MSCs were plated in serum-free AIM-V medium (Life Technologies; cat. no. 12055-091). After 24 hours of incubation, 25 000 ALL cells were added. The cocultured cells were treated the following day, as indicated, using an HP D300 Digital Dispenser (Tecan). After 48 hours of treatment, live cells were stained with CyQUANT (Life Technologies; cat. no. C35012) and quantified using automated microscopy and multiparametric image analysis, as described previously.3,15
Immunoprecipitation
For immunoprecipitation, 25 to 30 million PDX cells were plated and treated, as indicated, in each case. The cells were collected, washed with cold phosphate-buffered saline, and lysed in RIPA buffer (150 mM NaCl, 20 mM Tris [pH 7.5], 1% NP-40, 1 mM EDTA [pH 8.0], 0.1% sodium dodecyl sulfate [SDS]) containing protease inhibitors (Roche Diagnostics; cat. no. 11836153001). Twenty microliters of lysate was kept for input control, and 5 μL of anti-TNFR1 was added to the rest. The lysates were incubated with the antibody at 4°C overnight and subsequently incubated with 50 μL of Dynabeads protein G (Life Technologies; cat. no. 1004D) at room temperature for 4 hours. The beads were washed 3 times with RIPA buffer, and the complex was eluted by adding 1× SDS loading buffer (62.5 nM Tris [pH 6.8], 1% SDS, 0.005% Bromophenol Blue, 4% glycerol, 1% 2-mercaptoethanol) and boiling at 95°C for 5 minutes.
Caspase-8 immunoprecipitation for ripoptosome analysis was performed as described previously16 with minor modifications. We used 20 to 25 million cells, 50 μL of protein G magnetic beads, and 1 μg of caspase-8 antibody.
Immunoblotting
For western blotting, 3 × 10⁵ cells were lysed in 1× SDS loading buffer. Cell lysates were separated by SDS–polyacrylamide gel electrophoresis (Bio-Rad; Criterion XT Precast Gels, 4% to 12% Bis-Tris, cat. no. 345-0125) and transferred onto nitrocellulose membranes (Bio-Rad; Trans-Blot Turbo transfer pack, cat. no. 170-4159). Membranes were blocked with 5% nonfat milk, or 5% bovine serum albumin in the case of cIAP2.
For the analysis of TNFR1 oligomers, western blotting was performed in nondenaturing (samples loaded without boiling) and nonreducing (SDS loading buffer prepared without 2-mercaptoethanol) conditions.
Quantitative real-time PCR
RNA was extracted using an RNeasy Mini Kit (QIAGEN; cat. no. 74106). Reverse transcription was performed with MultiScribe Reverse Transcriptase (Life Technologies; cat. no. 4311235). Real-time PCR was performed with TaqMan Gene Expression Master Mix (Applied Biosystems; cat. no. 436916) and the following probes from Life Technologies: TNFRSF1A (cat. no. Hs01042313), TNFRSF1B (cat. no. Hs00961749), cIAP2 (BIRC3; cat. no. Hs00985031), and GAPDH (cat. no. Hs02758991). PCR was performed using a 7900HT Fast Real-Time PCR System (Applied Biosystems) and SDS 2.3 software. The quantification was performed in triplicates.
Copy number variant quantitative PCR
Genomic DNA was extracted using a DNeasy Blood and Tissue Kit (QIAGEN; cat. no. 69506). Quantitative PCR was performed using PowerUp SYBR Green Master Mix (Life Technologies; cat. no. A25742) and 10 ng of DNA using a forward primer ending at the predicted CRISPR cut site (supplemental Table 3) and GAPDH as a control. PCR was performed using a 7900HT Fast Real-Time PCR System (Applied Biosystems) and SDS 2.3 software. The quantification was performed in triplicates and normalized to GAPDH.
Generation of lentiCRISPR constructs
Multicolor lentiCRISPR constructs were generated as previously published3,17 from the lentiCRISPR v1 plasmid18 (Addgene; cat. no. 49535). Various single guide RNA (sgRNA) sequences were tested; the most efficient, as determined by western blotting, were used for further experiments. The sgRNAs used for TNFR1, TNFR2, and TNF are listed in supplemental Table 4. The sgRNAs used for RIP1, RIP3, MLKL, caspase-8, and FADD were published previously.3
Next-generation sequencing of CRISPR-edited loci
Genomic DNA was extracted from wild-type (WT) and TNFR2-knockout (TNFR2ko) PDX cells using a DNeasy Blood and Tissue Kit (QIAGEN; cat. no. 69506). A 442-bp region surrounding the CRISPR target site was amplified by PCR using the primers TNFR2_NGS_F and TNFR2_NGS_R (supplemental Table 3) and Phusion High-Fidelity DNA Polymerase (Thermo Fisher Scientific; cat. no. F-530S) for subsequent amplicon deep sequencing. The locus-specific first-step PCR products were converted into Illumina Nextera XT libraries by second-step PCR. Subsequently, the Illumina MiSeq platform and a v2 500 cycles kit were used to sequence the libraries. The produced paired-end reads that passed Illumina’s chastity filter were subject to demultiplexing and trimming of Illumina adaptor residuals using Illumina’s real-time analysis software (no further refinement or selection). The quality of the reads was checked with the FastQC software (version 0.11.5; http://www.bioinformatics.babraham.ac.uk/projects/fastqc/). The paired-end reads were merged considering a minimum overlap of 15 bases. Merged sequences were quality filtered, allowing a maximum of 1 expected error per merged read and also discarding those containing ambiguous bases. The remaining reads were deduplicated, which means that unique sequences were identified and clustered, retaining the information on the size of the cluster. The cluster representatives were then globally aligned pairwise against the genomic reference region of the first-step PCR. Libraries and sequencing described in this section were performed by Microsynth AG (Balgach, Switzerland). We quantified the outcome of genome editing using CRISPResso (http://crispresso.rocks) run with default parameters19 and human TNFRSF1B, Gene ID: 7133 [NC_000001.11 (12166948..12209222)] as reference. All results were compared with those of unedited controls.
Generation of TNFR2 overexpression plasmid
The overexpression plasmid for TNFR2 was generated on the pRCDRMB-EF1-MCS-2A-Bleo backbone plasmid (a gift from Laura Lopez Garcia). IRES-GFP was cloned into the EcoRI site using IRES-GFP forward and reverse primers and In-Fusion HD cloning (Clontech; cat. no. 639648). The sequence for human Ig-Flag-TNFR2 was cloned from the Ps520 plasmid (kindly provided by Pascal Schneider) into the NheI site in the multiple cloning site by In-Fusion HD cloning using Ig-Flag-TNFR2 forward and reverse primers. All primers are listed in supplemental Table 3.
TNF-α ELISA
Six million PDX cells were lysed in 300 μL DISC lysis buffer (30 mM Tris/HCl [pH 7.5], 120 mM NaCl, 10% glycerol, 1% Triton X-100) containing complete protease inhibitors (Roche Diagnostics; cat. no. 11836153001). TNF-α enzyme-linked immunosorbent assay (ELISA) was performed with a human TNF-α Ready-Set-Go! ELISA kit (cat. no. 88-7346; eBioscience). Results were extrapolated to 100 μg of total protein, quantified using a Pierce BCA Protein Assay Kit (Thermo Fisher Scientific; cat. no. 23227).
Lentivirus production and transduction
Lentivirus was produced, as described previously,17 by transfecting 293T cells with psPAX2 (Addgene; cat. no. 12260), p.CMV.VSV.G plasmid (Addgene; cat. no. 8454), and each plasmid (lentiCRISPR or the TNFR2 overexpression construct) using polyethylenimine transfection reagent (Sigma Aldrich; cat. no. 408727). The cell supernatant was collected after 24 hours and added to the cells with Polybrene, 8 µg/mL final concentration (Sigma-Aldrich; cat no. H9268). Cells were incubated with the virus for 24 hours and washed 3 times with phosphate-buffered saline before in vivo transplantation.
Correlation of gene expression profiles and SM response
Gene expression profiles20 were correlated with responses ((half maximal inhibitory concentration [IC50]) to birinapant and LCL161 using Pearson correlation. Joint correlation coefficients were calculated from the sum of the Pearson coefficients; genes with significant (P < .05) correlation with IC550 were arranged as a function of decreasing joint correlation coefficients (top to bottom) and drug response IC50 values (left to right). All gene expression values are shown in a mean-centered and scaled heat map (R package NMF_0.20.6).
Statistical analyses
Results are shown as mean ± standard error of the mean (SEM) in bar graphs and viability assays. Statistical significance was determined with the Mann-Whitney U test using GraphPad Prism 5; values were considered significant at P < .05. For in vivo experiments, animals were randomized, and all were included in the analysis. Sample sizes (n) of mice and the number of biological repeats are indicated in the figure legends. The investigators were blinded regarding TNFR1 and TNFR2 expression for the samples tested in the experiment shown in Figure 2B-C.

TNFR2 predicts SM sensitivity. (A) Sensitivity of primary ALL samples in different risk categories, according to risk stratification in the AIEOP-BFM 2000 study, to birinapant. Numbers are cases with IC50 < 100 nM and the total analyzed cases. TNFR2 (TNFRRSF1B) expression20 from 17 primary samples correlated with the response (IC50) to birinapant (B) and LCL161 (C). TNFR2 (D) and TNFR1 (E) expression by quantitative real-time PCR from 12 responsive PDX samples (birinapant IC50 ≤ 100 nM) and 22 nonresponsive PDX samples (birinapant IC50 > 100 nM). MR/HR, medium risk/high risk; SR, standard risk; VHR, very high risk.
TNFR2 predicts SM sensitivity. (A) Sensitivity of primary ALL samples in different risk categories, according to risk stratification in the AIEOP-BFM 2000 study, to birinapant. Numbers are cases with IC50 < 100 nM and the total analyzed cases. TNFR2 (TNFRRSF1B) expression20 from 17 primary samples correlated with the response (IC50) to birinapant (B) and LCL161 (C). TNFR2 (D) and TNFR1 (E) expression by quantitative real-time PCR from 12 responsive PDX samples (birinapant IC50 ≤ 100 nM) and 22 nonresponsive PDX samples (birinapant IC50 > 100 nM). MR/HR, medium risk/high risk; SR, standard risk; VHR, very high risk.
Results
TNFR2 expression correlates with and predicts the response to SMs in ALL
Approximately 30% of B-cell ALL (B-ALL) samples across different risk groups respond to birinapant with an IC50 ≤ 100 nM,3 including a relevant proportion of very high risk and relapse cases (Figure 1A). To identify the molecular basis for this remarkable sensitivity to SMs in ALL3 and to identify molecular markers associated with the response, we correlated gene expression profiles of precursor B-ALL patient samples20 with the sensitivity to 2 SM drugs: birinapant and LCL161. We identified TNFRSF1B (TNFR2) and TNFRSF1A (TNFR1) among the highest correlating genes (Figure 1B-C; supplemental Figure 1A-C; supplemental Table 1). Corroborating our previous results,3 the expression of RIP1, RIP3, MLKL, or FADD did not correlate with SM activity (supplemental Figure 1A-C). Quantitative real-time PCR confirmed the significantly higher expression of TNFR1 and TNFR2 in responders (IC50 ≤ 100 nM) compared with nonresponders (IC50 > 100 nM) (Figure 1D-E), which remained unchanged upon treatment with birinapant (supplemental Figure 1D). Interestingly, the correlation between expression level and sensitivity was much stronger for TNFR2 than for TNFR1 (Figure 1D-E; supplemental Figure 1C), with a lower variance of expression for TNFR1.
To validate the correlation of TNFR2 expression with the SM response, we analyzed primary samples of an independent cohort of relapsed B-ALL (supplemental Table 1), in which we detected variable expression of TNFR1 and TNFR2 (Figure 2A; supplemental Table 2). Primary samples with high TNFR2 expression showed significantly higher sensitivity to birinapant compared with samples with low TNFR2 expression (median IC50, 37.4 vs 1310 nM; P = .02; Figure 2B-C), with a significant inverse correlation between TNFR2 expression and IC50 for this independent cohort (Pearson r = −0.71; P = .01) (supplemental Figure 1E). Supporting the hypothesis that the presence of TNFR2, as well as TNFR1, may be important for sensitivity to SM,13 1 sample with high TNFR2 expression, but very low TNFR1 expression, also showed lower sensitivity to SM (Figure 2A-B). We confirmed the stability of TNFR2 expression in PDX cells (supplemental Figure 1F). To determine the cell death program activated by birinapant downstream of RIP1, we used the caspase inhibitor zVAD and the RIP1 kinase inhibitor necrostatin (Nec-1s) and identified that 3 of 5 samples activated a mixed phenotype of apoptosis and necroptosis, whereas 1 sample was necroptotic and another was sensitive to Nec-1s (Figure 2D). This distribution mirrors the phenotype distribution that was observed previously in our primary cohort.3 Taken together, our data suggest that the messenger RNA expression level of TNFR2 may contribute to predicting the sensitivity of B-ALL to SM-induced RIP1-dependent death. The combination of phenotypic drug response profiling15 and TNFR2 expression analysis suggests a potential methodology to preselect responsive patients in a clinical setting.

Validation of association between TNFR2 and sensitivity to birinapant in an independent cohort. (A) Expression of TNFR1 and TNFR2 from the validation cohort (n = 44), with selected patients marked in blue (high TNFR2, n = 5) and red (low TNFR2, n = 5). (B) Response to birinapant for selected patients (n = 10). (C) Birinapant IC50 values. (D) Rescue from birinapant (48 hours, 50 nM) with zVAD (25 μM) and/or Nec-1s (25 μM). All quantifications are mean ± SEM and were derived from 1 experiment in triplicate for the indicated number of primary samples.
Validation of association between TNFR2 and sensitivity to birinapant in an independent cohort. (A) Expression of TNFR1 and TNFR2 from the validation cohort (n = 44), with selected patients marked in blue (high TNFR2, n = 5) and red (low TNFR2, n = 5). (B) Response to birinapant for selected patients (n = 10). (C) Birinapant IC50 values. (D) Rescue from birinapant (48 hours, 50 nM) with zVAD (25 μM) and/or Nec-1s (25 μM). All quantifications are mean ± SEM and were derived from 1 experiment in triplicate for the indicated number of primary samples.
TNFR1 and TNFR2 are required for the response to SM independently of NF-κB
To determine whether TNFR2 is functionally required for SM-induced cell death in ALL, we adapted our previously established CRISPR-based in vivo selection methodology3 (Figure 3A). Cells from 3 PDXs were transduced with fluorescently tagged lentiCRISPR constructs targeting TNFR2 or TNFR1 and transplanted into NSG mice. Treatment of xenografted mice with birinapant selectively enriched TNFR2-deficient leukemia cell populations (Figure 3B,F,I; supplemental Figure 2A). Likewise, TNFR1-deficient cells were also selected by birinapant treatment (Figure 3C,G,J), functionally implicating TNFR1 and TNFR2 in SM-induced death. Interestingly, TNFR1- and TNFR2-deficient cells showed a stable engraftment before birinapant treatment, indicating that ALL does not depend on TNFR signaling for proliferation (Figure 2B-C). In vitro drug-response analysis of the generated knockout PDX cells (supplemental Figure 2B-D,E-H) corroborated that TNFR1ko and TNFR2ko ALL were highly resistant to birinapant (Figure 3D,H,K). Importantly, reconstitution of TNFR2 expression in TNFR2ko patient–derived cells via lentiviral transduction of a GFP-tagged construct restored birinapant sensitivity (Figure 2E), further supporting the requirement for TNFR2 to activate RIP1-dependent cell death.

TNFR1 and TNFR2 are required for birinapant response. (A) Schematic diagram of CRISPR in vivo selection. Total engraftment (purple) and TNFR2ko BFP-positive (B) or TNFR1ko mCherry-positive (C) cells over the total engraftment for R-03 PDX cells. Data are representative of 3 mice per experiment. (D) In vitro birinapant response of WT, TNFR2ko, and TNFR1ko R-03 cells treated for 48 hours. (E) In vitro birinapant response after reconstitution of TNFR2 expression in TNFR2ko ALL cells. The same experiments were performed for PDX samples VHR-10 (E-H) and SR-13 (G-J), with 1 mouse per experiment (E-F,H-I). In vitro data (D,H,K) are derived from 3 independent experiments in triplicates; data are mean ± SEM. R, relapse.
TNFR1 and TNFR2 are required for birinapant response. (A) Schematic diagram of CRISPR in vivo selection. Total engraftment (purple) and TNFR2ko BFP-positive (B) or TNFR1ko mCherry-positive (C) cells over the total engraftment for R-03 PDX cells. Data are representative of 3 mice per experiment. (D) In vitro birinapant response of WT, TNFR2ko, and TNFR1ko R-03 cells treated for 48 hours. (E) In vitro birinapant response after reconstitution of TNFR2 expression in TNFR2ko ALL cells. The same experiments were performed for PDX samples VHR-10 (E-H) and SR-13 (G-J), with 1 mouse per experiment (E-F,H-I). In vitro data (D,H,K) are derived from 3 independent experiments in triplicates; data are mean ± SEM. R, relapse.
TNFR2 signaling can lead to activation of the canonical and noncanonical NF-κB pathways, as well as to inhibition of the canonical pathway through TRAF2 degradation.21 However, we could not detect consistent differences in canonical3 (phosphorylation of p65) or noncanonical NF-κB activation (as indicated by the cleavage of p100 to p52) between responsive and nonresponsive PDX samples (supplemental Figure 3A) or between WT and TNFR2ko PDX samples (supplemental Figure 3B). Furthermore, inhibiting NF-κB signaling using the compound BAY 11-7082 did not influence the sensitivity of PDX samples to birinapant (supplemental Figure 3C-E). This shows that the sensitizing effect of TNFR2 to RIP1-dependent cell death cannot be explained by differential activation of NF-κB signaling.
The ligand TNF-α is not required for the response to SM
Having identified the functional requirement for TNFR1 and TNFR2 in the response to birinapant (Figure 2), we investigated the implication of their ligand, TNF-α, in the induction of SM-induced cell death. TNF is generally expressed at low levels in B-ALL, regardless of birinapant sensitivity (Figure 4A) and does not increase after birinapant treatment.3 We performed CRISPR TNF-α knockout in PDX cells and in the supporting MSCs to generate a TNF-α–depleted cellular system (Figure 4B-C). Despite a significant reduction in TNF, we did not observe any effect on SM response for 3 PDX samples (Figure 4D), suggesting a TNF-α–independent mechanism and supporting our previous findings using TNF-α–neutralizing antibodies.3
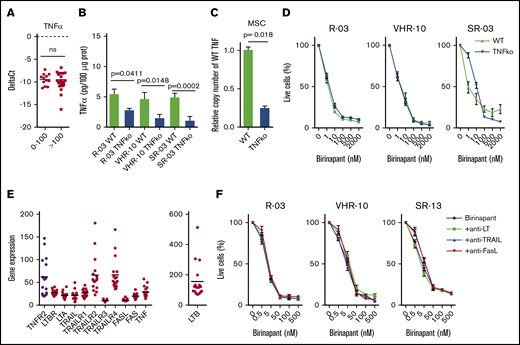
TNF-α is not required for birinapant response. (A) TNF-α expression by quantitative real-time PCR from 12 responsive PDX samples (birinapant IC50 ≤ 100 nM) and 22 nonresponsive PDX samples (birinapant IC50 > 100 nM). (B) Quantification of TNF-α by ELISA from cell lysates in WT and CRISPR-generated TNFko PDXs (3 independent experiments performed in duplicates). (C) Validation of TNFko MSCs by copy number variant quantitative PCR (2 experiments performed in triplicates). (D) Birinapant response curves for WT and TNFko PDX cells cocultured with TNFko MSCs (3 independent experiments performed in triplicates). (E) Gene expression of death receptor ligands and receptors for 17 primary B-ALL samples. (F) Birinapant response curves for PDX samples treated with neutralizing antibodies against lymphotoxin (LT; 0.5 μg/ml), TRAIL (10 ng/mL), and FasL (10 ng/mL) (3 independent experiments performed in triplicates). All quantifications are mean ± SEM. R, relapse.
TNF-α is not required for birinapant response. (A) TNF-α expression by quantitative real-time PCR from 12 responsive PDX samples (birinapant IC50 ≤ 100 nM) and 22 nonresponsive PDX samples (birinapant IC50 > 100 nM). (B) Quantification of TNF-α by ELISA from cell lysates in WT and CRISPR-generated TNFko PDXs (3 independent experiments performed in duplicates). (C) Validation of TNFko MSCs by copy number variant quantitative PCR (2 experiments performed in triplicates). (D) Birinapant response curves for WT and TNFko PDX cells cocultured with TNFko MSCs (3 independent experiments performed in triplicates). (E) Gene expression of death receptor ligands and receptors for 17 primary B-ALL samples. (F) Birinapant response curves for PDX samples treated with neutralizing antibodies against lymphotoxin (LT; 0.5 μg/ml), TRAIL (10 ng/mL), and FasL (10 ng/mL) (3 independent experiments performed in triplicates). All quantifications are mean ± SEM. R, relapse.
In addition to TNF-α, other cell death ligands are known to induce RIP1-dependent cell death.22 Therefore, we investigated the implication of the ligands TRAIL, FasL, lymphotoxin α and β, and their respective receptors (TRAILR1-4, Fas, and LTBR) in the response to birinapant. Lymphotoxin was a relevant candidate because it can interact with TNFR1 and TNFR2 when present in the form of lymphotoxin α3 homotrimers.22 Gene expression analyses of 17 precursor B-ALL patient samples revealed a generally low expression and small variance among patients for all of the investigated genes, with the exception of TRAILR2, TRAILR4, and LTB (Figure 4E). Neutralizing antibodies against lymphotoxin, TRAIL, or FasL did not rescue primary ALL samples from birinapant-induced cell death (Figure 4F), suggesting that the role of TNFR1 and TNFR2 in the response to SM is, strikingly, ligand independent.
TNFR2 promotes RIP1 recruitment to TNFR1 and cell death without affecting TNFR1 oligomerization
Based on the requirement of TNFR1, TNFR2, and RIP1 for the response of B-ALL to birinapant, we hypothesized that the different levels of TNFR2 in responders and nonresponders might influence the recruitment of RIP1 to TNFR1, as previously suggested by Chan et al.23 Under basal unstimulated conditions, low-level interactions between TNFR1 and RIP1 were detected as described previously in other cellular systems.24,25 After birinapant treatment, we observed a strong recruitment of RIP1 to TNFR1 in SM-sensitive WT ALL cells, which was diminished in TNFR2ko cells (Figure 5A; supplemental Figure 5A). Additionally, we detected cleaved RIP1 in TNFR1-containing complexes, a fragment produced by the proteolytic activity of caspase-8 (Figure 5A; supplemental Figure 5B). Interestingly, we observed a decrease in the total amount of TNFR1 in birinapant-responsive PDX cells after treatment that could be rescued by inhibiting the TNF-α converting enzyme using TAPI-0, indicating that the decrease was due to TNFR1 shedding (supplemental Figure 5C).

TNFR2 promotes recruitment of RIP1 to TNFR1. (A) Endogenous TNFR1 immunoprecipitation (IP) in WT and TNFR2ko R-03 (responder) PDX cells treated with birinapant, as indicated. (B) Lysates and TNFR1 immunoprecipitation of sensitive (R-03, IC50 < 100 nM) and resistant (VHR-01, IC50 > 1000 nM) ALL. (C) WB in nonreducing nondenaturing conditions for TNFR1 monomers (mono), dimers, and trimers (Tri) in responder and nonresponder PDX (left panel), and WT and TNFR2ko R-03 PDX cells (right panel) treated as indicated. (D) Analysis of RIP1 phosphorylation at serine-166 (pRIP1) in WT and TNFR1ko ALL samples. (E) Lysates and caspase-8 (Casp8) IP (ripoptosome) for WT and TNFR2ko (R2ko) R-03 and VHR-10 PDX cells treated with birinapant, as indicated. Data are representative of 3 independent experiments. Bir/bir, birinapant; 10′, 10 minutes; 30′, 30 minutes.
TNFR2 promotes recruitment of RIP1 to TNFR1. (A) Endogenous TNFR1 immunoprecipitation (IP) in WT and TNFR2ko R-03 (responder) PDX cells treated with birinapant, as indicated. (B) Lysates and TNFR1 immunoprecipitation of sensitive (R-03, IC50 < 100 nM) and resistant (VHR-01, IC50 > 1000 nM) ALL. (C) WB in nonreducing nondenaturing conditions for TNFR1 monomers (mono), dimers, and trimers (Tri) in responder and nonresponder PDX (left panel), and WT and TNFR2ko R-03 PDX cells (right panel) treated as indicated. (D) Analysis of RIP1 phosphorylation at serine-166 (pRIP1) in WT and TNFR1ko ALL samples. (E) Lysates and caspase-8 (Casp8) IP (ripoptosome) for WT and TNFR2ko (R2ko) R-03 and VHR-10 PDX cells treated with birinapant, as indicated. Data are representative of 3 independent experiments. Bir/bir, birinapant; 10′, 10 minutes; 30′, 30 minutes.
The recruitment of RIP1 to TNFR1 upon birinapant treatment was confirmed in 2 more SM-sensitive PDX samples, whereas recruitment was not detected in nonresponders (Figure 5B; supplemental Figure 5D).
Given the importance of receptor trimerization in TNFR1 signaling, we investigated the distribution of TNFR1 into monomers, dimers, and trimers. Interestingly, most TNFR1 exists as trimers in primary ALL, and only a small fraction occurs in monomers (Figure 5C). We did not observe any differences between responsive and nonresponsive PDX samples or between WT and TNFR2ko PDX samples (Figure 5C). Additionally, we could not detect the formation of TNFR1 and TNFR2 heterotrimers (data not shown). Therefore, TNFR2 promotes cell death by facilitating the recruitment of RIP1 to TNFR1, without a direct effect on TNFR1. Further supporting a role for TNFR1 in the response to SM, phosphorylation of RIP1 at Ser166, indicative of cell death activation, was abolished in TNFR1-deficient ALL, whereas total RIP1 was unaffected by TNFR1 depletion (Figure 5D).
Resulting from the regulation of TNFR1-RIP1 interactions, TNFR2 is also required for RIP1 kinase activity, as indicated by RIP1 phosphorylation at S166 in WT ALL, but not in TNFR2-deficient ALL (Figure 5E; supplemental Figure 4E). Additionally, TNFR2 is required for the formation of the ripoptosome, a complex containing caspase-8 and RIP1 that mediates apoptosis and necroptosis,26 in 1 of the PDX samples that we investigated (Figure 5E, left panel). However, its role in the formation of the ripoptosome is diverse, and we observed steady-state ripoptosome formation that was only mildly affected by birinapant treatment and/or TNFR2 depletion in another PDX sample (Figure 5E, right panel).
Taken together, our results indicate a requirement of TNFR2 for cell death upon cIAP depletion by mediating the association of RIP1 with TNFR1, which activates the TNFR1/RIP1 cell death axis and downstream RIP1-mediated cell death. This cross talk mechanism is the molecular basis for the exquisite response to SMs in a subset of high-risk and relapse B-ALL cases. Thus, our data identify TNFR2 as a functionally relevant biomarker candidate that may contribute to the identification of primary ALL with vulnerability to RIP1-dependent cell death by SMs, together with functional approaches (eg, ex vivo drug-response analysis).
Discussion
Impaired cell death activation is a common escape mechanism of drug-resistant cancer cells. We showed earlier that sensitivity to RIP1-dependent cell death is a specific vulnerability of a subgroup of ALL, including refractory and relapsed cases, which has not been exploited by standard chemotherapy so far.3 In particular, the activation of RIPK3-dependent necroptosis downstream of RIP1 critically contributes to antileukemic activity,3 corroborating identification of RIPK3 as a tumor suppressor also in myeloid leukemia.27 Small molecules, such as SMs that capitalize on this vulnerability, hold great promise for anticancer therapy. Indeed, various studies have shown SM to have promising preclinical activity against hematologic malignancies.3,4,12,13,28 The successful application of novel targeted therapies for cancer treatment requires the parallel development of robust criteria to select the patient populations who are most likely to respond to each given therapy. Here, we show that TNFR2 may constitute a candidate molecular marker for sensitivity to SMs and suggest that TNFR2 gene expression analysis could be combined with ex vivo drug sensitivity profiling15,29 to predict the response to SMs in the setting of a clinical trial. Indeed, TNFR2 was identified in a CRISPR-based screen as a gene conferring sensitivity to SMs in a myeloid leukemia cell line model.30
On the functional level, our data reveal a novel ligand- and NF-κB–independent role for TNFR2 in regulating RIP1-mediated cell death, opening up new possibilities for therapeutic exploitation. Although TNFR1 is expressed pleiotropically in all cells, the expression of TNFR2 is restricted to specific cell types, including immune cells, such as B- and T-cell subsets.31 Absence of TNFR2 might explain the low single-agent activity of SMs against many solid tumor cell lines. In contrast, TNFR2 is increasingly identified on subsets of primary solid tumors,10 suggesting a potential to identify broader sensitivities to SM therapy in primary tumors.
Previous reports implicating TNFR2 in the regulation of TNF-induced cell death described a ligand passing effect, according to which TNFR2 could increase the concentration of TNF-α at the cell surface and facilitate its interaction with TNFR1.32 Other investigators described a sensitizing effect of TNFR2 caused by degradation of TRAF2 and inhibition of the TNFR1-induced canonical NF-κB pathway, which, in turn, lead to decreased transcription of antiapoptotic proteins and increased TNF-α–induced cell death.21,33 Additionally, TNFR2 stimulation has been shown to increase TNF-α production, leading to autocrine TNF-α signaling and cell death10,34 or to TNFR1-dependent gene induction.34 We did not observe any consistent differences in the activation of NF-κB that could explain the differential sensitivity. Additionally, our data using CRISPR/Cas9-mediated deletion of TNF-α rule out the possibility of a ligand passing effect and indicate a TNF-α–independent role for TNFR2.
Together, our results reveal a new paradigm of receptor function through indirect regulation of critical protein-protein interactions. We propose a novel unexploited role for TNFR2, which primes for cell death by promoting the association of RIP1 with TNFR1 and subsequent cell death. This indirect regulation of cell death by TNFR2 appears to be the underlying mechanism for its predictive value for SM sensitivity in primary leukemia. With respect to the further clinical development of SMs as potent antileukemia agents, our results provide a strategy to exploit RIP1-dependent cell death in resistant disease and support the necessity to develop functional personalized approaches for efficient translation of novel treatment options.
Data sharing requests should be sent to Beat C. Bornhuser (beat.bornhauser@kispi.uzh.ch).
Acknowledgments
This work was supported by the “Stiftung Kinderkrebsforschung Schweiz," the MAM-Fonds of the Children’s Research Centre of the University Children’s Hospital Zurich, the Empiris Foundation, the clinical research focus program “Human Hemato-Lymphatic Diseases” of the University of Zurich, the Swiss Cancer League (KFS 3609-02-2015, KFS-4384-02-2018), the Novartis Foundation for Biomedical Research, the Swiss National Science Foundation (310030-133108), the Canadian Institutes For Health Research, the Forschungskredit of the University of Zurich (FK-14-016), the Provita Foundation, the Fondation Panacée, the German Federal Ministry of Education and Research (NGFN project number 01GS0442), the Deutsche Krebshilfe, the Madeleine Schickedanz Kinderkrebs-Stiftung, and the European Network for Cancer Research in Children and Adolescents.
Authorship
Contribution: J.A.-G., S.M., C.E., A.G., M.P.D., C.M., L.A., B.M., S.J., and G.C. performed experiments and analyzed data; G.C., M. Schrappe, M. Stanulla, A.v.S., and C.E. provided samples and clinical data; J.A.-G., J.-P.B., and B.C.B. wrote the manuscript; and J.-P.B. and B.C.B. conceived and supervised the study.
Conflict-of-interest disclosure: The authors declare no competing financial interests.
The current affiliation for J.A.-G. is Department of Molecular, Cell, and Developmental Biology, and Eli and Edythe Broad Center for Regenerative Medicine and Stem Cell Research, University of California, Los Angeles, Los Angeles, CA.
The current affiliation for S.M. is Human Health and Therapeutics, National Research Council, Ottawa, ON, Canada.
Correspondence: Beat Bornhauser, University Children’s Hospital Zurich, Balgrist Campus AG, Lengghalde 5, CH-8008 Zurich, Switzerland; e-mail: beat.bornhauser@kispi.uzh.ch.

