

Key Points
TDZ treatment modifies cytoskeleton dynamics triggering Ca2+ overload and toxic reactive oxygen species accumulation for t(6;11)AML.
TDZ analogues exert toxicity in t(6;11)-rearranged AML without neurological involvement in vivo, indicating a clinical therapeutic use.

Abstract
In pediatric acute myeloid leukemia (AML), intensive chemotherapy and allogeneic hematopoietic stem cell transplantation are the cornerstones of treatment in high-risk cases, with severe late effects and a still high risk of disease recurrence as the main drawbacks. The identification of targeted, more effective, safer drugs is thus desirable. We performed a high-throughput drug-screening assay of 1280 compounds and identified thioridazine (TDZ), a drug that was highly selective for the t(6;11)(q27;q23) MLL-AF6 (6;11)AML rearrangement, which mediates a dramatically poor (below 20%) survival rate. TDZ induced cell death and irreversible progress toward the loss of leukemia cell clonogenic capacity in vitro. Thus, we explored its mechanism of action and found a profound cytoskeletal remodeling of blast cells that led to Ca2+ influx, triggering apoptosis through mitochondrial depolarization, confirming that this latter phenomenon occurs selectively in t(6;11)AML, for which AF6 does not work as a cytoskeletal regulator, because it is sequestered into the nucleus by the fusion gene. We confirmed TDZ-mediated t(6;11)AML toxicity in vivo and enhanced the drug’s safety by developing novel TDZ analogues that exerted the same effect on leukemia reduction, but with lowered neuroleptic effects in vivo. Overall, these results refine the MLL-AF6 AML leukemogenic mechanism and suggest that the benefits of targeting it be corroborated in further clinical trials.
Introduction
In childhood acute myeloid leukemia (AML), recurrent chromosomal abnormalities are well-known prognostic markers that are used to stratify patients in different risk groups and to tailor risk-adapted therapies.1,2 The prospective clinical trials, currently conducted by pediatric AML international cooperative groups, still include 4 to 5 courses of intensive, myelosuppressive chemotherapy in standard-to-intermediate–risk patients, reserving allogeneic hematopoietic stem cell transplantation for use in high-risk or relapsed patients.3,4 Despite the extensive improvements achieved in both treatment-related mortality and outcome, there is room to revisit current therapeutic programs by including new drug approaches, such as those targeting oncogenic driver mutations, to ameliorate treatment response.5-7
A notable move forward is expected to result from new therapeutic approaches aimed at targeting chimeric or mutated genes that have been found to occur particularly in diverse genetic subgroups.7 Nevertheless, novel drug-targeting approaches used for some adult cancers8 are still far from being used in children with life-threatening AML.9,10 High-throughput drug screening (HTDS) approaches are currently used to test whether novel compounds or drugs known to be active in other malignancies may be effective in acute leukemia, with the goal of introducing them rapidly into pediatric clinical trials.7,11,12 We considered this strategy to prioritize the identification of drugs with therapeutic benefits against the childhood AML variant harboring the t(6;11)(q27;q23) chromosomal rearrangement, which defines a peculiar biological and clinical subset of AML, where the genes lysine methyltransferase 2A (KMT2A, MLL) and afadin (AFDN, AF6) are fused, generating the chimeric protein MLL-AF6.13,14 We and other international groups previously identified MLL-AF6–rearranged AML as the most aggressive among the pediatric AMLs with MLL rearrangements, with a low probability of event-free survival, reported to range from 11% to 23% at 5 years.15 Indeed, several efforts have been made to understand the main characteristics of this chimera, demonstrating the crucial role played by the rare MLL partner gene AF6, which is physiologically localized in the cytoplasm, but is completely delocalized from the nucleus by the chimera heterodimerization property,14 enhancing the activation of RAS and its downstream pathway in the AML blasts.13 Today, most patients with t(6;11) rearrangement still succumb within 1 year of diagnosis because of resistance to conventional cytotoxic therapy. In this study, we identified that thioridazine (TDZ), primarily used for schizophrenia, induces death in cells harboring the MLL-AF6 chimera, thus serving as a newly discovered mechanism of action for triggering leukemia cell death. Furthermore, we had encouraging results with novel TDZ analogues that showed therapeutic efficacy without neuroleptic effects in vivo and could be considered for improving survival in these patients.
Materials and methods
Patient selection and cell culture
We used primary cells from stored samples obtained from patients for diagnostic analyses. These patients had t(6;11)(q27;q23) MLL/AF6 and AML with other recurrent genetic aberrations; those without genetic abnormalities were recorded as non-t(6;11)AML. For apoptosis tests we used AML with t(9;11)(p21;q23) MLL/AF9, t(10;11)(p12;q23) MLL/AF10, or inv(16)(p13;q22) CBFB/MYH11 or without a genetic marker. AML primary blasts were obtained from patients with AML in compliance with the Declaration of Helsinki; informed consent was obtained from the parents or legal guardians of the patients.4 SHI-1, ML-2, HL60, THP-1, NOMO-1, and SKNO-1 cell lines were purchased from DSMZ (Braunschweig, Germany) and cultured as indicated by the manufacturer’s guidelines.
Cell treatments
For HTDS, we used 1280 compounds from the LOPAC library (Sigma-Aldrich-Merck, Darmstadt, Germany). Drug treatment was performed through an Automated Pipetting Workstation (epMotion 5070; Eppendorf, Hamburg, Germany) to standardize the method (see supplemental Information for the pipeline). Hit compounds, such as TDZ, fluspirilene (FLUS), and Ara-C, were obtained from Sigma-Aldrich-Merck for further experiments in vitro and in vivo. In vitro treatment with TDZ and analogues was performed at 10 μM concentration, as previously suggested.16
Apoptosis assay
Apoptosis was evaluated by double staining with annexin-V/propidium iodide (PI) (Roche Biochemicals, Indianapolis, IN) and analyzed with the FC500 cytometer (Beckman Coulter, Brea, CA). Increased apoptosis was calculated and expressed as the percentage of annexin-V+ and PI+ cells compared with those exposed to dimethyl sulfoxide (DMSO).
Immunofluorescence
For cytoskeletal rearrangements, images were acquired with the Axio Imager M1 epifluorescence microscope (Zeiss, Oberkochen, Germany). Elongated cells were counted for morphology, evaluating elements with or without prominent, organized, and filamentous actin/elongated cytoskeletons (TDZ treatment: n = 46-146 cells; silencing [sir] MAF6: n = 114-225 cells). F-actin aggregates were counted, and F-actin fluorescence was measured by Image-J software (n = 152-408 cells; supplemental Information).
Measurements of intracellular Ca2+.
Intracellular Ca2+ levels were monitored by Fluo-4 AM (Thermo Fisher Scientific), fluorescence, according to the manufacturer’s instructions. Results were evaluated with the FC500 cytometer and a Thorlabs 2-photon microscope. In both experiments, the mean fluorescence intensity (MFI) was detected in the basal condition and up to 5 minutes after treatment.
Xenograft experiments by bioluminescence imaging in NSG mice.
Procedures involving animals and their care were in accordance with institutional guidelines that comply with national and international laws and policies (EEC Council Directive 86/609; OJ L 358; 12 December 1987) and with “ARRIVE” guidelines (Animals in Research Reporting In Vivo Experiments). NSG mice were injected in the tail vein with 2 × 10⁶ SHI-1-LUC (transduced with the luciferase gene) cells. Mice were intraperitoneally injected with XenoLight firefly D-luciferin (15 mg/mL in phosphate-buffered saline; Perkin Elmer, Waltham, MA) 10 minutes before measurement (Xenogen IVIS Lumina II bioluminescence/optical imaging system; Xenogen Corporation, Alameda, CA) and imaged at 5, 8, 15, and 21 days to verify tumor engraftment and growth. When cell engraftment was verified, the mice were randomly allocated to 4 groups (control, TDZ, Ara-C, and a combination of TDZ and Ara-C), and treated daily with TDZ (8 mg/kg, intraperitoneally [IP]), Ara-C 6.25 mg/kg (IP), or a combination of the 2 drugs. The combination index was calculated using the response-additivity approach. See the description of flank-injection xenograft experiments in the supplemental Methods.
TDZ analogue synthesis and SILAC and affinity enrichment.
Six azido thioridazine derivatives (TDZ1-6), were prepared by heterocyclic N-piperidine substitution, according to a concise 3-step synthetic procedure reported in the supplemental Data.17 For the SILAC and affinity enrichment methods and silencing validation see the supplemental Information. Results were obtained by assessing proteins collected in 2 independent experiments with at least 2 peptides from lysis buffer 1 and then were confirmed by using the more stringent lysis buffer 2 (in 2 independent experiments and with 2 peptides per protein). Straightforward candidate targets predicted to be localized in cytoplasm or membrane were considered.
Data analysis.
Statistical analyses were performed using the Mann-Whitney U or unpaired 2-tailed Student t test. Statistically significant P values are denoted in the figure legends.
Results
TDZ targets MLL-AF6-AML cytoskeleton dynamics
By HTDS of 1280 compounds on the MLL-AF6–rearranged ML-2 cell line, we initially identified 104 active molecules. All of them were then screened using the SHI-1 cell line, another cell line harboring the t(6;11) rearrangement, confirming the activity of 93 of the 104 compounds (Figure 1A). To reduce the number of compounds, we tested these 93 compounds on the non-t(6;11)AML cell line HL60, excluding 73 active molecules. Finally, the 20 remaining compounds were used to treat 2 t(9;11)MLL-AF9–rearranged cell lines, THP-1 and NOMO-1, identifying 10 compounds as toxic for both of them (supplemental Table 1) and finally identifying those that acted exclusively on the t(6;11)-rearranged cells (supplemental Figure 1; supplemental Table 2). These 10 selected compounds were active at micromolar doses (GI50 from 1 to 10 µM [drug dosage giving a 50% reduction in the net increase in cell proliferation]) on the t(6;11)-rearranged AML cells (supplemental Table 3). We focused on 2 antipsychotic agents, FLUS and TDZ, to be investigated for their repositioning as anti-MLL-AF6 drugs. t(6;11)AML cell apoptosis was documented (Figure 1B), with almost no effects on other AML cell lines (supplemental Figure 2A). The self-renewal ability of cancer cells was also observed to be severely compromised after TDZ preincubation, exclusively in the t(6;11)AML rearrangement (Figure 1C; supplemental Figure 2B), and the cell cycle was disrupted (supplemental Figure 3). Altogether, these data showed that TDZ was strongly effective in inducing the death of the t(6;11)AML cell lines. To investigate the relationship between TDZ sensitivity and the presence of t(6;11) translocation, we calculated GI50 values for a panel of different leukemia cell lines and primary AML samples harboring various genetic lesions (supplemental Figure 4A-B), confirming that t(6;11)-rearranged AML cell lines were the most sensitive to TDZ treatment (supplemental Table 4) and that the drug abrogated colony formation in t(6;11)AML without toxic effects on healthy bone marrow (supplemental Figure 4C). In addition, we transfected a non-t(6;11)-AML cell line (HL60) with a pMIG vector that was empty or modified to express the MLL-AF6 or MLL-AF9 chimera and checked the effect of TDZ on their expression. We documented an increase in TDZ sensitivity specifically when MLL-AF6 was induced, which as expected led to a partial AF6 translocation into the nucleus after MLL-AF6 induction (supplemental Figure 5A-C), without any significant change in HL60 viability when pMIG-MLL-AF9 was expressed. We thus confirmed the selectivity of TDZ in the presence of the MLL-AF6 chimera and moved forward to in vivo experiments. We injected the t(6;11)-SHI-1, t(5;17)-HL60, or t(9;11)-THP-1 cell line into the flank of NOD/scid IL-2Rgnull (NSG) mice and monitored leukemia growth after treatment. Monitoring of tumor size revealed that only in SHI-1 xenografted mice did the treatment significantly reduce the progression of tumor growth, not in the control (Figure 2A). We tested the combination of TDZ with a very low dose of cytosine-arabinoside, which is not toxic (AraC 6 mg/kg vs standard 50 mg/kg) in vivo, in both the flank-injection and IV models, confirming that TDZ significantly improved leukemia reduction in the bone marrow and spleen (P < .05; supplemental Figure 6 A-C). To further confirm the selectivity of TDZ for t(6;11)AML, we silenced the MLL-AF6 fusion (supplemental Figure 7) and treated cells when the chimera was severely compromised (16 hours after silencing), showing that cell apoptosis was significantly rescued at 8, 24, and 30 hours after treatment (n = 2; Figure 2B), supporting that TDZ’s efficacy is dependent on expression of the chimera and thus that the drug is highly selective for this AML subtype. To repurpose TDZ as a novel targeted therapy for this high-risk AML, we explored its mechanism of action in this leukemia context. We first evaluated the expression of dopamine receptors (DRs), which represent the main TDZ target for neuroleptic effects, but we found that all 5 DRs, including DR2,16,18 were almost negative in both the t(6;11)AML cell lines and primary blasts (supplemental Figure 8A-B), suggesting that TDZ triggers t(6;11) cell death trough a different mechanism. Thus, we reasoned that this AML variant is without cytoplasmic AF6 protein, because it was aberrantly sequestered in the nucleus by the MLL-AF6 chimera, as previously demonstrated.13 AF6 exerts many physiological functions in cytoplasm, one of which is PARKIN recruitment to mitochondria to trigger mitophagy, a rescue mechanism that occurs after cell injury.19 Thus, we hypothesized that cells without AF6 lose the capability of activating mitophagy in response to TDZ treatment, thus inducing the observed cell death. However, the latter hypothesis was discarded because we confirmed that AF6 was necessary in non-t(6;11)AML cells for PARKIN-induced mitophagy (supplemental Figure 9A); however, in SHI-1 cells, mitophagy was still active in a PARKIN-independent way (supplemental Figure 9B) and TDZ did not induce mitophagy20 (supplemental Figure 9C-D). In light of these data, we excluded the most straightforward mechanisms of action of TDZ and explored its targets by using a large-scale method that combines quantitative proteomics (exploiting stable isotope labeling with amino acids in cell culture [SILAC]) with affinity enrichment, the best way to provide an unbiased, robust, comprehensive identification of compound-binding proteins.21 To perform the experiment, we synthesized a TDZ analogue modified with a linker in the piperidine ring for binding to solid-phase (SP) TDZ3 (supplemental Figure 10A). We confirmed in vitro that TDZ3 produced cell death, with the same effects as TDZ, as described before (supplemental Figure 10B), and we performed SILAC. Mass spectrometry of the peptides identified with lysis buffer 1 revealed 88 proteins (log2 heavy/light ratio > 0) that were then filtered with the stringent lysis buffer 2, resulting in the identification of 3 proteins as TDZ targets: S100A8, S100A9, and ANXA6 (Figure 3A). S100A8 and S100A9 are of the same family of S100 calcium-binding proteins and are predominantly found as heterodimers that form S100A8/A9 (calprotectin), which is widely described to promote microtubule polymerization and F-actin cross-linking.22 ANXA6 is a component of the annexin family, another class of Ca2+-regulated proteins that bind to the negatively charged plasma membrane surface, modulating membrane transport and ion fluxes and influencing actin dynamics.23 Interestingly, these 3 proteins are well known to form a complex associated with cytoskeletal filaments.24 We validated that S100A8, S100A9, and ANXA6 were recovered after overnight hybridization of SHI-1 cell lysate with SP TDZ3 (Figure 3A). Then, we silenced S100A8, S100A9, and ANXA6 as single genes or in combination, showing that during a severe reduction of gene expression, we had the rescue of TDZ cell death effects (Figure 3B; supplemental Figure 11), confirming that this complex is the TDZ target. The fact that the S100A8, S100A9, and ANXA6 complex is crucial in the cytoskeletal organization suggests that the mechanism of action of TDZ could involve the cytoskeleton. We thus investigated SHI-1 and primary AML cell morphology before and after a brief TDZ treatment (4 hours, a time insufficient for inducing cell death). With F-actin staining, untreated cells displayed elongated and stretched organized actin filaments, whereas after TDZ, they assumed a round shape (n = 46-146 cells; Figure 3C). We also observed that all the non-t(6;11)–rearranged AML (cell lines and primary AML) cells exhibited a small, round cytoskeleton before and after treatment, independent of genetic asset, which was different from the more stretched, t(6;11)-rearranged cells (supplemental Figure 12A-B). This finding supports the interpretation that TDZ binds its target complex, S100A8/A9-ANXA6, triggering severe cytoskeletal modification of the t(6,11)-rearranged blasts, probably related to the preexisting condition of the absence of the cytoplasmic AF6.25,26 To definitively sustain this hypothesis, we silenced MLL-AF6 fusion, which led to the restoration of AF6 in the cytoplasm (supplemental Figure 13),13 observing the rescue of the cytoskeleton, returning it toward a round-shaped morphology similar to non-t(6;11)AML cells (n = 114-225 cells; Figure 3D). Furthermore, in addition to the morphologic changes, we observed exclusively in t(6;11)AML cells the accumulation of large F-actin aggregates starting from 2 hours after TDZ treatment and increasing over time (centrifuged cells; n = 152-333; Figure 3E). These F-actin aggregates have been described to correlate with the oxidative stress and apoptosis27 that we largely documented in the t(6;11) cells later during TDZ treatment.
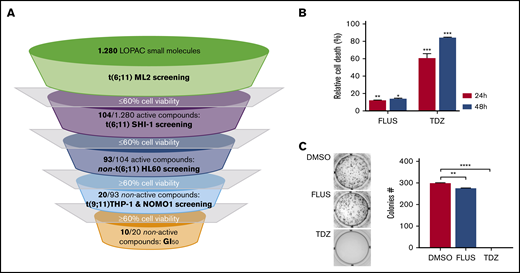
Drug screening pipeline and selected compounds. (A) The pipeline used to select compounds for t(6;11) cell lines: 1280 compounds were tested in ML-2 cells; 104 active drugs were tested in SHI-1; 93 active drugs were screened in the t(5;17) cell line HL60; and 20 nonactive drugs were tested in the t(9;11) cell lines THP-1 and NOMO-1. The 10 resulting compounds were considered selective for t(6;11)AML. Drug treatment was performed in triplicate, and compounds were considered active when cell viability was reduced to at least 60%. (B) Cell death (annexin V+, PI+, and annexin V+/PI+) induced by FLUS and TDZ in SHI-1 cells 24 and 48 hours after treatment (n = 3), relative to the DMSO value. (C) Colony-forming assay performed on viable SHI-1 cells seeded 24 hours after FLUS or TDZ treatment (n = 3). Data are the mean ± SEM. *P < .05; **P < .01; ***P < .001; ****P < .0001.
Drug screening pipeline and selected compounds. (A) The pipeline used to select compounds for t(6;11) cell lines: 1280 compounds were tested in ML-2 cells; 104 active drugs were tested in SHI-1; 93 active drugs were screened in the t(5;17) cell line HL60; and 20 nonactive drugs were tested in the t(9;11) cell lines THP-1 and NOMO-1. The 10 resulting compounds were considered selective for t(6;11)AML. Drug treatment was performed in triplicate, and compounds were considered active when cell viability was reduced to at least 60%. (B) Cell death (annexin V+, PI+, and annexin V+/PI+) induced by FLUS and TDZ in SHI-1 cells 24 and 48 hours after treatment (n = 3), relative to the DMSO value. (C) Colony-forming assay performed on viable SHI-1 cells seeded 24 hours after FLUS or TDZ treatment (n = 3). Data are the mean ± SEM. *P < .05; **P < .01; ***P < .001; ****P < .0001.
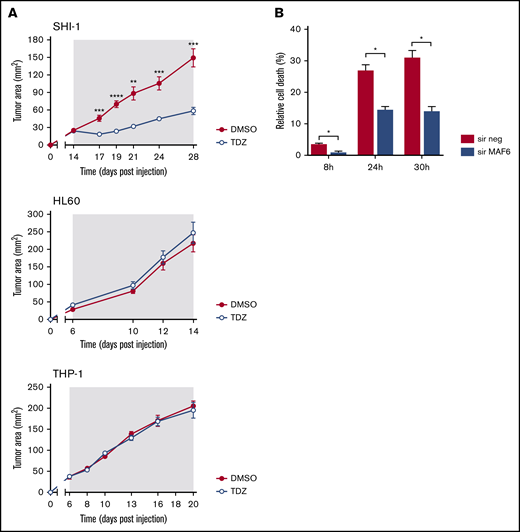
TDZ antagonizes MLL-AF6–mediated leukemia progression. (A) Tumor growth in mice that received flank injections of SHI-1, HL60, or THP1 cells and were treated daily with TDZ at 8 mg/kg, compared with the control group treated with DMSO (n = 6). The gray area indicates the treatment interval. (B) Cell death (annexin V+, PI+, and annexin V+/PI+) of SHI-1–injected mice treated with TDZ 16 hours after MLL-AF6 chimera silencing (sir), evaluated 8, 24, and 30 hours after treatment, compared with DMSO (n = 2). Data are the mean ± SEM. *P < .05; **P < .01; ***P < .001; ****P < .0001.
TDZ antagonizes MLL-AF6–mediated leukemia progression. (A) Tumor growth in mice that received flank injections of SHI-1, HL60, or THP1 cells and were treated daily with TDZ at 8 mg/kg, compared with the control group treated with DMSO (n = 6). The gray area indicates the treatment interval. (B) Cell death (annexin V+, PI+, and annexin V+/PI+) of SHI-1–injected mice treated with TDZ 16 hours after MLL-AF6 chimera silencing (sir), evaluated 8, 24, and 30 hours after treatment, compared with DMSO (n = 2). Data are the mean ± SEM. *P < .05; **P < .01; ***P < .001; ****P < .0001.
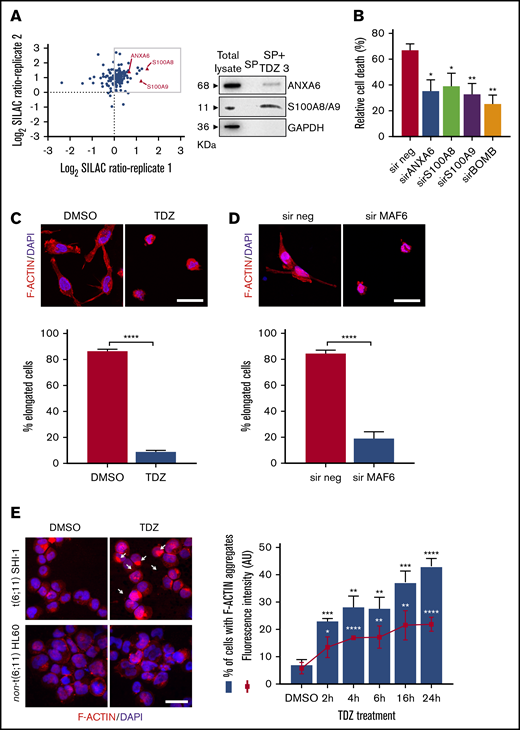
TDZ induces cytoskeletal rearrangement. (A) Scatterplot of the common SHI-1 proteins identified in 2 independent experiments of quantitative proteomics combined with affinity enrichment. Each data point is a single protein; proteins with log2 SILAC ratio >0 (box) denote the 88 inferred targets identified with buffer 1, whereas the 3 proteins represented by red triangles are those confirmed by buffer 2 (n = 2). Immunoblot analysis for SILAC validation. SHI-1 total proteins. Proteins eluted in the SP without TDZ3 (SP) and with TDZ3 (SP+TDZ3) were analyzed by western blot. (B) Cell death (annexin V+, PI+, and annexin V+/PI+) induced after 24 hours of treatment with TDZ 10 µM treatment in SHI-1 cell lines after ANXA6, S100A8, and S100A9 silencing (sir), used alone or combined (sirBOMB). (C-D) Representative confocal immunofluorescence images of SHI-1 cells seeded onto fibronectin-coated slides 4 hours after TDZ treatment (C), or 60 hours after silencing (sir) of MLL-AF6 fusion gene (D), stained with F-actin antibody (red) and diamidino-2-phenylindole (DAPI; blue) as the nuclear counterstain. Histograms represent the percentage of elongated cells (panel C; n = 46-146 cells and n = 114-225 cells). Original magnification ×63. Bars represent 10 μm. (E) Immunofluorescence of centrifuged SHI-1 and HL60 cells 4 hours after TDZ treatment, stained with F-actin antibody (red) and with DAPI (blue) as the nuclear counterstain. Arrows indicate F-actin aggregates. Histogram represents the percentage of SHI-1 cells containing F-actin aggregates 2, 4, 6, 16, or 24 hours after TDZ treatment (n = 152-333 cells). Original magnification ×63. Bar represents 10 μm. Data are the mean ± SEM. *P < .05; **P < .01; ***P < .001; ****P < .0001. Original magnification ×40. Bar represents 10 μm. AU, arbitrary unit.
TDZ induces cytoskeletal rearrangement. (A) Scatterplot of the common SHI-1 proteins identified in 2 independent experiments of quantitative proteomics combined with affinity enrichment. Each data point is a single protein; proteins with log2 SILAC ratio >0 (box) denote the 88 inferred targets identified with buffer 1, whereas the 3 proteins represented by red triangles are those confirmed by buffer 2 (n = 2). Immunoblot analysis for SILAC validation. SHI-1 total proteins. Proteins eluted in the SP without TDZ3 (SP) and with TDZ3 (SP+TDZ3) were analyzed by western blot. (B) Cell death (annexin V+, PI+, and annexin V+/PI+) induced after 24 hours of treatment with TDZ 10 µM treatment in SHI-1 cell lines after ANXA6, S100A8, and S100A9 silencing (sir), used alone or combined (sirBOMB). (C-D) Representative confocal immunofluorescence images of SHI-1 cells seeded onto fibronectin-coated slides 4 hours after TDZ treatment (C), or 60 hours after silencing (sir) of MLL-AF6 fusion gene (D), stained with F-actin antibody (red) and diamidino-2-phenylindole (DAPI; blue) as the nuclear counterstain. Histograms represent the percentage of elongated cells (panel C; n = 46-146 cells and n = 114-225 cells). Original magnification ×63. Bars represent 10 μm. (E) Immunofluorescence of centrifuged SHI-1 and HL60 cells 4 hours after TDZ treatment, stained with F-actin antibody (red) and with DAPI (blue) as the nuclear counterstain. Arrows indicate F-actin aggregates. Histogram represents the percentage of SHI-1 cells containing F-actin aggregates 2, 4, 6, 16, or 24 hours after TDZ treatment (n = 152-333 cells). Original magnification ×63. Bar represents 10 μm. Data are the mean ± SEM. *P < .05; **P < .01; ***P < .001; ****P < .0001. Original magnification ×40. Bar represents 10 μm. AU, arbitrary unit.
TDZ unbalances Ca2+ homeostasis, triggering t(6;11)AML cell death
F-actin aggregates were observed to activate reactive oxygen species (ROS) and cell death; thus, we measured ROS levels of t(6;11)SHI-1 cells during treatment and found that they continuously increased, whereas TDZ induced light ROS production in non-t(6;11) cells that rapidly resolved in 24 hours (in 6, 16, and 24 hours of treatment; n = 2; Figure 4A). Concomitantly, potential polarization of the mitochondria changed with an increased depolarization in t(6;11), whereas it remained completely unaffected in non-t(6;11)AML (at 6-24 hours of treatment; n = 5; Figure 4B).
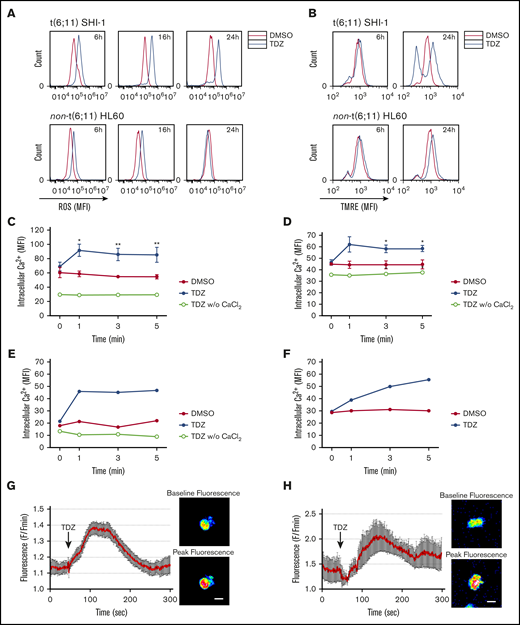
TDZ induces ROS production and mitochondrial depolarization in t(6;11) AML cell through calcium influx. (A) ROS levels detected 6, 16, and 24 hours after TDZ treatment compared with DMSO, in SHI-1 and HL60 cells (n = 2). (B) Mitochondrial depolarization evaluated by tetramethylrhodamine ethyl (TMRE) fluorescence measurement, 6 and 24 hours after TDZ treatment compared with DMSO, in SHI-1 and HL60 cells (n = 5). (C-D) Live intracellular Ca2+ in t(6;11) SHI-1 (C) and in non-t(6;11) HL60 (D) cell lines, loaded with Fluo-4 AM Ca2+ indicator, measured by flow cytometry, in Ca2+-containing or -free buffer (n = 5). Values are the mean ± SEM. *P < .05; **P < .01. (E-F) Live intracellular Ca2+ in t(6;11) (E) and non-t(6;11) primary (F) cells, loaded with Fluo-4 AM Ca2+ indicator, measured by flow cytometry. (G-H) Intracellular Ca2+ in SHI-1 (G) and t(6;11) primary cells (H) measured with a 2-photon microscope. Values are the mean fluorescence of 10 cells ± SEM. Images show baseline vs peak fluorescence of a representative cell. Bars represent 20 μm.
TDZ induces ROS production and mitochondrial depolarization in t(6;11) AML cell through calcium influx. (A) ROS levels detected 6, 16, and 24 hours after TDZ treatment compared with DMSO, in SHI-1 and HL60 cells (n = 2). (B) Mitochondrial depolarization evaluated by tetramethylrhodamine ethyl (TMRE) fluorescence measurement, 6 and 24 hours after TDZ treatment compared with DMSO, in SHI-1 and HL60 cells (n = 5). (C-D) Live intracellular Ca2+ in t(6;11) SHI-1 (C) and in non-t(6;11) HL60 (D) cell lines, loaded with Fluo-4 AM Ca2+ indicator, measured by flow cytometry, in Ca2+-containing or -free buffer (n = 5). Values are the mean ± SEM. *P < .05; **P < .01. (E-F) Live intracellular Ca2+ in t(6;11) (E) and non-t(6;11) primary (F) cells, loaded with Fluo-4 AM Ca2+ indicator, measured by flow cytometry. (G-H) Intracellular Ca2+ in SHI-1 (G) and t(6;11) primary cells (H) measured with a 2-photon microscope. Values are the mean fluorescence of 10 cells ± SEM. Images show baseline vs peak fluorescence of a representative cell. Bars represent 20 μm.
Indeed, we explored Ca2+ and observed a rapid influx within 1 minute of TDZ treatment in SHI-1 cells, and in HL60 cells to a lesser extent (SHI-1: DMSO MFI of 61, 59, 55, and 55; and TDZ MFI of 69, 92, 86, and 85 at 0, 1, 3, and 5 minutes after treatment, respectively; n = 5; HL60: DMSO MFI of 45, 44, 44, and 45; and TDZ MFI of 46, 62, 58, and 59 at 0, 1, 3 and 5 minutes after treatment, respectively; n = 3; Figure 4C-D). The latter observations were confirmed in primary t(6;11) and non-t(6;11)AML and in healthy bone marrow (Figure 4E and F, respectively; supplemental Figure 14A-B). We then confirmed by 2-photon microscope a Ca2+ influx in t(6;11)AML (SHI-1 and primary cells; Figure 4G-H; supplemental Videos 1 and 2, respectively). Of note, TDZ triggered a rise in intracellular Ca2+ concentration when CaCl2 was present in the medium, whereas if absent no Ca2+ influx was detected, suggesting a selective increase of external Ca2+ entry over internal release (w/o; Figure 4C-E). To corroborate this TDZ-mediated abnormal Ca2+ influx, we pretreated SHI-1 cells with 2 mM EGTA, an extracellular Ca2+ chelator, and showed a long-lasting lack of Ca2+ intake when treated with TDZ (n = 3; Figure 5A; supplemental Figure 15). Moreover, we observed a partially rescued mitochondrial depolarization and significantly reduced apoptosis of the SHI-1 cells at 6 and 24 hours (n = 3; Figure 5B-C). However, neither cytoskeletal rearrangements nor F-actin aggregate formation was rescued by blocking Ca2+ influx by EGTA (n = 2; Figure 5D), because they depend on TDZ binding to its target proteins, which triggers the cytoskeletal modification. In line with this hypothesis, we exacerbated Ca2+ cytoplasmic levels by cotreating cells with TDZ and KB-R7943 (10 µM), a drug that inhibits both the mitochondrial calcium uniporter and plasma membrane Na+-Ca2+ exchanger.28 The result of this Ca2+ overload (supplemental Figure 16) revealed a stronger and more rapid SHI-1 mitochondrial depolarization and cell death, with no effects on HL60 cells (n = 5; Figure 5E-F). Finally, we used thapsigargin (Thapsi; 2 µM), a specific inhibitor of endoplasmic reticulum (ER) ATPase that depletes Ca2+ ER storage, pouring its cargo into the cytosol, and definitively established that Ca2+ homeostasis was pivotal for t(6;11) blast survival (supplemental Figure 17A-B). In light of this novel TDZ-induced phenomenon, we first identified that Ca2+ homeostasis is a crucial feature, especially when coupled to expression of the MLL-AF6 chimera.
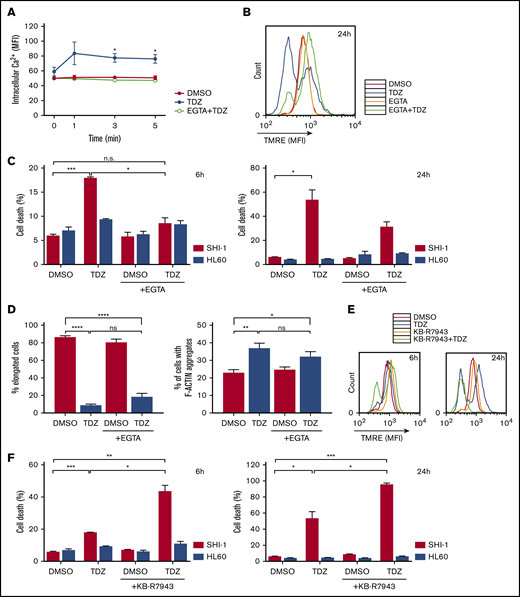
Ca2+overload is toxic for t(6;11)AML cells. (A) Live intracellular Ca2+ measurement in SHI-1 cells loaded with Fluo-4 AM Ca2+ indicator, measured by flow cytometry. EGTA pretreatment was performed 30 minutes before TDZ, which was added at time 0 after the basal measurement. Fluorescence was detected 1, 3, and 5 minutes after TDZ treatment (n = 3). (B) Overlapping representative histograms showing mitochondrial depolarization evaluated by tetramethylrhodamine ethyl (TMRE) fluorescence measurement 24 hours after TDZ, EGTA, or EGTA+TDZ treatment (n = 3). (C) Cell death (annexin V+, PI+, and annexin V+/PI+) evaluated 6 and 24 hours after TDZ, EGTA, or EGTA+TDZ treatment, compared with the DMSO value (n = 2). (D) Histograms showing the percentage of elongated cells (n = 46-146 cells) and the percentage of cells containing F-actin aggregates (n = 156-408 cells), 4 hours after TDZ, EGTA, or EGTA+TDZ treatment. (B-D) EGTA pretreatment was performed 30 minutes before TDZ was added. (E) Representative overlapping histograms showing mitochondrial depolarization evaluated by TMRE measurement 6 and 24 hours after treatment with TDZ, KB-R7943, or KB-R7943+TDZ (n = 5). (F) Cell death (annexin V+, PI+, and annexin V+/PI+) evaluated 6 and 24 hours after TDZ, KB-R7943 or KB-R7943+TDZ treatment, compared with the DMSO value (n = 2). Data are the mean ± SEM. *P < .05; **P < .01; ***P < .001; ****P < .0001. ns, not significant.
Ca2+overload is toxic for t(6;11)AML cells. (A) Live intracellular Ca2+ measurement in SHI-1 cells loaded with Fluo-4 AM Ca2+ indicator, measured by flow cytometry. EGTA pretreatment was performed 30 minutes before TDZ, which was added at time 0 after the basal measurement. Fluorescence was detected 1, 3, and 5 minutes after TDZ treatment (n = 3). (B) Overlapping representative histograms showing mitochondrial depolarization evaluated by tetramethylrhodamine ethyl (TMRE) fluorescence measurement 24 hours after TDZ, EGTA, or EGTA+TDZ treatment (n = 3). (C) Cell death (annexin V+, PI+, and annexin V+/PI+) evaluated 6 and 24 hours after TDZ, EGTA, or EGTA+TDZ treatment, compared with the DMSO value (n = 2). (D) Histograms showing the percentage of elongated cells (n = 46-146 cells) and the percentage of cells containing F-actin aggregates (n = 156-408 cells), 4 hours after TDZ, EGTA, or EGTA+TDZ treatment. (B-D) EGTA pretreatment was performed 30 minutes before TDZ was added. (E) Representative overlapping histograms showing mitochondrial depolarization evaluated by TMRE measurement 6 and 24 hours after treatment with TDZ, KB-R7943, or KB-R7943+TDZ (n = 5). (F) Cell death (annexin V+, PI+, and annexin V+/PI+) evaluated 6 and 24 hours after TDZ, KB-R7943 or KB-R7943+TDZ treatment, compared with the DMSO value (n = 2). Data are the mean ± SEM. *P < .05; **P < .01; ***P < .001; ****P < .0001. ns, not significant.
New TDZ analogues for treating t(6;11)AML
TDZ has been recently proposed to treat several cancers, including adult AML, as suggested in a recent phase 1 trial, in which TDZ still showed low therapeutic efficacy with mostly neuroleptic toxicity.18 Seeking to extend the potential clinical use of TDZ as a targeted therapy for treating those patients with AML who specifically carry the t(6;11) rearrangement, we decided to improve its safety profile of neuroleptic effects on the central nervous system. To tackle this problem, we designed, synthesized, and tested 6 new TDZ analogues (TDZ1, TDZ2, TDZ4, TDZ5, TDZ6, as well as the TDZ3 previously used for SP linking; supplemental Figure 18), obtained by heterocyclic N-piperidine substitution, for their effect on t(6;11) blasts. We found that 3 of them (TDZ2, TDZ3, and TDZ6) induced apoptosis to an extent similar to that of the lead compound TDZ (n = 3; Figure 6A) and demonstrated that they exerted the same TDZ mechanism of action by reorganizing the cytoskeleton (n = 2; Figure 6B). In particular, TDZ2 and TDZ6 promoted Ca2+ uptake similar to TDZ, whereas TDZ3 resulted in a significantly higher Ca2+ influx than its lead compound (n = 3; Figure 6C). Conversely, those TDZ analogues with no effects on apoptosis did not induce cytoskeletal modification or Ca2+ influx, confirming that both these effects are determinants that trigger TDZ- or analogue-induced t(6;11)AML cell death. In light of these results, we prioritized TDZ2 and TDZ6 for in vivo testing. We evaluated neuroleptic effects by a stepped-dose test29 in NSG mice treated with increasing doses of drug (1, 5, 8, 10, 12, and 15 mg/kg), and found that both the analogues TDZ2 and TDZ6 did not provoke akinesia, either at the dose where TDZ was efficient (at least 8 mg/kg), or at higher doses (n = 3; Figure 6D). We finally selected TDZ6 as the analogue with the efficacy to prevent AML progression in vivo and found that it counteracted tumor growth at a dosage equivalent to TDZ, 8 mg/kg (n = 5; Figure 6E), with the great possibility of potentiating the standard chemotherapy effect. This result of a novel TDZ formulation that targets t(6;11)AML blasts by determining a severe F-actin aggregation and Ca2+ influx is a novel strategy for selectively clearing blasts (Figure 7).
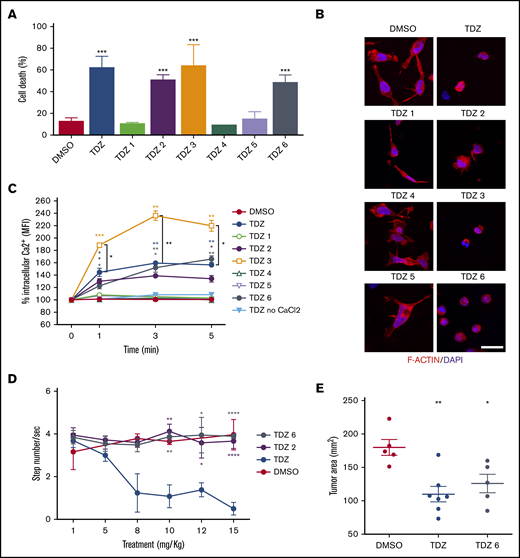
TDZ analogues act on t(6;11)-AML cells with reduced neuroleptic side effects. (A) Cell death (annexin V+, PI+, and annexin V+/PI+) evaluated 24 hours after treatment with TDZ and the analogues TDZ1, TDZ2, TDZ3, TDZ4, TDZ5, and TDZ6, compared with the DMSO value (n = 3). (B) Confocal immunofluorescence images of SHI-1 cells stained with F-actin antibody and with diamidino-2-phenylindole (DAPI) as the nuclear counterstain, seeded onto fibronectin (FN)-coated slides 4 hours after treatment with TDZ or its analogues (n = 2). Original magnification ×63. Bar represents 10 μm. (C) Live intracellular Ca2+ measurement in cells loaded with Fluo-4 AM, a Ca2+ indicator, measured by flow cytometry in Ca2+-containing or in Ca2+-free buffer. TDZ and TDZ analogues (or DMSO as the control) were added after the basal measurement at time 0 (n = 2), and fluorescence was detected 1, 3, and 5 minutes after treatment with TDZ. (D) Stepped-dose test (evaluated as the number of steps per second) performed 1 hour after TDZ, TDZ2, or TDZ6 treatment in NSG mice at the quantities shown (n = 3). (E) Tumor area in mice receiving a flank injection of SHI-1 cells and treated daily with TDZ 8 mg/kg or TDZ-equivalent molar doses of TDZ and TDZ6, compared with the control group treated with DMSO (n = 5), at day 31 after injection, after 20 days of treatment. Gray area indicates treatment interval. Data are the mean ± SEM. *P < .05; **P < .01; ***P < .001; ****P < .0001.
TDZ analogues act on t(6;11)-AML cells with reduced neuroleptic side effects. (A) Cell death (annexin V+, PI+, and annexin V+/PI+) evaluated 24 hours after treatment with TDZ and the analogues TDZ1, TDZ2, TDZ3, TDZ4, TDZ5, and TDZ6, compared with the DMSO value (n = 3). (B) Confocal immunofluorescence images of SHI-1 cells stained with F-actin antibody and with diamidino-2-phenylindole (DAPI) as the nuclear counterstain, seeded onto fibronectin (FN)-coated slides 4 hours after treatment with TDZ or its analogues (n = 2). Original magnification ×63. Bar represents 10 μm. (C) Live intracellular Ca2+ measurement in cells loaded with Fluo-4 AM, a Ca2+ indicator, measured by flow cytometry in Ca2+-containing or in Ca2+-free buffer. TDZ and TDZ analogues (or DMSO as the control) were added after the basal measurement at time 0 (n = 2), and fluorescence was detected 1, 3, and 5 minutes after treatment with TDZ. (D) Stepped-dose test (evaluated as the number of steps per second) performed 1 hour after TDZ, TDZ2, or TDZ6 treatment in NSG mice at the quantities shown (n = 3). (E) Tumor area in mice receiving a flank injection of SHI-1 cells and treated daily with TDZ 8 mg/kg or TDZ-equivalent molar doses of TDZ and TDZ6, compared with the control group treated with DMSO (n = 5), at day 31 after injection, after 20 days of treatment. Gray area indicates treatment interval. Data are the mean ± SEM. *P < .05; **P < .01; ***P < .001; ****P < .0001.
Discussion
Childhood AML biological heterogeneity is mainly explained by the presence of recurrent cytogenetic and molecular markers in almost 95% of cases that, correlating with the response to therapy and outcome, play a crucial role not only in diagnostic definition, but also in risk stratification.4 However, few genetic features are targetable with drugs30 and cytotoxic chemotherapy still represents the mainstay of leukemia treatment.3 In this study, we sought to identify novel agents that act on the MLL-AF6–specific15,31` leukemia subtype, in view of the consideration that current therapies almost invariably fail in children with this AML variant.32 We used high-throughput screening of chemical compounds, partly approved by the U. S. Food and Drug Administration or in clinical development, to be rapidly advanced into pediatric clinical trials in AML.33
To reach our goal, we used a very restrictive pipeline that allowed for a process of high refinement, which unexpectedly revealed that the dopamine receptor antagonist TDZ was a selective anti-t(6;11)AML drug in vitro and in vivo.15
In recent years, TDZ has been proposed as an antileukemia stem cell agent,16 and, more in general, phenothiazines have been shown to display anticancer activity over a broad array of cancer types.34-36 Nevertheless, there are controversial reports on DR expression on cancer cells,16 because the concentration necessary to induce cytotoxicity is many orders of magnitude higher than would be expected for a DR-based mechanism, as determined from dopamine receptor affinity.37 In that regard, TDZ antitumoral activity on various cancer cell lines is exerted with an in vitro dosage that ranges from 5 to 20 μM,34,38-41 far from the dissociation constant of TDZ for its putative DR2 targeting,37 suggesting that other mechanisms are activated by this drug in cancer,42 especially because of the multiple targets that high concentrations of antipsychotic drugs may engage. Thus, we decided to use a blind analytical target-identification strategy for dissecting the targeted mechanism of TDZ in t(6;11) blast cells.21 We identified the S100A8-A9-ANXA6 complex bound to TDZ molecules. Of note, it has been reported that S100A4, a member of the same S100 family, is a target of the phenothiazines trifluoperazine and prochlorperazine, an observation that supports our results.43 This discovery guided the identification of the downstream signaling, showing that the main TDZ effect in myeloid cells was on cytoskeletal remodeling. In fact, S100A8-A9-ANXA6 plays a role in microtubule organization and F-actin cross-linking,22-24 with main consequences for the cytoskeletal reorganization that induces apoptosis.27,44 We obtained evidence of a profound rearrangement of F-actin fibers on AML cells, but cell death was observed exclusively in those harboring the t(6;11)MLL-AF6 rearrangement, where TDZ treatment induced the condensation of F-actin into large intracellular aggregates, similar to those observed in actin-regulatory mutants and for other drugs affecting actin turnover.27,45 This phenomenon is known to provoke cell intoxication from F-actin bundles, loss of the regulation of actin dynamics, and an increase in oxidative stress.27 It appeared that ROS accumulation was detrimental exclusively in t(6;11)AML cells that, unable to restore their basal levels of ROS, died. ROS can be generated by various sources, and many of these systems can be modulated by calcium.46 We observed that, during TDZ treatment, a massive influx of external Ca2+ was generated, most likely through cytoskeletal rearrangement. Intracellular cytosolic Ca2+ is maintained at a very low level, and minimal fluctuation of Ca2+ levels can generate aberrant signaling.47 We thus monitored cytosolic Ca2+, showing that TDZ treatment triggered an increase in intracellular Ca2+ concentration in the presence, but not in the absence, of external Ca2+, suggesting a selective increase in Ca2+ entry over internal release. We demonstrated that this Ca2+ overload in t(6;11)AML cells is the main cause of ROS overproduction, mitochondrial depolarization, and leukemia cell apoptosis, with reduced or augmented cell death when combined with the Ca2+ chelator EGTA and the mitochondrial calcium uniporter and Na+-Ca2+ exchanger blocker drugs. These findings revealed the role of Ca2+ levels in MLL-AF6–rearranged cells, confirmed also by using Thapsi, a drug that moves Ca2+ from ER storage into the cytosol and phenocopies the effects of TDZ in triggering apoptosis. We then linked this TDZ extreme specificity and selectivity toward the presence of the chimera MLL-AF613 and its known ability to sequester AF6 into the nucleus.13 AF6 is a multidomain protein that comprises 2 RAS/RAP1- and actin-binding domains, with activity on cell adhesion through the regulation of the actin cytoskeleton.25,26,48 In this study, the cytoplasmic absence of AF6 resulted in a different cytoskeletal reorganization, leading to a stretched AML cell morphology, with more prominent and organized actin filaments, when compared with the round cell morphology of the rest of the AML genetic subtypes. As confirmed in the context of MLL-AF6 silencing, the treatment effects of TDZ were abolished when AF6 cytoplasmic expression was restored, confirming that the MLL-AF6–mediated cytoskeletal abnormality amplified treatment effects, resulting in severe consequences for cell survival.
We thus identified a targeted therapy for MLL-AF6 AML. However, TDZ is a neuroleptic compound, and that led to the unsolved question of whether there is an adequate therapeutic window including sufficient degree of efficacy if applied to clinical use.42
To overcome these limitations and in particular to extend this proposal in pediatrics, we developed novel TDZ analogues, where the heterocyclic N-piperidine was modified, adding a lateral chain that prevents blood-brain barrier crossing while maintaining cytotoxicity in t(6;11)AML cells. We demonstrated that these new compounds displayed their effects with the same mechanism of action as the lead compound TDZ. Thus, we indicate herein novel formulations with an improved safety profile to be pursued in future AML trials.
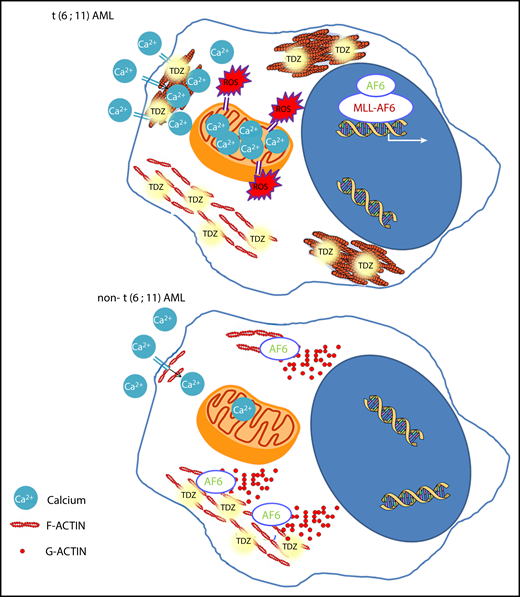
TDZ-induced effects. In t(6;11)AML cells, where AF6 is sequestered in the nucleus, TDZ binds S100A8-A9-ANXA6, impairing actin turnover, promoting F-actin aggregates, and ultimately leading to massive Ca2+ influx, which in turn promotes ROS overproduction and mitochondrial depolarization, triggering cell death. Conversely, in non-t(6;11)AML cells, TDZ still binds S100A8-A9-ANXA6, but the functional cytoplasmic AF6 counteracts its action, inducing milder cytoskeletal rearrangement and Ca2+ influx, eliciting reversible effects.
TDZ-induced effects. In t(6;11)AML cells, where AF6 is sequestered in the nucleus, TDZ binds S100A8-A9-ANXA6, impairing actin turnover, promoting F-actin aggregates, and ultimately leading to massive Ca2+ influx, which in turn promotes ROS overproduction and mitochondrial depolarization, triggering cell death. Conversely, in non-t(6;11)AML cells, TDZ still binds S100A8-A9-ANXA6, but the functional cytoplasmic AF6 counteracts its action, inducing milder cytoskeletal rearrangement and Ca2+ influx, eliciting reversible effects.
Finally, we identified for the first time high susceptibility to Ca2+ overload as a feature peculiar to t(6;11)AML cells, deconvoluting a cancer mechanism that can be exploited to treat patients with MLL-AF6 rearrangement and in light of the observation that DOT1L inhibitors and other epigenetic modulators were found to be ineffective.49,50 Overall, our results confirm the complex and unique nature of the oncogenic mechanisms sustained by the MLL-AF6 fusion gene and provide the rationale for testing TDZ analogues in the clinical arena.
No additional patient data will be made available.
Acknowledgments
The authors thank the staff of the Oncology Hematology laboratory for the diagnosis of AML; the sample biobanking of the Biobanca Oncologia Pediatrica (BBOP); and the Hematology-Oncology Clinic, SDB Department, UniPD-Azienda Ospedaliera di Padova and Elena Manara, Valeria Bisio, and Matteo Zampini for their support.
This work was supported by grants from Università degli Studi di Padova, by CARIPARO grant 17/04 (M.P.), by Fondazione AIRC (Associazione Italiana Ricerca sul Cancro) IG 20562 (M.P.), AIRC (Special Grant “5xmille”-9962) (F.L.), AIL-PD and AIL-TV (Association against Leukemia-Lymphoma and Myeloma–Padua and Treviso sections) (M.P.), and Ministero della Salute (RF-2010-2316606) (F.L.).
Authorship
Contribution: C.T., F.L., and M.P. were involved in the study design, data interpretation, and manuscript writing; C.T., M.B., E.P., G. Borella, and A.D.R. performed the in vitro assays; E.P., A.D.R., and S.M. performed the in vivo experiments; G. Borile performed the 2-photon microscopy; L.S. and S.C. performed the mitophagy tests; M.S. and P.C. performed the mass spectrometry analyses; R.R. synthetized the analogues; A.M. performed the solid phase immobilization; and K.P. and B.B. characterized the patient samples.
Conflict-of-interest disclosure: C.T., R.R., and M.P. are coinventors of the new TDZ compounds included in an Italian Patent (number 102019000015809) entitled “Composti Analoghi della Tioridazina.” The remaining authors declare no competing financial interests.
Correspondence: Martina Pigazzi, University of Padua, Women and Child Health Department, Haematology-Oncology Clinic and Laboratory, 35128 Padua, Italy; e-mail: martina.pigazzi@unipd.it.

