

Key Points
MHC-II plays an important role in spontaneous and PD-1 blockade–mediated antitumor immunity against cHL via cytotoxic CD4+ T cells.
LAG-3 could be a potential therapeutic target for combination therapies with PD-1 blockade in MHC-II–expressing cancers.

Abstract
Classic Hodgkin lymphoma (cHL) responds markedly to PD-1 blockade therapy, and the clinical responses are reportedly dependent on expression of major histocompatibility complex class II (MHC-II). This dependence is different from other solid tumors, in which the MHC class I (MHC-I)/CD8+ T-cell axis plays a critical role. In this study, we investigated the role of the MHC-II/CD4+ T-cell axis in the antitumor effect of PD-1 blockade on cHL. In cHL, MHC-I expression was frequently lost, but MHC-II expression was maintained. CD4+ T cells highly infiltrated the tumor microenvironment of MHC-II–expressing cHL, regardless of MHC-I expression status. Consequently, CD4+ T-cell, but not CD8+ T-cell, infiltration was a good prognostic factor in cHL, and PD-1 blockade showed antitumor efficacy against MHC-II–expressing cHL associated with CD4+ T-cell infiltration. Murine lymphoma and solid tumor models revealed the critical role of antitumor effects mediated by CD4+ T cells: an anti-PD-1 monoclonal antibody exerted antitumor effects on MHC-I−MHC-II+ tumors but not on MHC-I−MHC-II− tumors, in a cytotoxic CD4+ T-cell–dependent manner. Furthermore, LAG-3, which reportedly binds to MHC-II, was highly expressed by tumor-infiltrating CD4+ T cells in MHC-II–expressing tumors. Therefore, the combination of LAG-3 blockade with PD-1 blockade showed a far stronger antitumor immunity compared with either treatment alone. We propose that PD-1 blockade therapies have antitumor effects on MHC-II–expressing tumors such as cHL that are mediated by cytotoxic CD4+ T cells and that LAG-3 could be a candidate for combination therapy with PD-1 blockade.
Introduction
Hodgkin and Reed-Sternberg (HRS) cells are the hallmarks of classic Hodgkin lymphoma (cHL). Most HRS cells are derived from crippled, largely CD30+, preapoptotic, germinal center B cells that lack functional B-cell receptors and exhibit reduced expression of multiple B-cell transcription factors.1,2 In 30% to 40% of cHL, HRS cells have evidence of latent Epstein-Barr virus (EBV) infection.1 cHL therefore exhibits an inflamed tumor microenvironment (TME): HRS cells are surrounded by an extensive infiltrate comprising multiple immune cells,1 suggesting the importance of escape from immunosurveillance for their survival and growth.3 Genetic alterations associated with immune evasion are often observed, such as copy number alterations in chromosome 9p24.1 including loci associated with the programmed death 1 (PD-1) ligand (CD274/PD-L1 and PDCD1LG2/PD-L2),4 inducing PD-1–associated immune evasion.
A gain of immune escape mechanism, the induction/recruitment of immunosuppressive cells and increases in the expression of various immunosuppressive molecules, including PD-1/PD-1 ligands, is an important process during cancer development and progression.5,6 Therefore, disrupting immunosuppressive components with monoclonal antibodies (mAbs) has been tested in the clinic, and PD-1 blockade has been shown to be effective against various types of cancer, such as malignant melanoma, lung cancer, and cHL.6-11 PD-1, which interacts with PD-1 ligands, is primarily expressed after the activation of T cells and suppresses T-cell function, reducing the cells to a dysfunctional state called exhaustion. PD-1 blockade reinvigorates exhausted CD8+ T cells, leading to tumor regression.6 Thus, CD8+ T cells that recognize cancer antigens presented on major histocompatibility complex class I (MHC-I) through their T-cell receptor are a key component in killing tumor cells.12,13 The loss of MHC-I expression therefore induces resistance against PD-1 blockade.14-17 In sharp contrast, whereas PD-1 blockade exhibits dramatic antitumor efficacy against cHL, it has been reported that it is relatively effective against cHL harboring MHC-II, which is frequently expressed by HRS cells because of their origin,18-21 even with the loss of MHC-I expression.11 However, although the dependency of the antitumor immunity induced by PD-1 blockade on MHC-II expression in cHL suggests an important role for CD4+ T cells, the details remain unclear.
Lymphocyte activation gene-3 (LAG-3), another immune checkpoint molecule, mainly binds to MHC-II molecules and provides an inhibitory signal to T cells, especially CD4+ T cells.22,23 Indeed, LAG-3 expression by tumor-infiltrating lymphocytes (TILs) corresponds to a poor prognosis in certain tumor types, including cHL, non-Hodgkin lymphoma, and chronic lymphocytic leukemia, in which malignant cells frequently exhibit MHC-II expression.24-26 In addition, LAG-3 expression by TILs is reportedly associated with EBV infection in cHL,25,27 and LAG-3 reportedly represses T-cell function in viral infection.28 These findings suggest that LAG-3 can be an additional therapeutic target in MHC-II–expressing tumors.
In this study, we found in clinical samples that cHL frequently lacked expression of MHC-I but maintained MHC-II expression. In addition, CD4+ T cells highly infiltrated the TME of MHC-II–expressing cHL, suggesting that CD4+ T cells in the TME play an important role in antitumor immunity against MHC-II–expressing cHL. To elucidate the role of CD4+ T cells in MHC-II–expressing tumors, we examined antitumor effects using various patterns of MHC-expressing tumors in syngeneic animal models.
Materials and methods
Patients and samples
Eighty-five patients with cHL who underwent biopsy at the National Cancer Center or Chiba Cancer Center from 1999 through 2018 (first diagnosis, 80; relapse, 5) were enrolled in this study (Table 1). The patients’ clinical information was obtained from their medical records. The clinical protocol for this study was approved by the appropriate institutional review boards and ethics committees at the National Cancer Center (2017-511) and Chiba Cancer Center (R02-123). The study was conducted in accordance with the Declaration of Helsinki.
Patient characteristics
| Features | MHC class I | MHC class II | ||||
|---|---|---|---|---|---|---|
| Positive (n = 36) | Negative (n = 49) | P | Positive (n = 54) | Negative (n = 31) | P | |
| Age, median (range), y | 55 (15-79) | 34 (15-88) | .10 | 54 (15-88) | 44 (17-83) | .33 |
| Sex (male/female) | 28/8 | 32/17 | .24 | 41/13 | 19/12 | .22 |
| Sampling (1st diagnosis/relapse) | 32/4 | 48/1 | .16 | 49/5 | 31/0 | .15 |
| Histology (NS/MC/others) | 12/18/6 | 24/21/4 | .35* | 17/28/9 | 19/11/1 | .036* |
| EBV (positive/negative) | 17/11 | 12/18 | .19 | 23/17 | 6/12 | .16 |
| Performance status (0-1/2+) | 34/2 | 49/0 | .18 | 52/2 | 31/0 | .53 |
| Ann Arbor stage (I or II/III or IV) | 17/19 | 22/27 | >.99 | 25/29 | 14/17 | >.99 |
| B symptom (yes/no) | 8/28 | 17/32 | .24 | 17/37 | 8/23 | .63 |
| LDH, median (range), U/L | 204 (68-333) | 235 (143-554) | <.01 | 208 (68-441) | 227.5 (134-554) | .093 |
| MHC class I (positive/negative) | — | — | — | 27/27 | 9/22 | .071 |
| MHC class II (positive/negative) | 27/9 | 27/22 | .071 | — | — | — |
| CD4, median (range) | 428.2 (81.4-1137.6) | 425 (75-925) | .97 | 496.9 (137.6-1137.6) | 268.8 (75-700) | <.01 |
| CD8, median (range) | 284.4 (125-412.6) | 118.8 (6.2-437.4) | <.01 | 203.1 (11-400) | 118.8 (6.2-437.4) | .053 |
| FOXP3, median (range) | 81.2 (12.4-368.6) | 100 (6.4-568.6) | .30 | 93.8 (6.4-568.6) | 100 (12.4-431.2) | .52 |
| PD-L1 (positive/negative) | 34/2 | 37/12 | .036 | 46/8 | 25/6 | .76 |
Data are the number of patients, unless stated otherwise (n = 85).
MC, mixed cellularity; NS, nodular sclerosis.
NS vs MC.
Immunohistochemistry
For immunohistochemistry (IHC), formalin-fixed, paraffin-embedded (FFPE) sections (3 µm) were deparaffinized with xylene, rehydrated, and subjected to an antigen retrieval process in a microwave oven for 20 minutes. After the inhibition of endogenous peroxidase activity, individual slides were incubated overnight at 4°C with anti-CD4 mAb (SP35; Roche Diagnostics, Basel, Switzerland), anti-CD8 mAb (C8/144B; Dako, Copenhagen, Denmark); anti-FOXP3 mAb (236A/E7; Abcam, Cambridge, United Kingdom); anti–MHC-I (HLA-A, -B, and -C) mAbs (EMR8-5; HKD, Hokkaido, Japan); anti–MHC-II (HLA-DP, -DQ, and -DR) mAbs (CR3/43; Dako); anti-CD68 mAb (D4B9C; Cell Signaling Technology, Danvers, MA); and anti-PD-L1 mAb (E1L3; Cell Signaling Technology). The slides were then incubated with an EnVision reagent (Dako), and the color reaction was developed in 2% 3,3-diaminobenzidine in 50 mM Tris buffer (pH 7.6) containing 0.3% hydrogen peroxidase. Double staining for MHC-I or MHC-II and CD68 was performed using Simple Stain AP (Nichirei, Tokyo, Japan) in addition to EnVision reagent. MHC-I or MHC-II and CD68 were developed as brown with 3,3-diaminobenzidine and as red with Fast Red, respectively.
HRS cells were identified as large CD30+ cells and discriminated them from CD68+ macrophages. The membrane expression of MHC-I, MHC-II, and PD-L1 by HRS cells was assessed as previously reported.29 Intratumoral CD4+, CD8+, and FOXP3+ T cells were counted; 5 fields (0.0625 mm2) containing HRS cells were randomly selected and counted for each slide. The average of the 5 area counts for each patient was used for statistical analysis.
Multiplexed fluorescent IHC
Multiplexed fluorescent IHC was performed with direct detection of antigens by primary antibodies from the different species. Anti-CD4 rabbit mAb (SP35; Roche Diagnostics), anti-PD-1 mouse mAb (J116; Abcam), and anti-LAG-3 mouse mAb (17B4; Abcam) were used for primary staining. Anti-rabbit IgG Alexa Fluor 555 (Abcam) and anti-mouse IgG Alexa Fluor 488 (Thermo Fisher Scientific, Waltham, MA) were used to stain secondary antibodies, and the slides were analyzed with a BZ-X710 (Keyence, Osaka, Japan).
Cell lines and reagents
A20 (mouse B-cell lymphoma) and E.G7 (mouse T-cell lymphoma) cell lines were purchased from ATCC (Manassas, VA). MC-38 cell line (mouse colon cancer) was obtained from Kerafast (Boston, MA). These cell lines were maintained in RPMI medium (Fujifilm Wako Pure Chemical Corporation, Osaka, Japan) supplemented with 10% fetal calf serum (Biosera, Orange, CA). All tumor cells were used after confirming that they were Mycoplasma− by Mycoplasma testing with the PCR Mycoplasma Detection Kit (TaKaRa, Shiga, Japan), according to the manufacturer’s instructions. Murine interferon (IFN)-γ was obtained from PeproTech (Rocky Hill, NJ). Rat anti-mouse PD-1 mAb (RMP1-14), anti-LAG-3 mAb (C9B7W), control rat IgG2 mAb (RTK2758), and control rat IgG1κ mAb (RTK2071) were obtained from BioLegend (San Diego, CA). Anti-mouse CD4 mAb (GK1.5), anti-mouse CD8β mAb (Lyt 3.2), and control rat IgG2b mAb (LTF-2) were purchased from BioXCell (West Lebanon, NH).
Constructs, virus production, and transfection
Ovalbumin (OVA) cDNA was subcloned into pBABE-puro, which was transfected into a packaging cell line using Lipofectamine 3000 Reagent (Thermo Fisher Scientific). After 48 hours, the supernatant was concentrated and transfected into cell lines (A20/OVA). B2M-deficient A20/OVA, E.G7, and MC-38 cell lines were generated using CRISPR/Cas9 technology. In brief, a targeting guide RNA sequence (5ʹ-TTCGGCTTCCCATTCTCCGG-3ʹ) was used to edit the B2M locus. The guide RNA and Cas9 protein (Thermo Fisher Scientific) were transfected into A20/OVA, E.G7, and MC-38 cell lines, by using Lipofectamine CRISPRMAX (Thermo Fisher Scientific). The knockout cell lines were named A20/OVA/B2MKO, E.G7/B2MKO, and MC-38/B2MKO, respectively. Mouse CIITA cDNA was subcloned into pBABE-puro, and viruses were generated and transfected into the cell lines, which were similarly named E.G7/B2MKO/CIITA and MC-38/B2MKO/CIITA. The expression of MHC-I and MHC-II was evaluated by flow cytometry in triplicate.
In vivo animal models
Female C57BL/6J and BALB/cA mice (6-8 weeks old) were purchased from CLEA Japan (Tokyo, Japan). C57BL/6J-Prkdc<scid>/Rbrc mice (B6 SCID; RBRC01346) were provided by RIKEN BRC (Tsukuba, Japan) through the National BioResource Project of the Ministry of Education, Culture, Sports, Science and Technology/Japan Agency for Medical Research and Development (MEXT/AMED). A20/OVA cells (5 × 10⁶), E.G7 cells (5 × 10⁶), or MC-38 cells (1 × 10⁶) were inoculated subcutaneously, and tumor volume was monitored every 3 days. The means of the long and short diameters were used to generate tumor growth curves. Mice were grouped when the tumor volume reached ∼100 mm3, and anti-PD-1 mAb (200 μg/mouse), anti-LAG-3 mAb (300 μg/mouse), or control mAb was administered intraperitoneally 3 times every 3 days thereafter. For CD4+ and CD8+ T-cell deletion, anti-CD4 mAb (100 μg/mouse) and anti-CD8β mAb (100 μg/mouse), respectively, were administered intraperitoneally 1 day before tumor cell inoculation and then injected every 7 days. Tumors were harvested 14 days after tumor cell inoculation to collect TILs for evaluation by flow cytometry. All in vivo experiments were performed at least twice (n = 6 per group). All mice were maintained under specific-pathogen–free conditions in the animal facility of the Institute of Biophysics. Mouse experiments were approved by the Animal Committee for Animal Experimentation of the National Cancer Center and Chiba Cancer Center. All experiments met the standards set forth in the Guide for the Care and Use of Laboratory Animals (National Institutes of Health, Bethesda, MD).
Flow cytometry analyses
Flow cytometry assays were performed as described.30,31 In brief, cells were washed with phosphate-buffered saline containing 2% fetal calf serum and subjected to staining with surface antibodies. Intracellular staining was performed with specific antibodies and FOXP3/Transcription Factor Staining Buffer Set (Thermo Fisher Scientific), according to the manufacturer’s instructions. For intracellular cytokine and granzyme B assays, cells were stimulated for 5 hours with phorbol 12-myristate 13-acetate (100 ng/mL)/ionomycin (2 μg/mL) (Sigma Aldrich, St. Louis, MO). GolgiPlug reagent (1.3 μl/mL; BD Biosciences, Franklin Lakes, NJ) was added for the last 4 hours of the culture. Samples were assessed with an LSRFortessa (BD Biosciences) or a FACSVerse (BD Biosciences) and FlowJo software (BD Biosciences). The staining antibodies were diluted according to the manufacturer's instructions. The antibodies used in the flow cytometry analyses are summarized in supplemental Table 1.
Statistical analyses
Prism 7 (GraphPad Software, San Diego, CA) and R version 4.0.2 software (R Foundation for Statistical Computing, Vienna, Austria) were used for statistical analyses. The relationships between groups were analyzed with Fisher’s exact test or Student t test. Overall survival (OS) and progression-free survival (PFS) were defined as the time from the initiation of first-line standard chemotherapy until death from any cause and the time from the initiation of first-line standard chemotherapy until the first observation of disease progression or death from any cause, respectively. Five-year survival was used to develop receiver operating characteristic (ROC) curves and set cutoff values of CD4, CD8, and FOXP3 counts. OS and PFS were analyzed by using the Kaplan-Meier method and compared among groups by using the log-rank test. A Cox proportional hazards model was used for the univariate and multivariate analyses to estimate hazard ratios and 95% confidence intervals. Only those variables with P < .05 in a univariate analysis were included in the multivariate analysis. All tests were 2-tailed, and results at P < .05 were statistically significant.
Results
CD4+ T cells infiltrate the TME of MHC-II–expressing cHL
To examine the immunological landscape in the TME of cHL, we collected 85 cHL samples. Eighty samples were obtained at first diagnosis and 5 more samples at relapse after any prior treatment. These samples were subjected to IHC for MHC-I, MHC-II, CD4, CD8, FOXP3, and PD-L1. FOXP3 staining could not be evaluated in 3 samples because of the bad condition of the samples. We identified HRS cells as large CD30+ cells and discriminated them from CD68+ macrophages (supplemental Figure 1A). We evaluated the membrane expression of MHC-I and MHC-II by HRS cells. MHC-I expression was frequently lost in cHL (49 of 85), as previously reported (Table 1; Figure 1A).18,19 In sharp contrast, more than half of the cHL samples (54 of 85) harbored MHC-II expression (Table 1; Figure 1A). Twenty-seven MHC-I+MHC-II+, 27 MHC-I−MHC-II+, 9 MHC-I+MHC-II−, and 22 MHC-I−MHC-II− cHLs were observed in our cohort. Accordingly, CD4+ T cells more frequently infiltrated the TME of cHL than did CD8+ T cells (Figure 1B). CD4+ T-cell infiltration was more frequently observed in MHC-II–expressing cHL samples than in MHC-II–deficient cHL samples regardless of the MHC-I expression status (Table 1; Figure 1C-D). On the other hand, CD8+ T-cell infiltration was associated with MHC-I expression: CD8+ T cells were often detected in MHC-I–expressing cHL samples but barely in MHC-I–deficient cHL and were not related to MHC-II expression (Table 1; Figure 1C-D). Although FOXP3+ regulatory T cells are crucial in suppression of antitumor immunity,32,33 its infiltration was not related to the expression of MHC-I or MHC-II (Table 1; supplemental Figure 1B). Therefore, CD4+ T cells may play an important role in MHC-II–expressing cHL, even with the loss of MHC-I expression.
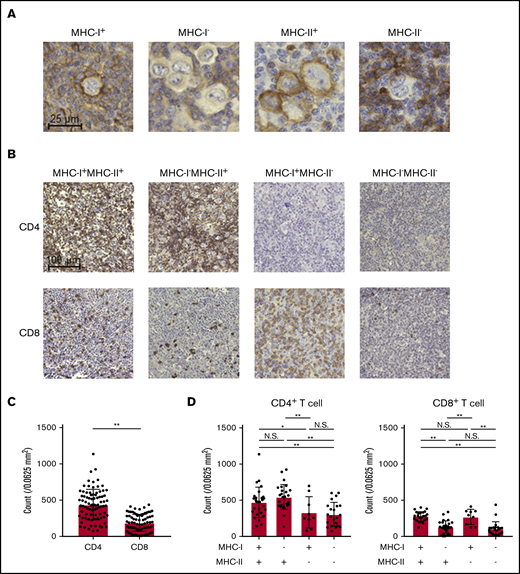
cHL exhibits MHC-II expression accompanied by CD4+T-cell infiltration. (A) Representative staining pictures for MHC-I and MHC-II. IHC was conducted on FFPE sections (3 µm thick) from 85 patients with cHL. (B-D) CD4+ and CD8+ T-cell infiltration according to the expression of MHC-I and MHC-II. IHC was conducted as described in panel A. Five fields (0.0625 mm2) containing HRS cells were randomly selected and counted for each slide. The average of the 5 area counts for each patient was used for statistical analysis. Representative immunohistochemically stained images (B) and summaries of the counts of CD4+ T cells and CD8+ T cells (C) are shown. (D) Summaries of cell counts according to the expression of MHC-I and -II are shown. *P < .05; **P < .01. N.S., not significant.
cHL exhibits MHC-II expression accompanied by CD4+T-cell infiltration. (A) Representative staining pictures for MHC-I and MHC-II. IHC was conducted on FFPE sections (3 µm thick) from 85 patients with cHL. (B-D) CD4+ and CD8+ T-cell infiltration according to the expression of MHC-I and MHC-II. IHC was conducted as described in panel A. Five fields (0.0625 mm2) containing HRS cells were randomly selected and counted for each slide. The average of the 5 area counts for each patient was used for statistical analysis. Representative immunohistochemically stained images (B) and summaries of the counts of CD4+ T cells and CD8+ T cells (C) are shown. (D) Summaries of cell counts according to the expression of MHC-I and -II are shown. *P < .05; **P < .01. N.S., not significant.
CD274 (encoding PD-L1) is frequently amplified in cHL.4 Consistently, our analyses revealed that most patients (71 of 85) in our cHL cohort harbored PD-L1, as previously reported (Table 1; supplemental Figure 1C).4,11,34 Expression of PD-L1 was more frequently detected in MHC-I–expressing cHL. Thus, PD-L1, as well as the loss of MHC-I expression, contributes to immune evasion in cHL.
MHC-II expression plays an important role in spontaneous and PD-1 blockade–mediated antitumor immunity
Various patterns of MHC expression in cHL samples prompted us to examine PD-1 blockade–mediated antitumor effects in animal models. Because there is no syngeneic Hodgkin lymphoma mouse model, we used other lymphoma models (A20 and E.G7) and a solid tumor model (MC-38). The A20 cell line expressed both MHC-I and MHC-II because of its B-cell origin, which is different from that of the E.G7 cell line and another solid tumor cell line, MC-38 (supplemental Figure 2). PD-1 blockade significantly delayed the tumor growth of A20/OVA tumors (MHC-I+MHC-II+; Figure 2A). We then generated MHC-I–deficient cell lines by deleting the B2M gene, which is a crucial component of MHC-I,35 using the CRISPR/Cas9 system (supplemental Figure 2). Similar to the MHC-I–expressing A20/OVA tumors, MHC-I–deficient A20/OVA/B2MKO tumors responded to PD-1 blockade (Figure 2A).
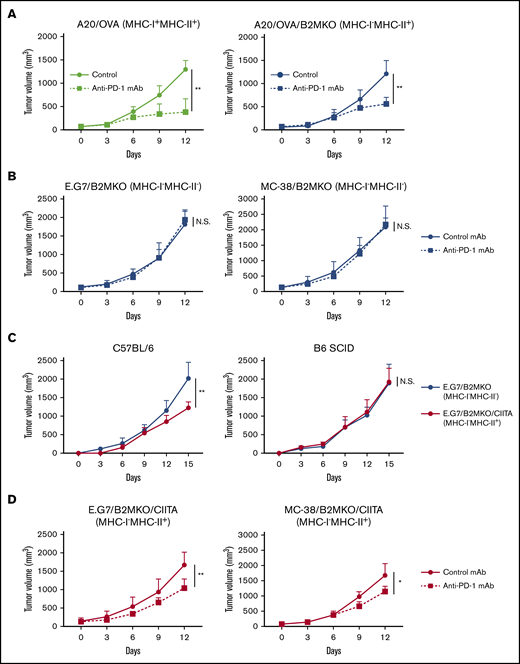
MHC-I−MHC-II+tumors respond to PD-1 blockade. (A) In vivo antitumor efficacy of anti-PD-1 mAb against A20/OVA or A20/OVA/B2MKO tumors. Tumor cells (5.0 × 10⁶) were inoculated subcutaneously. Mice were grouped when the tumors reached ∼100 mm3 (day 0), and anti-PD-1 mAb was administered on days 0, 3, and 6 (n = 6 per group). Tumor growth was monitored every 3 days. (B) In vivo antitumor efficacy of anti-PD-1 mAb against E.G7/B2MKO and MC-38/B2MKO tumors. The in vivo experiments were performed as described in panel A (E.G7, 5.0 × 10⁶, and MC-38, 1.0 × 10⁶). (C) Tumor growth of E.G7/B2MKO and E.G7/B2MKO/CIITA tumors in immunocompetent (C57BL/6) and immunocompromised (B6 SCID) mice. Tumor cells (5.0 × 10⁶) were inoculated subcutaneously into C57BL/6 and B6 SCID mice on day 0 (n = 6 per group). Tumor growth was monitored every 3 days. (D) In vivo antitumor efficacy of anti-PD-1 mAb against E.G7/B2MKO/CIITA and MC-38/B2MKO/CIITA tumors. The in vivo experiments were performed as described in panel A (E.G7, 5.0 × 10⁶, and MC-38, 1.0 × 10⁶). All in vivo experiments were performed twice with similar results. *P < .05; **P < .01.
MHC-I−MHC-II+tumors respond to PD-1 blockade. (A) In vivo antitumor efficacy of anti-PD-1 mAb against A20/OVA or A20/OVA/B2MKO tumors. Tumor cells (5.0 × 10⁶) were inoculated subcutaneously. Mice were grouped when the tumors reached ∼100 mm3 (day 0), and anti-PD-1 mAb was administered on days 0, 3, and 6 (n = 6 per group). Tumor growth was monitored every 3 days. (B) In vivo antitumor efficacy of anti-PD-1 mAb against E.G7/B2MKO and MC-38/B2MKO tumors. The in vivo experiments were performed as described in panel A (E.G7, 5.0 × 10⁶, and MC-38, 1.0 × 10⁶). (C) Tumor growth of E.G7/B2MKO and E.G7/B2MKO/CIITA tumors in immunocompetent (C57BL/6) and immunocompromised (B6 SCID) mice. Tumor cells (5.0 × 10⁶) were inoculated subcutaneously into C57BL/6 and B6 SCID mice on day 0 (n = 6 per group). Tumor growth was monitored every 3 days. (D) In vivo antitumor efficacy of anti-PD-1 mAb against E.G7/B2MKO/CIITA and MC-38/B2MKO/CIITA tumors. The in vivo experiments were performed as described in panel A (E.G7, 5.0 × 10⁶, and MC-38, 1.0 × 10⁶). All in vivo experiments were performed twice with similar results. *P < .05; **P < .01.
To further elucidate the roles of MHC-II in the antitumor effects of PD-1 blockade, we used the E.G7 and MC-38 cell lines expressing MHC-I, but not MHC-II, on the cell surface (supplemental Figure 2). Anti-PD-1 mAb significantly inhibited tumor growth compared with control mAb (supplemental Figure 3A). The frequencies of activated CD8+ T cells, which were assessed as the proportion of CD44+CD62L− effector/memory CD8+ T cells, TNF-α+IFN-γ+CD8+ T cells, and GrB+CD8+ T cells, were significantly higher in the TME of mice treated with anti-PD-1 mAb compared with mice treated with control mAb (supplemental Figure 3B-D). Thus, the antitumor efficacy against MHC-I–expressing solid tumors was mainly dependent on activating CD8+ T cells, as previously reported.6,12,13 We next generated MHC-I–deficient cell lines by deleting the B2M gene (supplemental Figure 2). In contrast to wild-type E.G7 and MC-38 tumors, MHC-I–deficient MC-38/B2MKO and E.G7/B2MKO tumors failed to respond to the PD-1 blockade (Figure 2B). Consistently, the frequencies of CD44+CD62L− effector/memory CD8+ T cells, TNF-α+IFN-γ+CD8+ T cells, and GrB+CD8+ T cells in the TME were comparable between mice treated with anti-PD-1 mAb and those treated with control mAb (supplemental Figure 4A-C). Exogenous MHC-II expression was established in these MHC-I–deficient cell lines by transfection of the class II major histocompatibility complex transactivator (CIITA) gene (E.G7/B2MKO/CIITA and MC-38/B2MKO/CIITA) (supplemental Figure 2).36 E.G7/B2MKO/CIITA tumors (MHC-I−MHC-II+) exhibited growth similar to that of E.G7/B2MKO tumors (MHC-I−MHC-II−) in immunocompromised (B6 SCID) mice, whereas these tumors grew significantly slower than E.G7/B2MKO tumors in immunocompetent (C57BL/6) mice, suggesting that MHC-II expression plays an important role in antitumor immunity, even in MHC-I–deficient tumors (Figure 2C). We then examined the antitumor effect of PD-1 blockade. The anti-PD-1 mAb significantly inhibited E.G7/B2MKO/CIITA and MC-38/B2MKO/CIITA tumor growth compared with the control mAb, as was observed for A20/OVA/B2MKO tumors (Figure 2D). These results indicate that MHC-II expressed by tumor cells contributes to both spontaneous and PD-1 blockade–mediated antitumor immunity, even in MHC-I–deficient tumors, which is consistent with previous studies showing that cHL responds to PD-1 blockade therapies in an MHC-II–dependent manner.11,20
Cytotoxic CD4+ T cells are essential for antitumor immunity in MHC-I−MHC-II+ tumors
Because our data for cHL samples revealed that CD4+ T cells infiltrated the TME of MHC-II–expressing cHL (Figure 1B-C), we explored tumor-infiltrating CD4+ T cells in MHC-II–expressing murine tumors. The frequency of CD4+ T cells and the ratio of CD4+ T cells/CD8+ T cells in the TME were significantly higher in MHC-I−MHC-II+ tumors than in control tumors (Figure 3A). In addition, larger amounts of CD4+ T cells harboring cytotoxic molecules were detected in the TILs of MHC-I−MHC-II+ tumors, meaning that some CD4+ T cells gained cytotoxic activity in MHC-I−MHC-II+ tumors (Figure 3B). Consistently, CD4+ T-cell deletion but not CD8+ T-cell deletion accelerated E.G7/B2MKO/CIITA (MHC-I−MHC-II+) tumor growth (Figure 3C), further supporting the critical role for cytotoxic CD4+ T cells in the antitumor efficacy on MHC-I−MHC-II+ tumors.
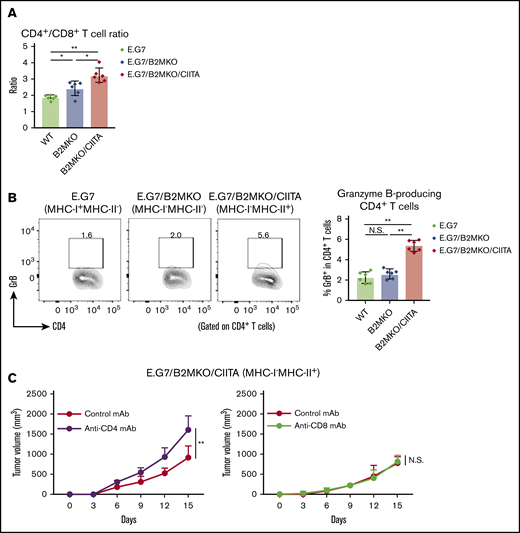
MHC-II expressed by tumor cells mediates antitumor immunity via cytotoxic CD4+T cells. (A) CD4+/CD8+ T-cell ratio in the TIL population. Tumor cells (5.0 × 10⁶) were inoculated subcutaneously. TILs were prepared from tumors 14 days after tumor cell inoculation and analyzed with flow cytometry (n = 6 per group). (B) Proportion of GrB+CD4+ T cells in the TIL population. The in vivo experiments were performed as described in panel A. Representative staining (left) and summary for the frequency (right) are shown. (C) Tumor growth of E.G7/B2MKO/CIITA in CD4+ T-cell– or CD8+ T-cell–deleted mice (left and right, respectively). Tumor cells (5.0 × 10⁶) were inoculated subcutaneously into C57BL/6 mice on day 0 (n = 6 per group). For CD4+ and CD8+ T-cell deletion, anti-CD4 mAbs and anti-CD8β mAbs, respectively, were administered intraperitoneally 1 day before tumor cell injection and every 7 days after tumor cell inoculation. Tumor growth was monitored every 3 days. All in vivo experiments were performed twice with similar results. *P < .05; **P < .01.
MHC-II expressed by tumor cells mediates antitumor immunity via cytotoxic CD4+T cells. (A) CD4+/CD8+ T-cell ratio in the TIL population. Tumor cells (5.0 × 10⁶) were inoculated subcutaneously. TILs were prepared from tumors 14 days after tumor cell inoculation and analyzed with flow cytometry (n = 6 per group). (B) Proportion of GrB+CD4+ T cells in the TIL population. The in vivo experiments were performed as described in panel A. Representative staining (left) and summary for the frequency (right) are shown. (C) Tumor growth of E.G7/B2MKO/CIITA in CD4+ T-cell– or CD8+ T-cell–deleted mice (left and right, respectively). Tumor cells (5.0 × 10⁶) were inoculated subcutaneously into C57BL/6 mice on day 0 (n = 6 per group). For CD4+ and CD8+ T-cell deletion, anti-CD4 mAbs and anti-CD8β mAbs, respectively, were administered intraperitoneally 1 day before tumor cell injection and every 7 days after tumor cell inoculation. Tumor growth was monitored every 3 days. All in vivo experiments were performed twice with similar results. *P < .05; **P < .01.
We also examined whether PD-1 blockade augmented the antitumor activity mediated by CD4+ T cells in E.G7/B2MKO/CIITA tumors. The frequencies of CD44+CD62L− effector/memory CD4+ T cells, TNF-α+IFN-γ+CD4+ T cells, and GrB+CD4+ T cells were significantly higher in the TIL population of E.G7/B2MKO/CIITA tumors treated with anti-PD-1 mAb than in that of those treated with control mAb (Figure 4A-C). Accordingly, the antitumor effect of PD-1 blockade was abrogated in CD4+ T-cell–deleted mice, but not in CD8+ T-cell–deleted mice (Figure 4D). Overall, CD4+ T cells, particularly cytotoxic CD4+ T cells, are essential for antitumor immunity in MHC-I−MHC-II+ tumors.
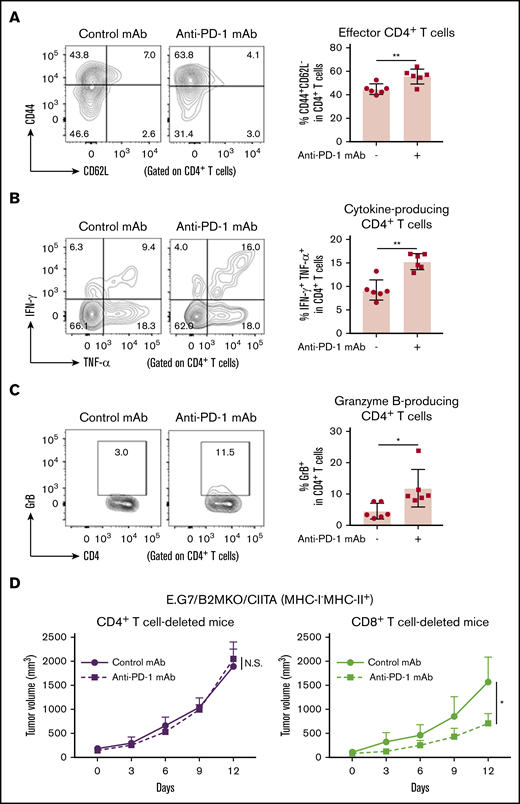
PD-1 blockade exhibits antitumor effects on MHC-I−MHC-II+tumors via cytotoxic CD4+T cells. (A-C) CD44+CD62L− effector/memory CD4+ T cells (A), TNF-α+IFN-γ+CD4+ T cells (B), and GrB+CD4+ T cells (C) in the TIL population of E.G7/B2MKO/CIITA tumors. Tumor cells (5.0 × 10⁶) were inoculated subcutaneously. Mice were grouped when the tumors reached ∼100 mm3 (day 0), and anti-PD-1 mAb was administered on days 0, 3, and 6. TILs were prepared from tumors 14 days after tumor cell inoculation and analyzed with flow cytometry (n = 6 per group). Representative staining (left) and summaries for the frequency of each cell population (right) are shown. (D) In vivo antitumor efficacy of anti-PD-1 mAb against E.G7/B2MKO/CIITA tumors in CD4+ or CD8+ T-cell–deleted mice. For CD4+ or CD8+ T-cell deletion, anti-CD4 mAb or anti-CD8β mAb, respectively, was administered intraperitoneally 1 day before tumor cell injection and every 7 days after tumor cell injection. All in vivo experiments were performed twice with similar results. *P < .05; **P < .01.
PD-1 blockade exhibits antitumor effects on MHC-I−MHC-II+tumors via cytotoxic CD4+T cells. (A-C) CD44+CD62L− effector/memory CD4+ T cells (A), TNF-α+IFN-γ+CD4+ T cells (B), and GrB+CD4+ T cells (C) in the TIL population of E.G7/B2MKO/CIITA tumors. Tumor cells (5.0 × 10⁶) were inoculated subcutaneously. Mice were grouped when the tumors reached ∼100 mm3 (day 0), and anti-PD-1 mAb was administered on days 0, 3, and 6. TILs were prepared from tumors 14 days after tumor cell inoculation and analyzed with flow cytometry (n = 6 per group). Representative staining (left) and summaries for the frequency of each cell population (right) are shown. (D) In vivo antitumor efficacy of anti-PD-1 mAb against E.G7/B2MKO/CIITA tumors in CD4+ or CD8+ T-cell–deleted mice. For CD4+ or CD8+ T-cell deletion, anti-CD4 mAb or anti-CD8β mAb, respectively, was administered intraperitoneally 1 day before tumor cell injection and every 7 days after tumor cell injection. All in vivo experiments were performed twice with similar results. *P < .05; **P < .01.
CD4+ T-cell infiltration, a favorable prognostic factor in cHL, is associated with the antitumor effect of PD-1 blockade on cHL
Considering the critical role of CD4+ T cells in antitumor immunity in MHC-II–expressing tumors, we further examined the effect of CD4+ T cells on survival in 76 patients with cHL who received first-line standard chemotherapy (doxorubicin, bleomycin, vinblastine, and dacarbazine). Five patients, from whom samples were obtained at relapse, were excluded from these survival analyses. Each cutoff value of CD4 (high, ≥425, vs low, <425), CD8 (high, ≥168.6, vs low, <168.6), and FOXP3 (high, ≥143.6, vs low, <143.6) counts was selected from ROC curves using 5-year survival (supplemental Figure 5A). CD4+ T-cell infiltration, but not CD8+ T-cell infiltration, was associated with a favorable prognosis in the patients with cHL (Figure 5A; supplemental Figure 5B). Furthermore, neither FOXP3+ T-cell infiltration, MHC-I expression, nor MHC-II expression was associated with the prognosis (supplemental Figure 5C-E). PD-L1 expression was related to worse PFS (supplemental Figure 5F). No clinicopathological features except MHC-II expression exhibited a significant correlation with CD4+ T-cell infiltration (supplemental Table 2). Accordingly, the multivariate analysis revealed that CD4+ T-cell infiltration was an independent prognostic factor, as were age and Ann Arbor stage (supplemental Table 3). Among the cHL patients in our cohort, 3 patients received anti-PD-1 mAb treatment. Tumor cells in 2 patients harbored MHC-II expression accompanied by CD4+ T-cell infiltration, and anti-PD-1 mAb monotherapy showed remarkable clinical benefits in both patients (Figure 5B-C; supplemental Table 4). Another patient with low CD4+ T-cell infiltration despite expression of MHC-II failed to respond to the treatment (supplemental Table 4).
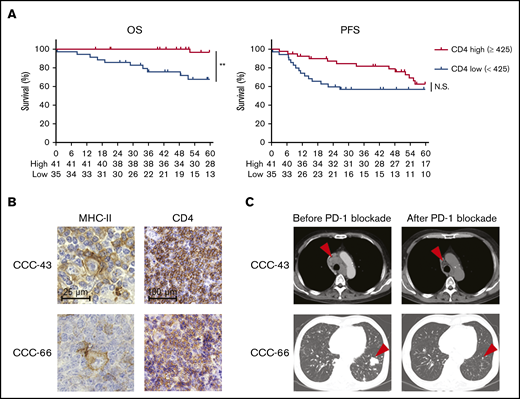
High CD4+T-cell infiltration, a favorable prognostic factor in cHL, is associated with antitumor effects induced by PD-1 blockade therapy. (A) OS and PFS according to CD4+ T-cell infiltration. The survival of 76 patients with cHL who received first-line standard chemotherapy (doxorubicin, bleomycin, vinblastine, and dacarbazine) was examined. The cohort was divided by a cutoff value (high, CD4 ≥425, vs low, <425) determined by the ROC curve. **P < .01. (B-C) Representative staining pictures for MHC-II and CD4 (B) and computed tomographic imaging (C) in patients with cHL who received anti-PD-1 mAb (nivolumab). IHC was conducted on FFPE sections (3 µm thick). Patient CCC-43 (64-year-old male) received nivolumab monotherapy as fourth-line therapy. He achieved a partial response after 8 cycles of nivolumab (arrowheads), and his performance status improved from 3 to 2. Patient CCC-66 (56-year-old male) received nivolumab monotherapy as fourth-line therapy and achieved a PR after 8 cycles of nivolumab (arrowheads).
High CD4+T-cell infiltration, a favorable prognostic factor in cHL, is associated with antitumor effects induced by PD-1 blockade therapy. (A) OS and PFS according to CD4+ T-cell infiltration. The survival of 76 patients with cHL who received first-line standard chemotherapy (doxorubicin, bleomycin, vinblastine, and dacarbazine) was examined. The cohort was divided by a cutoff value (high, CD4 ≥425, vs low, <425) determined by the ROC curve. **P < .01. (B-C) Representative staining pictures for MHC-II and CD4 (B) and computed tomographic imaging (C) in patients with cHL who received anti-PD-1 mAb (nivolumab). IHC was conducted on FFPE sections (3 µm thick). Patient CCC-43 (64-year-old male) received nivolumab monotherapy as fourth-line therapy. He achieved a partial response after 8 cycles of nivolumab (arrowheads), and his performance status improved from 3 to 2. Patient CCC-66 (56-year-old male) received nivolumab monotherapy as fourth-line therapy and achieved a PR after 8 cycles of nivolumab (arrowheads).
LAG-3 could be a target for combination treatment with PD-1 blockade in MHC-II–expressing tumors
Because LAG-3, which binds to MHC-II, is an immune checkpoint molecule that inhibits CD4+ T-cell activation,22,23 we investigated the role of LAG-3 in our MHC-I−MHC-II+ tumor models. First, LAG-3 expression by CD4+ T cells in the TME was examined. A considerable proportion of the CD4+ T cells in E.G7/B2MKO/CIITA tumors (MHC-I−MHC-II+) compared with those in E.G7/B2MKO tumors (MHC-I−MHC-I−) expressed LAG-3 accompanied by PD-1 (Figure 6A), suggesting that LAG-3 is a potential target for combination treatment with PD-1 blockade in MHC-I−MHC-II+ tumors. The antitumor effects of the anti-PD-1 mAb, anti-LAG-3 mAb, and their combination were tested in MHC-I−MHC-II+ tumors. Anti-LAG-3 mAb alone exhibited antitumor efficacy against MHC-I−MHC-II+ tumors but not against MHC-I+MHC-II− tumors (Figure 6B; supplemental Figure 6). Furthermore, the combination of anti-PD-1 mAb and anti-LAG-3 mAb exhibited far stronger antitumor efficacy against MHC-I−MHC-II+ tumors than either mAb alone (Figure 6B). The antitumor effect of anti-LAG-3 mAb against MHC-I−MHC-II+ tumors was totally abrogated in CD4+ T-cell–deleted mice but not in CD8+ T-cell–deleted mice (Figure 6C). Accordingly, the frequencies of CD44+CD62L− effector/memory CD4+ T cells, TNF-α+IFN-γ+CD4+ T cells, and GrB+CD4+ T cells were significantly higher in the TME of mice treated with anti-PD-1 mAb or anti-LAG-3 mAb than in that of those treated with control mAb (supplemental Figure 7A-C). Furthermore, the frequencies of these CD4+ T-cell subsets were further increased by combination treatment with anti-PD-1 and anti-LAG-3 mAbs (supplemental Figure 7A-C). Overall, LAG-3 blockade preferentially acts on MHC-I−MHC-II+ tumors via cytotoxic CD4+ T-cell–mediated antitumor immunity, and the combination of anti-PD-1 mAb and anti-LAG-3 mAb exhibits far stronger antitumor efficacy than either single treatment. In fact, the tumor-infiltrating CD4+ T cells in MHC-II–expressing cHL expressed both PD-1 and LAG-3 (supplemental Figure 1D). We therefore propose that LAG-3 blockade in combination with PD-1 blockade is a potential therapeutic approach in MHC-II–expressing tumors.
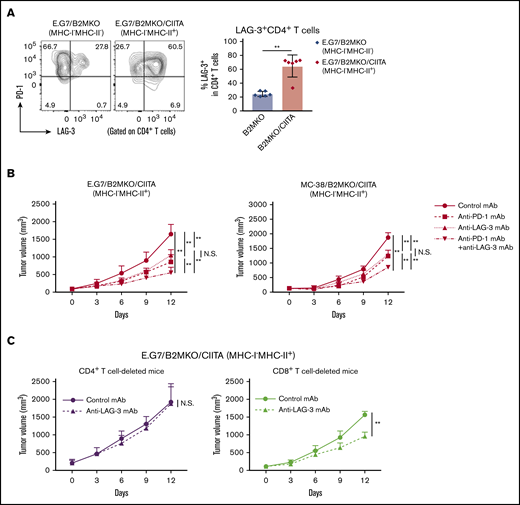
LAG-3 blockade exhibits antitumor effects on MHC-I−MHC-II+tumors mediated by CD4+T cells. (A) LAG-3 expression by tumor-infiltrating CD4+ T cells. Tumor cells (5.0 × 10⁶) were inoculated subcutaneously (n = 6 per group). TILs were prepared from tumors 14 days after tumor cell inoculation and analyzed with flow cytometry. Representative staining (left) and summary of the frequency of LAG-3+CD4+ T cells (right) are shown. (B) In vivo antitumor efficacies of anti-PD-1 mAb, anti-LAG-3 mAb, and a combination against E.G7/B2MKO/CIITA and MC-38/B2MKO/CIITA tumors. Tumor cells (E.G7, 5.0 × 10⁶, or MC-38, 1.0 × 10⁶) were inoculated subcutaneously. Mice were grouped when the tumors reached ∼100 mm3 (day 0), and ICIs were administered on days 0, 3, and 6 (n = 6 per group). Tumor growth was monitored every 3 days. (C) In vivo antitumor efficacy of anti-LAG-3 mAb against E.G7/B2MKO/CIITA tumors in CD4+ T-cell– or CD8+ T-cell–deleted mice. For CD4+ T-cell or CD8+ T-cell deletion, anti-CD4 mAb or anti-CD8β mAb, respectively, was administered intraperitoneally 1 day before tumor cell inoculation and every 7 days after. All in vivo experiments were performed twice with similar results. **P < .01.
LAG-3 blockade exhibits antitumor effects on MHC-I−MHC-II+tumors mediated by CD4+T cells. (A) LAG-3 expression by tumor-infiltrating CD4+ T cells. Tumor cells (5.0 × 10⁶) were inoculated subcutaneously (n = 6 per group). TILs were prepared from tumors 14 days after tumor cell inoculation and analyzed with flow cytometry. Representative staining (left) and summary of the frequency of LAG-3+CD4+ T cells (right) are shown. (B) In vivo antitumor efficacies of anti-PD-1 mAb, anti-LAG-3 mAb, and a combination against E.G7/B2MKO/CIITA and MC-38/B2MKO/CIITA tumors. Tumor cells (E.G7, 5.0 × 10⁶, or MC-38, 1.0 × 10⁶) were inoculated subcutaneously. Mice were grouped when the tumors reached ∼100 mm3 (day 0), and ICIs were administered on days 0, 3, and 6 (n = 6 per group). Tumor growth was monitored every 3 days. (C) In vivo antitumor efficacy of anti-LAG-3 mAb against E.G7/B2MKO/CIITA tumors in CD4+ T-cell– or CD8+ T-cell–deleted mice. For CD4+ T-cell or CD8+ T-cell deletion, anti-CD4 mAb or anti-CD8β mAb, respectively, was administered intraperitoneally 1 day before tumor cell inoculation and every 7 days after. All in vivo experiments were performed twice with similar results. **P < .01.
Discussion
PD-1 blockade provides a remarkable clinical response in cHL, regardless of the MHC-I expression status. Yet, detailed analyses of actual effector cells have not been reported. In this study, we found that CD4+ T cells, not CD8+ T cells, highly infiltrated the TME of MHC-II–expressing cHL. In animal models, MHC-II–expressing tumors favorably responded to anti-PD-1 mAb via cytotoxic activity by CD4+ T cells, even with the loss of MHC-I expression. Indeed, patients with MHC-II–expressing cHL harboring CD4+ T-cell infiltration markedly responded to PD-1 blockade therapy. Furthermore, LAG-3, another immune checkpoint molecule that binds to MHC-II, was highly expressed by tumor-infiltrating CD4+ T cells with PD-1 expression in MHC-II–expressing tumors, and PD-1 and LAG-3 dual blockade exhibited far stronger antitumor efficacy than blockade of either molecule. Considering the high PD-1+LAG-3+CD4+ T-cell infiltration in MHC-II–expressing tumors, LAG-3 blockade could be a potential candidate approach for combination treatment with PD-1 blockade.
We generated MHC-I–deficient tumor cell lines by deleting B2M, an essential component of MHC-I.35 As expected, the MHC-I–deficient tumors, which could not interact with CD8+ T cells, were resistant to PD-1 blockade. In accordance with this finding, B2M loss reportedly correlates with tumor progression and is an important mechanism of resistance to immune checkpoint inhibitors (ICIs).14-17 On the other hand, PD-1 blockade exhibited antitumor efficacy against MHC-II–expressing tumors, even with the loss of MHC-I expression in our animal models, which was abrogated by CD4+ T-cell deletion. CD4+ T cells are generally crucial in helping to prime CD8+ T cells by providing cytokines and licensing antigen-presenting cells.37 Tumor antigen-specific CD4+ T cells, which help to prime/activate tumor-specific CD8+ T cells, play a crucial role in antitumor immunity in MHC-I–expressing tumors.38 In addition, MHC-II expressed by tumor cells in addition to MHC-I augments the antitumor efficacy of ICIs, further supporting the importance of CD4+ T-cell help.39 In contrast, the antitumor efficacy of PD-1 blockade was observed in MHC-II–expressing tumors, even in CD8+ T-cell–deleted mice, in our study. One can envision that CD4+ T cells may directly attack MHC-I−MHC-II+ tumors by recognizing peptide-MHC-II complexes. CD4+ T cells with cytotoxic activity against virus-infected cells and tumor cells have been reported to be cytotoxic CD4+ T cells.40-42 In patients with cHL, which frequently expresses MHC-II, that expression, but not MHC-I expression, is reportedly associated with a favorable prognosis for PD-1 blockade therapies.18-21 Although PD-1 expression by CD8+ T cells is associated with clinical responses in solid tumors, such as malignant melanoma and non–small-cell lung cancer, in which CD8+ T cells directly kill tumor cells,43,44 our study revealed that PD-1+CD4+ T cells infiltrated the TME in MHC-II–expressing cHL, further indicating the essential role of CD4+ T cells in PD-1 blockade–mediated antitumor immunity in MHC-II–expressing cHL lacking MHC-I expression. Several studies have demonstrated that PD-1+CD4+ T cells rather than CD8+ T cells highly infiltrated the TME in cHL.32,45 Indeed, some patients with MHC-II–expressing cHL harboring CD4+ T-cell infiltration responded to PD-1 blockade in our cohort. Considering the dramatic clinical responses of ICIs in cHL and our results,11,20 we propose that PD-1 blockade can be an important choice according to MHC expression, and CD4+ and CD8+ T-cell infiltration. Especially, cHL with MHC-II expression and high CD4+ T-cell infiltration would be a good candidate for PD-1 blockade, suggesting a potential biomarker. Furthermore, comprehensive analyses such as multiplex IHC, flow cytometry, CyTOF, and scRNAseq beyond single-molecule IHC in tumor tissues have been introduced to elucidate detailed immune profiling.46 Such technologies should help us to develop suitable immunotherapy based on immune profiling in the future.
LAG-3 is another immune checkpoint molecule that inhibits immune responses.22,23 LAG-3 expression is reportedly related to resistance to PD-1 blockade therapies.47,48 The immunosuppressive effects of LAG-3 are mainly dependent on CD4+ T cells through binding to the peptide and MHC-II on antigen-presenting cells.23 Although LAG-3 blockade therapies are now under intense investigation in the clinic upon the success of CTLA-4 blockade and PD-1/PD-L1 blockade therapies, significant antitumor efficacy has not been shown, even with combination therapy.49,50 Consistently, our study demonstrated that anti-LAG-3 mAb alone exhibited insufficient antitumor effects on MHC-I+MHC-II− tumors, as observed in previous studies.51 In contrast, LAG-3 was highly expressed by CD4+ T cells in the TME of MHC-II–expressing tumors, even with the loss of MHC-I expression, and anti-LAG-3 mAb alone exhibited an antitumor effect, as did anti-PD-1 mAb, mediated by cytotoxic CD4+ T cells in our animal models. Furthermore, combination treatment with anti-PD-1 mAb and anti-LAG-3 mAb exhibited far stronger antitumor efficacy on MHC-II–expressing tumors than either mAb alone. Similar results were also reported in an MHC-I+MHC-II+ mouse breast tumor model.48 These findings suggest a possible application of this combination treatment in MHC-II–expressing cancers, including cHL, regardless of MHC-I expression status. In fact, phase I and II clinical trials investigating the combination of anti-LAG3 mAb and anti-PD-1 mAb against hematologic malignancies including cHL are ongoing (www.clinicaltrials.gov NCT02061761 and NCT03598608).
Our study requires careful interpretation, because there are several limitations. An ideal tumor model would mirror human disease in various characteristics such as size, histology, and growth speed. In this point, spontaneous tumor development model at the orthotopic tissue would be ideal. Although these syngeneic animal models offer an important clue for oncology research, there is no syngeneic cHL mouse model, resulting in the difficulty in addressing the clinical questions directly from animal models. We then employed other lymphoma models (A20 and E.G7) and a solid tumor model (MC-38) instead of a cHL mouse model. Tumor cell lines with various expression patterns of MHC were developed to reflect the patterns of MHC-I and MHC-II expression observed in cHL. In these models, PD-1 blockade activated effector T cells, such as CD4+ T cells in the TME, according to the expression patterns of MHC. Anti-PD-1 mAb exhibited antitumor effects on MHC-I−MHC-II+ tumors, but not on MHC-I−MHC-II− tumors in a cytotoxic CD4+ T-cell–dependent manner. Thus, we believe that our models could imitate the TME of cHL. Furthermore, we extended this finding to other cancer types using an MC-38 solid tumor model, which is frequently used in cancer immunology studies. PD-1 blockade exhibited antitumor efficacy against MHC-II–expressing MC-38 tumors, regardless of MHC-I expression via cytotoxic CD4+ T cells, generalizing our findings. Indeed, MHC-II is reportedly expressed by other solid tumor cancers, including melanoma, breast, colorectal, and lung, which can be related to improved prognosis.52 In addition, several studies have demonstrated that MHC-II expression is related to the efficacy of PD-1 blockade therapies regardless of MHC-I expression.53,54
Another important point is the involvement of other immune-related factors such as innate immunity and tumor intrinsic signals. The TME of cHL possesses various innate immune cells such as macrophages and dendritic cells.32,55 These cells also possess MHC-II expression and act as antigen-presenting cells, which may be involved in antitumor immunity. In addition, HRS cells have complementary mechanisms of immune evasion including alterations of NF-κB, JAK/STAT, PI3K signals, PD-L1, and B2M, all of which are crucial for immune responses.56 To elucidate the involvement of these mechanisms in cHL immunotherapy, further studies are warranted.
In summary, we have demonstrated that cytotoxic CD4+ T cells play an essential role in both spontaneous and PD-1 blockade–mediated antitumor immunity in MHC-II–expressing tumors, including cHL, even without MHC-I expression. Furthermore, LAG-3 was highly expressed by tumor-infiltrating CD4+ T cells in MHC-II–expressing tumors, and LAG-3 blockade exhibited antitumor efficacy against these tumors mediated by cytotoxic CD4+ T cells. Cytotoxic CD4+ T cells are important effector cells in cHL, partially because of the loss of MHC-I expression, and LAG-3 could be a therapeutic target in MHC-II–expressing cancers, including cHL.
Original data are available by e-mail request to the corresponding authors (hnishika@ncc.go.jp or ytogashi1584@gmail.com).
Acknowledgments
The authors thank Y. Tada, T. Takaku, M. Nakai, K. Onagawa, M. Takemura, M. Hoshino, K. Yoshida, Y. Osada, and A. Odaka for technical assistance.
This study was supported by Grants-in-Aid for Scientific Research S grant 17H06162 (H. Nishikawa); Young Scientists grant 17J09900, Challenging Exploratory Research grant 19K22574, and B grant 20H03694 from the Ministry of Education, Culture, Sports, Science and Technology of Japan (Y.T.); the Project for Cancer Research and Therapeutic Evolution (P-CREATE) grants 16cm0106301h0002 (H. Nishikawa) and 18cm0106340h0001 (Y.T.); Practical Research for Innovative Cancer Control grant 19ck0106521h0001 (Y.T.); the Development of Technology for Patient Stratification Biomarker Discovery grant 19ae0101074s0401 (H. Nishikawa) from the Japan Agency for Medical Research and Development (AMED); National Cancer Center Research and Development Fund grants 28-A-7 and 31-A-7 (H. Nishikawa); the Naito Foundation (Y.T. and H. Nishikawa); and a Chiba Prefecture research grant, the Takeda Science Foundation, the Mitsubishi Foundation, the Tokyo Biochemical Research Foundation, the Daiichi Sankyo Foundation, and the Foundation for Promotion of Cancer Research in Japan (Y.T.).
Authorship
Contribution: Y.T. and H. Nishikawa conceived and designed the study; J.N., Y.T., M.I., M.S., Y.O., M.T., and H. Nishikawa developed the methodology; J.N., Y.T., T.S., N.Y., J.Y., M.T., and H. Nishikawa acquired the data; T.S., N.Y., J.Y., Y.M., and M.T. collected clinical samples and data; H. Nakamae, M.H., and H. Nishikawa supervised the study; and all authors wrote, reviewed, and/or revised the manuscript and all authors read and approved the final manuscript.
Conflict-of-interest disclosure: Y.T. received a research grant from KOTAI Biotechnologies, Inc, and honoraria from Ono Pharmaceutical, Bristol-Myers Squibb, AstraZeneca, Chugai Pharmaceutical, and MSD outside of this study. M.S. received a research grant from Sysmex outside of this study. Y.M. received a research grant from Ono Pharmaceutical and honoraria from Bristol-Myers Squibb, Novartis, and Pfizer outside of this study. H. Nakamae received research grants and honoraria from Bristol-Myers Squibb, Novartis, and Otsuka Pharmaceutical; research grants from MSD, Janssen Pharmaceutical, and Astellas Pharmaceutical; and honoraria from Pfizer, Kyowa-Kirin, and Takeda outside of this study. M.H. received a research grant and honoraria from Pfizer; research grants from Kyowa-Kirin, Chugai Pharmaceutical, Otsuka Pharmaceutical, Astellas Pharmaceutical, Takeda, MSD, Sumitomo Dainippon Pharmaceutical, Taiho Pharmaceutical, Teijin, Eisai, and Japan Blood Products Organization; and honoraria from Novartis and Bristol-Myers Squibb outside of this study. H. Nishikawa received research grants and honoraria from Ono Pharmaceutical, Chugai Pharmaceutical, and Bristol-Myers Squibb; honoraria from MSD; and research grants from Taiho Pharmaceutical, Daiichi-Sankyo, Kyowa Kirin, Zenyaku Kogyo, Oncolys BioPharma, Debiopharma, Asahi-Kasei, Astellas Pharmaceutical, Sumitomo Dainippon Pharma, Fuji Film, SRL, Sysmex, and BD Japan outside of this study. The remaining authors declare no competing financial interests.
Correspondence: Hiroyoshi Nishikawa, Division of Cancer Immunology, Research Institute/EPOC, National Cancer Center, 6-5-1 Kashiwanoha, Kashiwa, Chiba 277-8577, Japan; e-mail: hnishika@ncc.go.jp; and Yosuke Togashi, Research Institute, Chiba Cancer Center, 666-2 Nitona-cho, Chuo-ku, Chiba 260-8717, Japan; e-mail: ytogashi1584@gmail.com.

