

Key Points
Lectin microarrays accurately distinguish ABO glycoprotein expression variability.
Alterations in the glycocalyx are associated with A and B antigen expression.

Abstract
Serological classification of individuals as A, B, O, or AB is a mainstay of blood banking. ABO blood groups or ABH antigens, in addition to other surface glycans, act as unique red blood cell (RBC) signatures and direct immune responses. ABO subgroups present as weakened, mixed field, or unexpected reactivity with serological reagents, but specific designations remain complex. Lectins detect glycan motifs with some recognizing ABH antigens. We evaluated a 45-probe lectin microarray to rapidly analyze ABO blood groups and associated unique glycan signatures within complex biological samples on RBC surface glycoproteins. RBC membrane glycoproteins were prepared from donor RBCs, n = 20 for each blood group. ABO blood group was distinguishable by lectin array, including variations in ABH antigen expression not observed with serology. Principal component analysis highlighted broad ABO blood group clusters with unexpected high and low antigen expression and variations were confirmed with ABH antibody immunoblotting. Using a subset of lectins provided an accurate method to predict an ABO serological phenotype. Lectin microarray highlighted the importance of ABO localization on glycoproteins and glycolipids and pointed to increased glycocalyx complexity associated with the expression of A and B antigens including high mannose and branched polylactosamine. Thus, lectins identified subtle surface ABO blood group glycoprotein density variations not detected by routine serological methods. Transfusion services observe alterations in ABH expression during malignancy, and ABO incompatible solid organ transplantation is not without risk of rejection. The presented methods may identify subtle but clinically significant ABO blood group differences for transfusion and transplantation.
Introduction
Classification of individuals as A, B, O, or AB serologically continues to be a mainstay of blood banking.1 Unlike protein-based blood group systems, red blood cell (RBC) glycan antigens (eg, ABH, i/I, Lewis blood groups) rely on glycosyltransferases to add specific glycan moieties on to protein and lipid constructs. On RBCs, blood group glycosyltransferases add glycans in a stepwise manner to core type II (Galβ1-4GlcNAcβ1-R), type III (Galβ1-3GalNAcα1-R), and type IV (Galβ1-3GalNAcβ1-R) structures with the addition of the H antigen (group O, Fucα1-2Galβ1-4GlcNAc) first deposited by the FUT1 fucosyltransferase. The α1-3-N-acetylgalactosamine transferase builds on the initial H antigen to synthesize either the A (GalNAcα1-3(Fucα1-2)Galβ1-4GlcNAc) or B (Galα1-3(Fucα1-2)Galβ1-4GlcNAc) antigen, or in combination to produce the AB blood group.2 ABO expression is referred to here as ABH in the context of antigens and can decorate N-linked glycans, O-linked glycans, and glycolipids, lending complexity to their expression patterns.
Inter-blood group variability of antigen density and glycosylation sites on proteins and lipids is a naturally occurring phenomenon.3 The differential expression of A or B antigens is referred to as ABO subgroups. The differences in ABO subgroups result from alterations in enzyme efficiency and enzyme specificity for core lipids or glycoproteins acceptor sites.3 RBC typing has highlighted variability in ABO reactivity (agglutination) from the same individual over time with different blood typing reagents, because ABO reagents specific to glycan core types II-IV alter agglutination strength and appear weakened, mixed field, or give unexpected reactivity.4-8
Monoclonal antibody epitope recognition determining blood group status relies on the ABH glycan structure and the underlying carrier protein or lipid.9 Differential ABH expression patterns can rarely lead to incomplete or erroneous binding with manufactured monoclonal antibodies.10 To combat this, blood typing reagents are developed to produce robust ABO-dependent agglutination even in the setting of weakened antigen expression and, thus, the obtained results likely present an oversimplification blood group diversity.
Lectins can interrogate differences between glycan structures in a way that monoclonal reagents lack10 because they are adapted to recognize a bevy of similar glycan structures, while maintaining specificity for an epitope class. They can bind ABO blood groups and subgroups selectively.11 Thus, several lectins became indispensable in routine blood banking as they agglutinate particular ABO subgroups (eg, Dolichos biflorus agglutinin [DBA] agglutinating A1 but not A2 RBCs), especially in the setting of transplantation.12,13 However, lectin RBC agglutination is read as an all-or-nothing result without consideration of antigen expression variability, which has led to erroneous blood group subtyping and hyperacute organ rejection.14
Adaption of high-throughput microarrays spotted with a multitude of lectins, including lectins that recognize blood groups, may complement current methods for a more thorough interpretation of RBC ABH expression.15,16 Although many lectins have the ability to bind unique blood group antigens, few are tested for ABO-specific agglutination and, thus, limit their use in transfusion medicine. Our aim was to apply a 45-lectin microarray17-20 to explore ABO blood groups and related glycan changes on RBCs, and apply predictive statistical methods to model blood group identification by lectins.
Our data showed that ABO affinities of lectins differentiated healthy donor RBC membrane glycoproteins into unique ABH glycan groups that recapitulated serological blood groups. Principal component analysis (PCA) visualized clusters blood groups and could distinguish clusters of donors with unique ABO subgroups. Immunoblotting with anti-A, anti-B, and anti-H antibodies using identical RBC membrane glycoprotein samples confirmed the observations of the lectin microarray. Additionally, our data showed an increase of glycan complexity in terminal and high mannose and branching polylactosamine moieties with A and B antigens. Thus, unlike serological ABO antibodies, the lectin microarray was sensitive to antigen distribution and density on glycoproteins and distinguished between more subtle glycan epitopes.
Material and methods
Sample demographics
This study was approved by the institutional review board to gather residual fresh whole blood from African American donors with associated demographics to include age, sex, ABO blood group, and collection date for each sample. ABO blood group was defined as the result from serologic testing on an automated platform (Automated Microplate System, Beckman Coulter) that assessed the ABO status on RBCs and the presence or absence of anti-A and anti-B antibodies in plasma. Twenty samples of each blood type were collected.
Glycoprotein cell fraction preparation
Whole blood collected into EDTA tubes was separated into components by centrifugation at 1500g, 10 minutes on day 7 after collection to control for age-related changes of RBCs during storage (Figure 1). RBCs were isolated21 and prepared as RBC ghosts by lysing and alternating washing and centrifugation (4800g, 45 minutes) with in Milli-Q water containing protease inhibitor (Complete EDTA-free Protease Inhibitor Cocktail, Sigma) and 1x phosphate-buffered saline (pH 8.0).22,23 Once RBC ghosts were white in color, RBC membrane proteins were extracted with the Mem-Per Plus Kit (Thermo Fisher Scientific). Extracted samples were stored at −20°C.
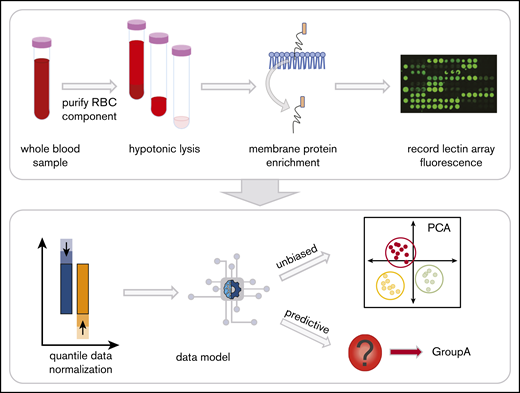
Red blood cell (RBC) processing and workflow. Whole blood in EDTA was centrifuged to fractionate the blood into components. The plasma and white blood cell layers are removed, leaving the RBC layer. Hemoglobin was then removed with successive washes of hypotonic phosphate-buffered saline until a white erythrocyte pellet remained. The glycoproteins were extracted with a selective detergent using a commercially available kit. Glycoprotein fractions were interrogated by lectin microarray and analyzed with unbiased and predictive data models.
Red blood cell (RBC) processing and workflow. Whole blood in EDTA was centrifuged to fractionate the blood into components. The plasma and white blood cell layers are removed, leaving the RBC layer. Hemoglobin was then removed with successive washes of hypotonic phosphate-buffered saline until a white erythrocyte pellet remained. The glycoproteins were extracted with a selective detergent using a commercially available kit. Glycoprotein fractions were interrogated by lectin microarray and analyzed with unbiased and predictive data models.
Lectin array acquisition and analysis
The total protein content from each extracted cell fraction was determined using the Micro BCA Protein Assay Kit (Thermo Fisher Scientific).23 Samples were diluted to 50 µg/mL in phosphate-buffered saline with 100 μg of Cy3 monoreactive dye pack (GE Healthcare). After a 1-hour room temperature incubation in the dark, excess Cy3 was removed using a Zeba Spin Desalting Column (Thermo Fisher Scientific). Samples were diluted to 0.25 µg of total protein with Probing Solution (Glycotechnica) and incubated on the LecChip (Glycotechnica) for 8 hours. The LecChip was chosen as a testing platform because it provided a wide selection of lectins compared with other commercially available microarrays. Fluorescent microarray images were acquired using an evanescent-field fluorescence scanner (GlycoStation Reader 2200; Glycotechnica). Raw fluorescence for each spot was captured, with triplicate values summed, and compared across individual lectins by merging exposure images with Signal Capture and GlycoStation Tools Pro (v3, Glycotechnica). Fluorescence data were background subtracted and negative lectin values converted to 0. Lectin specificities were collated from published literature (supplemental Table 1).
Grid immunoblotting (dot blot)
Samples were applied in a grid format to the membrane PVDF membranes (Bio-RadCA), twice, in 5-µL aliquots at 10 µg/mL. The membrane was blocked with Carbo-Free Blocking Solution (Vector Laboratories) and 3% bovine serum albumin (Roche). After blocking, the primary antibody was applied and allowed to incubate for an hour at room temperature. Anti-A mouse immunoglobulin G (IgG; VA4-20B, Novus, Biologicals) was diluted to 1 µg, anti-B mouse IgG (BGRL2, IBGRL) was diluted to 0.55 µg, and anti-H mouse IgG (BRIC198, IBGRL) was diluted to 0.057 µg when applied to the PVDF membrane. Membranes were washed 3 times with Tris-Buffered Saline and 0.1% Tween and probed with a goat anti-mouse IgG horseradish peroxidase-conjugated secondary antibody. Membranes were washed with Tris-Buffered Saline and 0.1% Tween. SuperSignal West Pico Plus Chemiluminescent Substrate (Thermo Fisher Scientific) was added to the membrane and imaged (Amersham Imager 680, GEGE Healthcare).
Statistical analysis
Background-subtracted fluorescent intensity data were imported into R.24 Lectins with no binding were excluded from the analysis. Data were quantile normalized and were visualized with a z-scaled heat map (and unsupervised hierarchical clustering. PCA was conducted and the first 2 principal components were plotted. Fluorescence for each lectin was then fit to a linear regression model and moderated t statistics. Statistical testing was conducted across ABO blood groups, age, and sex using analysis of variance.2 P values were corrected for multiple testing across lectins using the Benjamini-Hochberg method.
To predict and correctly classify ABO groups by lectins only, sparse partial least squares discriminant analysis was applied to the data set.25 The data were annotated with reported serological blood group, and only lectins that resolved blood group differences were selected for analysis. Mfold cross-validation optimized and validated the number of lectins and principal components chosen for predicting ABO groups in the data model. The optimal dimensions and lectins to predict each blood group were analyzed with fivefolds and 10 000 repeats; data distances were calculated by the maximum distance to find an optimal balanced error rate. Three-quarters of the data were allocated as a training set, whereas the remaining data were used to test the predicted model for each repeat. Data were visualized with prediction plots, plot loadings, and receiver operator characteristic curves to measure accuracy of the model.
Results
Twenty healthy donors were collected per ABO blood group. The overall mean age of donors was 50 years and 53% of the donors were female. RBC membrane glycoproteins were interrogated with 45 lectins and subjected to quantile normalization to account for biological and lot-to-lot variability of lectins. Lectin fluorescence patterns were analyzed for associations with age, sex, and serologic ABO blood group. Unsupervised hierarchical clustering and analysis of variance of lectin binding showed only significant changes by ABO blood group compared with clustering by age or sex (P = .88 and .98, respectively).
Lectin microarrays revealed innate clustering by ABO blood group using PCA
We tested if combining 45 lectin specificities could identify ABH glycans and other unique glycan moieties associated with blood groups. Only some lectins on the array were previously described to have ABO blood group affinities with examples including: UEA-I,26,27 HPA,28 and LTL,29 which bind the H antigen; DBA13 and VVA,28 which bind the A antigen; and EEL,30 which binds the B antigen. There were a total of 34 lectins of 45 printed lectins (Figure 2A) that bound RBC glycoproteins. The 11 remaining lectins had no binding signal and were removed from interpretation. Unsupervised hierarchical clustering showed an association of increased binding to specific lectins with blood group specificity. DBA binding distinguished group A, UEA-I linked group O, EEL distinguished group B, and NPA linked group AB individuals.
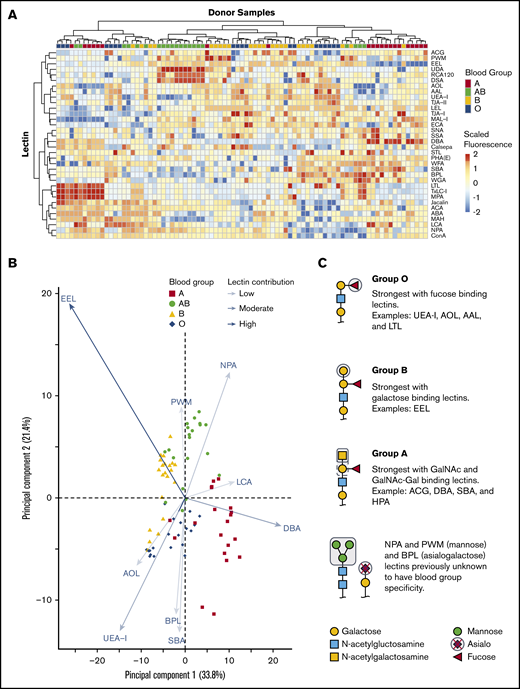
Unsupervised hierarchical clustering of lectin microarray fluorescence. (A) Lectin array heatmap of scaled quantile normalized healthy donor fluorescence. The normalized lectin microarray fluorescence data were scaled per row (lectin) to standardize the comparisons between samples. Red boxes represent higher fluorescence; blue boxes represent decreased fluorescence. Unsupervised hierarchical clustering of blood groups (top row) based on similar heat map patterns of lectin binding is shown. Individual lectins are indicated in the right column. (B) Principal component analysis of serologically identified blood group donors using lectin microarrays. The combination of all fluorescing lectins is reduced into a 2-dimensional format. The influence of a lectin is depicted by the length of the line and depth of color. The 9 statistically significant lectins are displayed. (C) Glycan structure cartoons depicting lectin binding preferences, indicated as gray boxed areas, are shown for each blood group. Selected lectins with known ABO specificity are indicated for group O (UEA-I, AOL, AAL, EEL, LCA), A (DBA, SBA, ACA), and B (EEL). Lectins previously unknown to have blood group specificity that influenced by ABO blood groups are also indicated (NPA and PWM), with these lectins recognizing mannose moieties.
Unsupervised hierarchical clustering of lectin microarray fluorescence. (A) Lectin array heatmap of scaled quantile normalized healthy donor fluorescence. The normalized lectin microarray fluorescence data were scaled per row (lectin) to standardize the comparisons between samples. Red boxes represent higher fluorescence; blue boxes represent decreased fluorescence. Unsupervised hierarchical clustering of blood groups (top row) based on similar heat map patterns of lectin binding is shown. Individual lectins are indicated in the right column. (B) Principal component analysis of serologically identified blood group donors using lectin microarrays. The combination of all fluorescing lectins is reduced into a 2-dimensional format. The influence of a lectin is depicted by the length of the line and depth of color. The 9 statistically significant lectins are displayed. (C) Glycan structure cartoons depicting lectin binding preferences, indicated as gray boxed areas, are shown for each blood group. Selected lectins with known ABO specificity are indicated for group O (UEA-I, AOL, AAL, EEL, LCA), A (DBA, SBA, ACA), and B (EEL). Lectins previously unknown to have blood group specificity that influenced by ABO blood groups are also indicated (NPA and PWM), with these lectins recognizing mannose moieties.
PCA plot clustering revealed 9 lectins that significantly separated blood groups: UEA-I, AOL, EEL, DBA, NPA, PWM, SBA, BPL, and LCA (supplemental Figure 1; Figure 2B). The position of each donor within the plot was dictated by combination of interactions with specific lectins on each axis indicated by arrow length and color intensity. Selected simplified glycan structures are indicated in Figure 2C with exemplified lectin ABO specificity for groups O (UEA-I, AOL, AAL, EEL, LCA),26,27,31-34 A (DBA, SBA, ACA),13,28,35 and B (EEL).30 NPA and PWM, with binding preferences toward terminal and high mannose, associated with group AB. NPA and PWM were not previously associated with blood group specificities. Overall, the unique combination of lectin binding clustered similar blood types on the PCA plot and revealed that blood groups O and B were the most heterogeneous in distribution.
Pairwise comparisons further confirm lectin associations between blood groups
ABH antigen expression is not absolute.2 Depending on the enzyme efficiency, a small to large fraction of the H antigen converts to A, B, or A and B antigens. Thus, the H antigen is always present, independent of blood type, and typically decreases in expression as follows: AB > A > B. To determine more detailed recognition patterns of the lectin array data toward specific blood groups, we additionally applied moderated t-tests to identify pairwise changes (Table 1).
Pairwise comparison of statistically significant lectins between ABO blood types with adjusted P < .5
| Lectins | O vs A | O vs B | O vs AB | A vs AB | B vs A | B vs AB | General lectin specificity | Blood group preference* |
|---|---|---|---|---|---|---|---|---|
| LTL | ● | Fucose | O | |||||
| LCA | ○ | Fucose | ||||||
| UEA-I | ● | ● | ● | ● | ● | ● | Fucose | O |
| AOL | ● | ● | ● | ● | ● | Fucose | O | |
| AAL | ● | ● | ● | Fucose | O | |||
| EEL | ● | ○ | ○ | ○ | ● | Fucose | B, O | |
| RCA120 | ○ | Galactose | ||||||
| ACG | ○ | ○ | ○ | Galactose | A | |||
| BPL | ● | ● | Galactose | O > A,B | ||||
| TJA-II | ● | ● | Galactose | O | ||||
| ACA | ○ | ○ | ○ | Galactose | ABO equally | |||
| DBA | ○ | ○ | ● | ○ | GalNAc | A1 | ||
| MAH | ● | Sialylated galactose | ||||||
| SBA | ● | ● | GalNAc | |||||
| UDA | ○ | ○ | ○ | Mannose, GlcNAc | A1 | |||
| NPA | ○ | ○ | Mannose | |||||
| PWM | ○ | ○ | Mannose | |||||
| DSA | ○ | ○ | PolyLacNAc | |||||
| PHA(E) | ○ | ○ | Complex sugars | ABO equally | ||||
| Calsepa | ○ | Complex sugars |
Red blood cell blood groups are indicated as O, A, B, and AB.
○, decreased lectin binding; ●, increased lectin binding; Gal, galactose; GalNAc, N-acetylgalactoseamine mannose; GlcNAc, N-acetylglucosamine; Poly LacNAc, poly lactosamine.
Only published reports were included for ABO lectin specificity.
Lectins associated with fucose (AOL, AAL, EEL, UEA-I, LTL) recognized group O most strongly, followed by groups B, A, and AB. The separation of groups A, B, and AB, however, relied on recognition of terminal galactose and N-acetylgalactosamine. Group A had increased binding to the primary defining sugar GalNAc (DBA, SBA). TJA-II bound group A more readily than group AB because of the comparative availability of the H antigen. The distinguishing feature of group B was driven by strong EEL binding, which was consistent with data shown in Figure 2B and reports that EEL agglutinates blood groups B and O RBCs.30,33 Weaker binding of fucose-based lectins (UEA-I, AOL, AAL, LTL) distinguished group B RBCs compared with group O.30,33 Group AB samples were defined by lectins with GalNAc or galactose preference: EEL, ACG, ACA, BPL, and DBA. AB samples reacted most weakly with fucose-binding lectins AOL and UEA-I.
Unexpected reactivity was observed with SBA, mannose-binding (NPA, UDA, and PWM), and polylactosamine-binding (DSA) lectins. SBA has a similar reactivity profile to DBA in preferentially binding A1 RBCs more than A2 but binds the A antigen on lipid-based carriers rather than glycoproteins, likely explaining the unexpected SBA binding.28 Increased terminal and high mannose in groups A and AB was also observed. Mannose comprises the backbone of N-linked glycoproteins that bifurcates simply or form more complex branching36 ; initial work observed slightly increased fractions of mannose in RBCs expressing the A and B antigens with no localization or structural work completed.37-39 Our results agreed with these findings and demonstrated the changes as terminal and high mannose (NPA, UDA, and PWM). The remaining mannose-binding lectins, which do not preferentially bind terminal mannose structures, showed no statistically significant change.
AB individuals expressed more I antigen compared with groups O and A. The i/I blood group system is the most abundant polylactosamine glycan on the surface of RBCs.40,41 After birth, the i antigen is replaced by the I antigen by 18 months, whereby β-1,6-N-acetylglucosaminyltransferase converts the unbranched lactosamine (i antigen) into a branching lactosamine structure (I antigen).40,42 The array contained 3 polylactosamine recognizing lectins (DSA, LEL, and STL).43-45 DSA binding was stronger in AB individuals compared with groups O and A. DSA, but not LEL, can interact with branched polylactosamine structures and suggested an increased expression of I antigen. LEL and STL were not statistically significant. Taken together, lectins with ABO blood group specificity largely behaved as expected using a moderated Student t test. The analysis revealed non-group O individuals had increased mannose and polylactosamine structures, lending to a more complex RBC glycocalyx.
Immunoblotting confirmed weakened ABO blood group expression on glycoproteins
A subset of donors had weakened or absent ABH glycoprotein expression by lectin microarray compared with the serology (Figure 3). Immunoblotting with monoclonal anti-A, anti-B, and anti-H antibodies were used to confirm altered glycoprotein ABH levels. Figure 3A represents numbered samples of individuals analyzed by PCA in Figure 2B.
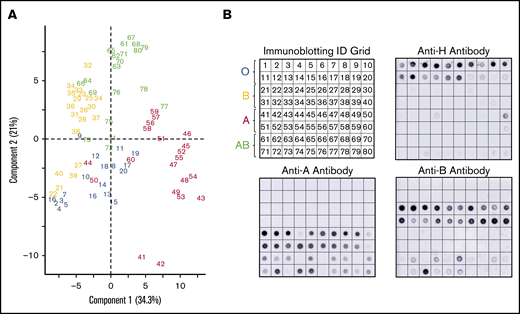
Corresponding immune-blots confirm weakened expression of ABO, identified by PCA of serologically identified donors. PCA plot displayed by sample identification (A) and matching immunoblotting with anti-H, anti-A, and anti-B. Anti-A and anti-B dot blots (B) demonstrated weakened glycoprotein expression observed as outliers in the PCA plot. Weakened expression was accompanied by slight to moderate increases in H antigen in most samples.
Corresponding immune-blots confirm weakened expression of ABO, identified by PCA of serologically identified donors. PCA plot displayed by sample identification (A) and matching immunoblotting with anti-H, anti-A, and anti-B. Anti-A and anti-B dot blots (B) demonstrated weakened glycoprotein expression observed as outliers in the PCA plot. Weakened expression was accompanied by slight to moderate increases in H antigen in most samples.
PCA clustered 3 group A donors (44, 50, 60) primarily with group O donors. These samples had less A antigen with reciprocal minor to moderate increased H antigen when compared with other group A donors by immunoblotting. Only 2 group A samples (41 and 42) revealed strong interactions with SBA, an A1 binding lectin. We also observed decreased H antigen in some group O donor samples (notably 17-20) that were defined by higher BPL binding than UEA-I in the PCA plot. Five group B donors (samples 21, 22, 27, 39, 40) associated with group O samples. Samples 22, 27, and 39 had a corresponding weak increase of H antigen. The most positive samples with anti-B (21-24, 38-40) did not cluster independently and, instead, were dispersed throughout the cohort.
Group AB donors expressed variations in both A and B antigens. Some AB samples had increased expression of a single antigen only or suppressed expression of the other antigen; none of these changes were detected by routine serology. AB samples that clustered or were close with other group B donors had less A antigen (samples 64, 66, 69, 73, and 76) compared with other AB samples. Samples 72, 74, and 75 conversely expressed higher levels of A antigen and appeared to move toward the group A cluster in the PCA plot. Taken together, unsupervised analysis, PCA, of lectin microarray fluorescence created natural clusters by ABO blood group and revealed variations in glycoprotein antigen expression compared with serological typing antibodies. These findings supported the use of supervised prediction models to classify ABO blood groups solely on lectin microarray fluorescence patterns.
Predication models can identify blood groups by lectin array binding
Unbiased approaches (eg, PCA) with lectin microarrays are useful for observing associations, but their application can be limited by complex samples because of natural biological variation with other glycan antigens. Sparse partial least-squares discriminant analysis (sPLS-DA), an applied predictive statistical method, is a flexible regression model that has found numerous applications in medicine and a growing influence in glycomics.46-49 sPLS-DA handles continuous variables (lectin binding) with categorical classifications (ABO blood group) to maximize the differences between the defined categories. We applied sPLS-DA to create a model whereby only the lectins useful in discriminating ABO blood groups were used to improve the data resolution.
ABO blood groups could be predicted by lectin reactivity patterns in 6 dimensions, and to prevent overfitting, only the first 2 dimensions of data were used for analyses (Figure 4A). ABO accuracy was >95% for A, AB, and O when compared with serological results, whereas group B detection was 94% (Figure 4B). The location of an individual point on the prediction map was a factor of 2 loading vectors: x- and y-axis. Movement along the x-axis was complex requiring 21 lectins for discrimination (Figure 4C), but the y-axis (up and down movement of a point) only required EEL simply for group B detection (Figure 4D). Group O was distinguished by 4 fucose-binding lectins (UEA-I, AAL, AOL, and LTL). Group A samples were directed by binding to known group A GalNAc lectins (DBA, GSL-A4, Jacalin, HPA) and a galactose-binding lectin (ACA). Group B was only decided by EEL. Group AB was categorized by binding to group A and group B antigen lectins and decreased avidity to fucose selective lectins.
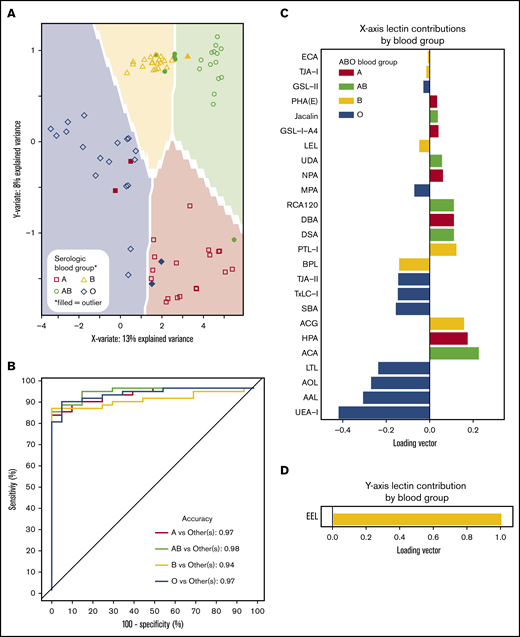
Prediction models can identify blood groups by lectin microarray. (A) Prediction map of blood groups based on lectin arrays. Membrane-extracted RBC glycoproteins from 20 donors of each blood group were plotted on a prediction map where shapes represent individuals and the shaded background the 95% confidence interval. Individuals were displayed by their serologic blood group (unfilled shapes). Individuals that failed to match their serological blood group are indicated as filled shapes. (B) Receiver operating characteristic curves of the membrane-extracted RBC glycoproteins from 20 donors of each blood group. The accuracy for each blood group is shown in the inset. (C) The predictive model used only significant lectins in combination to distinguish between blood groups. (D) The y-axis only required the lectin EEL to classify presence or absence of the group B antigen.
Prediction models can identify blood groups by lectin microarray. (A) Prediction map of blood groups based on lectin arrays. Membrane-extracted RBC glycoproteins from 20 donors of each blood group were plotted on a prediction map where shapes represent individuals and the shaded background the 95% confidence interval. Individuals were displayed by their serologic blood group (unfilled shapes). Individuals that failed to match their serological blood group are indicated as filled shapes. (B) Receiver operating characteristic curves of the membrane-extracted RBC glycoproteins from 20 donors of each blood group. The accuracy for each blood group is shown in the inset. (C) The predictive model used only significant lectins in combination to distinguish between blood groups. (D) The y-axis only required the lectin EEL to classify presence or absence of the group B antigen.
Discussion
Monoclonal and polyclonal antibodies categorize RBCs based on the principal ABH antigen.50 Although ABO typing reagents perform robustly in the clinical setting, this approach accounts for the basic features of blood group epitopes without accounting for antigen expression variability.10 We used a high-throughput lectin microarray to sort RBC membranous glycoproteins from donors of each ABO blood group with unbiased and prediction data models. With an unbiased approach to data visualization, blood group clusters naturally formed even with a complex mixture of glycoproteins competing for lectin interactions. Annotating samples with serological results by sPLS-DA largely harmonized blood group lectin predictions with serology. Some samples did not conform to serological classification with either approach, but were confirmed to have altered expression by immunoblotting.
ABO subgroups are a well-known but an imprecisely defined cohort that go mostly unnoticed in routine blood banking.9 Blood typing reagents were designed to provide strong agglutination, even in the presence of weakened antigen expression, through immunization with different types of blood group configurations from ovarian cyst fluid, human cells, and salivary fluid.5,51,52 Coupled with the subjectivity of grading manual serologic agglutination, nuances in RBC ABH expression can be lost. Changes in ABH antigen expression are thought to arise from glycosyltransferase variants altering enzyme efficiency or substrate specificity.2 However, monoclonal antibodies are developed to agglutinate strongly in the presence of an antigen epitope, whereas lectins bind weakly to glycan classes providing finer specificity. The variability of ABH was also noted on platelets with some individuals expressing high concentrations of A antigen despite appearing serologically and genotypically similar.53-56 Lectin microarray data showed a spectrum of lectin binding revealing distinct ABO subgroups. Both unbiased (PCA) and predictive data modeling (sPLS-DA), highlighted donors with mismatched serological and lectin blood group categorization.
The A, B, and AB blood group cohorts contained a subset of donors with weakened glycoprotein antigen expression and most were confirmed by immunoblotting; as expected, group AB donors were the most complex because of expressing A, B, and H antigens. Decreased A antigen may represent the most common A subgroup, A2. Group A2 individuals have lower A antigen density secondary to slower glycosyltransferase kinetics compared with group A1 and absent glycolipid glycosylation, core types III-IV.2,12 When A antigen expression was decreased, there was a reciprocal increase in the H antigen by immunoblotting, consistent with the possibility of A2 RBCs. Five group O and 2 group A donors bound only BPL and SBA, respectively, compared with their blood group counterparts supporting differential blood group expression. These differences were not detected by routine RBC serological typing reagents.
B subgroups are encountered less often than A subgroups, and the glycan distribution is sparsely characterized. An initial description of group B was described by 3 different agglutination patterns based on the percentage of agglutination using antibodies.2,57 Group B donors had a wide range of variability in expression with a distinct group of reduced B antigen and weakly increased H antigen expression. These individuals bound group O-recognizing lectins, UEA-I and AOL, compared with the single dominant EEL lectin binding to the remaining group B cohort. Using the gain and loss of lectins in combination improved group B sensitivity compared with a single lectin or monoclonal antibody measurements. Thus, unbiased and predictive methods of lectin microarrays not only underscored the complexity of ABH glycoprotein expression on RBCs but provided a proof of concept that could be useful for blood banks in identifying subgroups and understanding the interplay between the immune system and ABH differential expression.
The RBC surface glycocalyx expression appeared more complex secondary to increased branching of the I blood group antigen and N-linked mannose with group AB. The i/I antigen blood group is universally expressed on RBCs and can be capped with sialic acid and fucose to control chain length or interactions with the microenvironment.36,58 With added branching of the I blood group, the number of acceptor sites also rises and can shape immune response. Increased expression of more complex blood groups (eg, branched I antigen) are associated with intracellular adhesion,59,60 cell maturation,61 and affect tumor growth.62 Mannose moieties are the building blocks for all N-linked glycans, and increased terminal and high mannose could offer more acceptor sites for terminal modifications.63 Changes in mannose branching can affect cell function, cell-cell interactions, and immune response.64,65 Our data showed blood groups A and AB had elevated levels of branched I antigen and complex N-linked glycans. Increased mannose expression was quantified in groups A, B, and AB compared with group O.37-39 Our results agreed with these findings and localized the alterations to terminal and high mannose. Group B appeared the most heterogenous blood group to analyze. One-quarter of the B cohort expressed less B antigen, appearing more group O-like, perhaps explaining why group B did not show increased I-antigen or complex N-linked glycans. The low-expressing B subgroups were more group O-like by lectin analysis; this would bias the overall fluorescence values lower.
sPLS-DA performs robustly when the number of variables to be analyzed greatly exceeds the number of samples in the dataset.25 The number of variables (lectins and glycans) printed on microarrays are currently far fewer than DNA and RNA microarray probes in comparison, but the complexity of glycans precludes drawing conclusions from simple associations. sPLS-DA is optimal in overcoming both of these hurdles in analyzing lectin/glycan microarray data. The current sample size of 20 donors per ABO blood group limited the analysis and fully characterizing the ABO subgroups. Increasing the sample size to enrich the dataset for subgroups would enhance the prediction model by creating new categories for each subgroup based on unique lectin binding combinations rather than coalescing all generic blood groups together.
Our fundamental understanding of ABO blood groups drives transfusion and transplantation, but exploring alterations in expression may shift our perspective on crossing the ABO barrier. Although blood banks commonly observe decreased agglutination with ABO typing reagents in hematologic malignancy, investigations into the mechanism and resultant outcomes are unknown.66 It is unclear if there is only a global decrease in antigen expression or additional changes to the distribution of ABH antigens. Mechanistic insights could be applied in transplantation rather than overcoming natural anti-A and anti-B antibodies with medical interventions to limit their production or removal through apheresis to potentially prevent hyperacute or acute antibody-mediated rejection.1,67 Instead, selecting donors with more amenable ABO phenotypes to increase immune tolerance of ABO incompatible transplants would be preferable. Despite elegant previous work, ABH glycoprotein and/or glycolipid contribution to the immune system remain elusive.68-70 Expanding microarrays to identify additional ABO binding lectins beyond previous reports2 and to measure glycolipid fraction contributions of ABH expression could explain immune recognition and response to glycan antigens. For example, identifying individuals with more immunologically permissive ABO blood groups would decrease rejection in ABO-incompatible transplantation. A cell surface glycoprotein and glycolipid roadmap would further resolve subgroup identification and understanding ABH glycans in immunity.
Our data showed that ABH antigens on RBC glycoproteins were distinguishable by lectin array. Our analysis was limited to interrogating glycoproteins, but highlighted the importance of ABH localization on glycoproteins even within the same blood group. We identified changes associated with the expression of A and B antigens with increased levels of terminal and high mannose and branching polylactosamine. Our fundamental understanding of ABO blood groups drives transfusion and transplantation but exploring alterations in expression may shift our perspective on crossing the ABO barrier. Although blood banks commonly observe decreased agglutination with ABO typing reagents in hematologic malignancy, investigations into the mechanism and resultant outcomes are unknown. This work may prove key to understanding alterations of ABH expression and the resultant immune consequences.
For original data, please contact wanani@versiti.org.
Acknowledgments
This work was supported by National Institutes of Health, National Heart, Lung, and Blood Institute grants (R01 HL089224) (K.M.H.) and K12 HL141954 (project leader: K.M.H.; W.Q.A. as K12 scholar) and the Jacquelyn & Arlyn Fredrick Endowment Fund for Clinical Research to W.Q.A. The Core Labs at the Blood Research Institute and the Medical College of Wisconsin Genomic Sciences and Precision Medicine Center provided key resources.
Authorship
Contribution: W.Q.A. designed and performed research, collected, analyzed, and interpreted results, and cowrote the manuscript; R.T.B. performed computational biological analysis; A.S. and H.E.A. collected, analyzed, and interpreted results; G.A.D. interpreted results; K.M.H. designed research, analyzed and interpreted results, and cowrote the manuscript; and all authors read, contributed, and approved the writing of the manuscript.
Conflict-of-interest disclosure: The authors declare no competing financial interests.
Correspondence: Karin M. Hoffmeister, Translational Glycomics Center, Versiti, 8727 W Watertown Plank Rd, Milwaukee, WI 53213; e-mail: karin.hoffmeister@versiti.org.

