

Key Points
RAS/CBL mutations are associated with adverse phenotypic features and survival outcomes in myelofibrosis.
RAS/CBL mutations are independent predictors of a reduced response to JAK inhibitors.

Abstract
The dysregulation of the JAK/STAT pathway drives the pathogenesis of myelofibrosis (MF). Recently, several JAK inhibitors (JAKis) have been developed for treating MF. Select mutations (MTs) have been associated with impaired outcomes and are currently incorporated in molecularly annotated prognostic models. Mutations of RAS/MAPK pathway genes are frequently reported in cancer and at low frequencies in MF. In this study, we investigated the phenotypic, prognostic, and therapeutic implications of NRASMTs, KRASMTs, and CBLMTs (RAS/CBLMTs) in 464 consecutive MF patients. A total of 59 (12.7%) patients had RAS/CBLMTs: NRASMTs, n = 25 (5.4%); KRASMTs, n = 13 (2.8%); and CBLMTs, n = 26 (5.6%). Patients with RAS/CBLMTs were more likely to present with high-risk clinical and molecular features. RAS/CBLMTs were associated with inferior overall survival compared with patients without MTs and retained significance in a multivariate model, including the Mutation-Enhanced International Prognostic Score System (MIPSS70) risk factors and cytogenetics; however, inclusion of RAS/CBLMTs in molecularly annotated prognostic models did not improve the predictive power of the latter. The 5-year cumulative incidence of leukemic transformation was notably higher in the RAS/CBLMT cohort. Among 61 patients treated with JAKis and observed for a median time of 30 months, the rate of symptoms and spleen response at 6 months was significantly lower in the RAS/CBLMT cohort. Logistic regression analysis disclosed a significant inverse correlation between RAS/CBLMTs and the probability of achieving a symptom or spleen response that was retained in multivariate analysis. In summary, our study showed that RAS/CBLMTs are associated with adverse phenotypic features and survival outcomes and, more important, may predict reduced response to JAKis.
Introduction
Myelofibrosis (MF) is a clonal stem cell–derived myeloproliferative neoplasm (MPN) characterized by chronic myeloproliferation with atypical megakaryocytic hyperplasia, abnormal cytokine expression, and an intense bone marrow (BM) stromal reaction leading to BM failure and extramedullary hematopoiesis.1 It can arise de novo (primary MF [PMF]) or secondary to polycythemia vera (post-PV MF) or essential thrombocythemia (post-ET MF). Clinical manifestations include anemia, leukoerythroblastosis, hepatosplenomegaly, debilitating constitutional symptoms, cachexia, thromboembolism, and bleeding. Leukemic transformation (LT) occurs in ∼14% of patients with PMF and represents a major cause of death.2 Somatic phenotypic driver mutations (MTs) in JAK2, MPL, and CALR are found in 60%, 5%, and 20% of cases, respectively, and all lead to dysregulated JAK/STAT signaling, which normally participates in hematopoiesis and cytokine and growth factor production.3,4 Recently, comprehensive mutational studies based on next-generation sequencing (NGS) in patients with MF identified recurrent mutated genes involved in epigenetic regulation, pre–messenger RNA (mRNA) splicing, cell signaling, transcription regulation, and response to DNA damage.5 Some mutated genes, including ASXL1, EZH2, IDH1/2, SRSF2, and U2AF1, are associated with a dismal prognosis for overall survival (OS) and/or leukemia-free survival (LFS).6,7 These high-molecular-risk MTs (HMRMTs) were incorporated in molecularly annotated prognostic models, such as the Mutation-Enhanced International Prognostic Score System, without (MIPSS70) or with (MIPSS70-plus) cytogenetic information.8,9 The discovery of dysregulated JAK/STAT signaling as a central pathogenetic mechanism of MPN facilitated the development of small-molecule inhibitors of JAK2 (JAKis) that have shown efficacy in preclinical and clinical studies. Ruxolitinib and fedratinib are oral JAK1 and JAK2 inhibitors, approved for the treatment of MF.10-13 However, JAKis do not eradicate the MPN clone, suggesting limited disease-modifying potential; furthermore, resistance leading to loss of clinical response has been reported in a substantial proportion of patients.10,11,14,15
The RAS/RAF/MEK/ERK/MAPK (RAS/MAPK) pathway comprises several components, with kinase activity involved in many cellular functions, including cell proliferation, differentiation, and migration; nuclear transport; mRNA processing; and protein translation.16 Gain-of-function MTs in RAS/MAPK pathway members are common in human cancer and in nonmalignant diseases. Accordingly, the RAS/MAPK pathway is considered a potential therapeutic target, and recently, several small-molecule inhibitors have been shown to be clinically valuable, with manageable side effects. Furthermore, some studies have elucidated a functional interplay between the JAK/STAT and RAS/MAPK pathways that contributes to uncontrolled cell growth, leukemogenesis, and eventually drug resistance.17-20
In the current study we investigated the phenotypic, prognostic, and therapeutic implications of MTs in the RAS/MAPK pathway in a large population of patients with MF.
Methods
After approval by the Institutional Review Board of Azienda Ospedaliero-Universitaria Careggi (Florence, Italy), patients with a diagnosis of prefibrotic PMF (pre-PMF), overt PMF, post-PV MF or post-ET MF were included in the current study. The diagnosis was retrospectively confirmed according to the 2016 World Health Organization (WHO) criteria for PMF and the International Working Group-Myeloproliferative Neoplasms Research and Treatment (IWG-MRT) criteria for post-PV and -ET MF.1,21 All patients underwent mutational analysis for driver MTs and targeted NGS for 29 myeloid-relevant genes in DNA from peripheral blood (PB) granulocytes collected at the time of diagnosis or first referral, as described.8 RAS/MAPK pathway genes included in the NGS panel encompassed NRAS, KRAS, and CBL (referred as RAS/CBL hereinafter), because they have been identified as the most commonly mutated genes in hematological malignancies. CBL encodes for a multifunctional adaptor protein with ubiquitin ligase (E3), and MTs are associated with stabilization of receptor tyrosine kinases, resulting in constitutive activation of the RAS/MPAK pathway. PTPN11 and NF1 were not included in the analysis because of the low number of patients with annotated sequencing data in our series, and the very low occurrence of MTs in other series.22 Statistical analyses included clinical and laboratory parameters, obtained at diagnosis or first referral, that in 90% of cases coincided with sample collection for mutation analysis. Continuous variables were presented as the median (range) and categorical variables as the frequency (percentage). Differences in the distribution of continuous variables in the categories were compared by the Mann-Whitney U test. The χ2 test was used for comparison of categorical variables. The response to JAKis was evaluated according to the revised response criteria for MF defined by the IWG-MRT and European LeukemiaNet (ELN).23 Logistic regression analysis was used to identify predictors of response to JAKis at 6 months. In cases of complete or quasicomplete separation, Firth’s logistic regression method was used to cope with the bias of maximum-likelihood estimates. OS analysis was computed from the date of MF diagnosis to date of death (uncensored) or last contact (censored). The Kaplan-Meier method was used to prepare OS curves, which were compared by the log-rank test. The cumulative incidence (CuI) of LT was calculated after competing risk analysis and compared between groups by using Gray’s test. Cox proportional hazards analysis followed by backward stepwise selection was used for univariate and multivariate analyses. P < .05 indicated significant results. Comparison of relative predictive power was performed with the Akaike information criterion and area under the curve of time-dependent receiver operating characteristic curve. The JMP Pro 14.1.0 software from SAS Institute (Cary, NC), R software version 3.6.2, and Prism 8.3.0 (GraphPad, San Diego, CA) were used for calculations.
Results
Characteristics of study population
Four hundred sixty-four patients with WHO-defined MF (diagnosed from 1994 through 2019) were included in the study: 132 (29%) pre-PMF, 155 (33%) overt PMF, and 177 (38%) post-PV/ET MF. Tables 1 and 2 summarize prominent clinical, laboratory, and molecular characteristics of the study population. The median age at diagnosis was 60 (range 18-90) years, and 277 (60%) of the patients were men. With regard to phenotype driver MTs, JAK2MT was detected in 289 (62%) patients, CALRMT in 115 (25%), and MPLMT in 32 (7%), whereas 41 (9%) were triple negative. Among co-occurring MTs, the most frequently mutated genes were ASXL1 (33%), TET2 (20%), EZH2 (9%), SRSF2 (8%), and ZRSR2 (8%) (Figure 1A; supplemental Figure 1A-C). One or more HMRMTs were found in 178 (38%) patients, with 62 (13%) harboring ≥2 HMRMTs. Cytogenetic data were available in 334 (72%) patients: 281 (84%), 31 (9%), and 22 (7%) had favorable, unfavorable, and high-risk karyotype, respectively, according to the revised cytogenetic risk stratification.24
Clinical and laboratory features of 464 patients with WHO-defined MF, stratified by presence or absence of RAS/CBLMT
| Variable | All patients (N = 464) | RAS/CBLWT (n = 405; 87%) | RAS/CBLMT (n = 59; 13%) | P (RAS/CBLWT vs RAS/CBLMT) |
|---|---|---|---|---|
| WHO 2016 diagnosis, n (%) | ||||
| Overt PMF | 155 (33) | 120 (30) | 35 (58) | <.0001 |
| Pre-PMF | 132 (29) | 120 (30) | 12 (20) | |
| Post-PV/ET MF | 177 (38) | 165 (40) | 12 (22) | |
| Male sex, n (%) | 277 (60) | 236 (58) | 41 (69) | .10 |
| Age at diagnosis, median (range), y | 60 (18-90) | 60 (18-90) | 64 (24-88) | .0235 |
| Age at diagnosis >65 y, n (%) | 172 (37) | 145 (36) | 27 (46) | .14 |
| Leukocytes, median (range), ×109/L [412] | 8.9 (0.6-250) | 8.8 (0.6-250) | 11.7 (2.1-90.8) | .08 |
| Leukocytes >25 × 109/L, n (%) | 42 (10) | 30 (8) | 12 (23) | .0010 |
| Hemoglobin, median (range), g/dL [415] | 11.9 (4.2-17.5) | 12 (4.2-17.5) | 10.6 (5.4-17.3) | .0016 |
| Hemoglobin <10 g/dL, n (%) | 99 (24) | 79 (22) | 20 (39) | .0060 |
| RBC transfusion dependence, n (%) [462] | 141 (31) | 111 (28) | 30 (52) | .0002 |
| Platelets, median (range), ×109/L [417] | 354 (10-1800) | 370 (10-1800) | 270 (14-1635) | .0031 |
| Platelets <100 × 109/L, median (range) | 41 (10) | 32 (9) | 9 (18) | .0454 |
| Peripheral CD34+, median (range), % [335] | 0.3 (0-22.2) | 0.3 (0-22.2) | 1.2 (0-16.7) | .0003 |
| PB blasts, median (range), % [426] | 0 (0-18) | 0 (0-18) | 1 (0-16) | <.0001 |
| PB blasts ≥1%, n (%) | 105 (25) | 79 (21) | 26 (48) | <.0001 |
| PB blasts ≥5%, n (%) | 14 (3) | 6 (2) | 8 (15) | <.0001 |
| BM fibrosis grade ≥2, median (range) [438] | 301 (69) | 258 (67) | 43 (80) | .06 |
| Splenomegaly, n (%) [428] | 348 (81) | 299 (80) | 49 (88) | .20 |
| Constitutional symptoms, n (%) [463] | 172 (37) | 141 (35) | 31 (53) | .0088 |
| Extramedullary hematopoiesis, n (%) [449] | 19 (4) | 13 (3) | 6 (10) | .0132 |
| IPSS risk stratification, n (%) [400] | ||||
| Low risk | 118 (29) | 112 (32) | 6 (12) | Reference |
| Intermediate-1 risk | 127 (32) | 117 (34) | 10 (20) | .38 |
| Intermediate-2 risk | 78 (20) | 61 (17) | 17 (33) | .0004 |
| High risk | 77 (19) | 59 (17) | 18 (35) | .0001 |
| DIPSS risk stratification, n (%) [400] | ||||
| Low risk | 118 (29) | 112 (32) | 6 (12) | Reference |
| Intermediate-1 risk | 175 (44) | 156 (45) | 19 (37) | .08 |
| Intermediate-2 risk | 87 (22) | 67 (19) | 20 (39) | .0001 |
| High risk | 20 (5) | 14 (4) | 6 (12) | .0003 |
| MIPSS70 risk stratification, n (%) [382] | ||||
| Low risk | 84 (22) | 82 (24) | 2 (4) | Reference |
| Intermediate risk | 196 (51) | 179 (54) | 17 (36) | .06 |
| High risk | 102 (60) | 73 (22) | 29 (60) | <.0001 |
| Deaths, n (%) [463] | 172 (37) | 126 (31) | 46 (78) | <.0001 |
| Leukemic transformation, n (%) [463] | 57 (12) | 36 (10) | 21 (36) | <.0001 |
Bold P values indicate statistically significant results. The numbers in brackets indicate the number of patients with evaluable data.
BM, bone marrow; RBC, red blood cell.
Mutational and cytogenetic features of 464 patients with WHO-defined MF, stratified by presence or absence of RAS/CBLMT
| Variable | All patients (N = 464) | RAS/CBLWT (n = 405; 89%) | RAS/CBLMT (n = 59; 11%) | P (RAS/CBLWT vs RAS/CBLMT) |
|---|---|---|---|---|
| MPN drivers, n (%) | ||||
| JAK2M | 289 (62) | 258 (64) | 31 (53) | .09 |
| CALRM | 115 (25) | 101 (25) | 14 (24) | .90 |
| MPLM | 32 (7) | 28 (7) | 4 (7) | .99 |
| Triple negative | 41 (9) | 30 (7) | 11 (19) | .0045 |
| Epigenetic regulators of methylation, n (%) | ||||
| DNMT3AM | 25 (5) | 23 (6) | 2 (3) | .47 |
| IDH1/2M | 15 (3) | 11 (3) | 4 (7) | .10 |
| TET2M | 91 (20) | 79 (20) | 12 (20) | .88 |
| Chromatin regulating genes, n (%) | ||||
| ASXL1M | 153 (33) | 111 (27) | 42 (71) | <.0001 |
| EZH2M [463] | 41 (9) | 29 (7) | 12 (20) | .0009 |
| Pre-mRNA splicing mutations, n (%) | ||||
| SF3B1M [461] | 30 (7) | 24 (6) | 6 (11) | .17 |
| SRSF2M | 35 (8) | 23 (6) | 12 (20) | <.0001 |
| U2AF1M [461] | 25 (5) | 20 (5) | 5 (9) | .22 |
| ZRSR2M [318] | 26 (8) | 21 (7) | 5 (14) | .21 |
| Transcription factors and nucleosome assembly, n (%) | ||||
| NF-E2M [445] | 24 (5) | 24 (6) | 0 (0) | .07 |
| RUNX1M [461] | 15 (3) | 12 (3) | 3 (5) | .34 |
| SETBP1M [318] | 7 (2) | 4 (1) | 3 (8) | .0092 |
| Cell signaling, n (%) | ||||
| CSF3RM [318] | 8 (3) | 8 (3) | 0 (0) | .30 |
| KITM [460] | 4 (1) | 3 (1) | 1 (2) | .43 |
| SH2B3/LNKM [458] | 19 (4) | 15 (4) | 4 (7) | .23 |
| DNA damage response, n (%) | ||||
| TP53M, n (%) [462] | 22 (5) | 20 (5) | 2 (4) | .64 |
| HMRMT, n (%)* | ||||
| HMRMT [463] | 178 (38) | 134 (33) | 44 (75) | <.0001 |
| ≥2 HMRMTs [463]† | 62 (13) | 37 (9) | 25 (42) | <.0001 |
| Cytogenetics, n (%)‡ | ||||
| Abnormal karyotype [334] | 112 (34) | 96 (33) | 16 (36) | .67 |
| Favorable karyotype | 281 (84) | 248 (85) | 33 (75) | Reference |
| Unfavorable karyotype | 31 (9) | 25 (9) | 6 (14) | .22 |
| Very high-risk karyotype | 22 (7) | 17 (6) | 5 (11) | .13 |
Bold P values indicate statistically significant results. Numbers in brackets are the number of patients with evaluable data.
The HMR category is defined as the presence of a mutation in any of the following genes: ASXL1, EZH2, SRSF2, and IDH1/2.
≥2 HMRMTs indicates the presence of 2 or more mutations in the ASXL1, EZH2, SRSF2, and IDH1/2 genes (2 or more mutations in the same gene are counted as 1).
According to the revised cytogenetic risk stratification.24
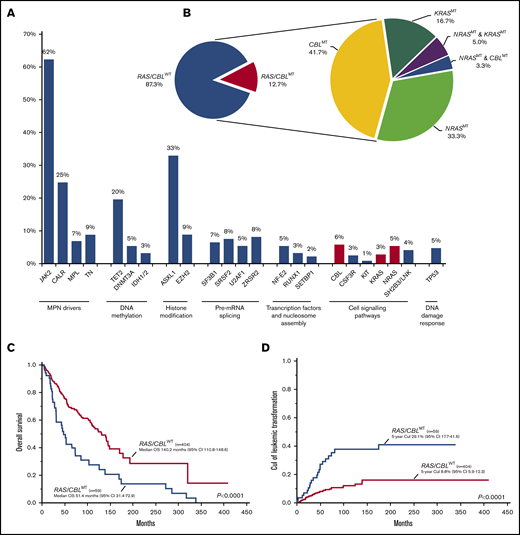
Distribution, molecular landscape and survival correlates of RAS/CBLMTs. (A) The frequency of gene mutations identified in the MF cohort; red-violet bars identify mutations of the RAS/MAPK pathway genes (ie, NRAS, KRAS, and CBL). (B) Aerogram displaying the percentage of patients with MF, with and without RAS/CBLMTs (left), and the distribution of patients with NRASMTs, KRASMTs, and CBLMTs and multiple RAS/CBLMTs (right). (C) Kaplan-Meier estimates of OS in the entire MF cohort by the presence or absence of RAS/CBLMTs. (D) Five-year CuI of leukemic transformation in the entire MF cohort by the presence or absence of RAS/CBLMTs.
Distribution, molecular landscape and survival correlates of RAS/CBLMTs. (A) The frequency of gene mutations identified in the MF cohort; red-violet bars identify mutations of the RAS/MAPK pathway genes (ie, NRAS, KRAS, and CBL). (B) Aerogram displaying the percentage of patients with MF, with and without RAS/CBLMTs (left), and the distribution of patients with NRASMTs, KRASMTs, and CBLMTs and multiple RAS/CBLMTs (right). (C) Kaplan-Meier estimates of OS in the entire MF cohort by the presence or absence of RAS/CBLMTs. (D) Five-year CuI of leukemic transformation in the entire MF cohort by the presence or absence of RAS/CBLMTs.
Frequency, distribution, and phenotypic correlates of RAS/CBLMTs
A total of 59 patients (12.7%) had MTs in RAS/MAPK pathway genes: NRASMT was identified in 25 (5.4%), KRASMT in 13 (2.8%), and CBLMT in 26 (5.6%) (Figure 1B; supplemental Figure 1A-C). A total of 27 NRASMTs were identified, with 2 patients harboring 2 different MTs (supplemental Figure 2A). All were missense variants, with the mutational hotspot at residue G12 affected in 18 (67%) cases, whereas the mutational hotspots G13 and Q61 were affected in 2 (7%) patients each. Of the 13 KRASMTs found in the cohort, all but 1 (a splice site variant) were missense, 4 (31%) were localized at the mutational hotspot at residue G12, and 5 (38%) affected the highly conserved residue A146 (supplemental Figure 2B). CBLMTs were more heterogeneous, including missense (n = 24), nonsense (n = 1), and frameshift (n = 1) variants, and were enriched in exons 8 and 9 coding the linker region and RING finger domain (supplemental Figure 2C). No specific mutational hotspots were identified, although there were multiple amino acid residues affected by ≥3 MTs, such as C381 (n = 3), C384 (n = 5), and R420 (n = 4). Three patients had both NRASMT and KRASMT, 2 patients had MTs in both NRAS and CBL. The median variant allelic fraction (VAF) of all RAS/CBLMTs (evaluable n = 60) was 30% (range, 2%-93%), which was significantly lower than the VAF of driver MTs; namely, JAK2V617F (46%; P < .0001), CALRMT (52%; P < .0001), and MPLMT (54%; P < .0001; supplemental Figure 3A). The median VAF of NRASMTs, KRASMTs, and CBLMTs was 24% (range, 3%-51%), 24% (range, 2%-52%), and 36% (range 5%-93%), with a trend of the CBLMT VAF that was higher than the NRASMT and KRASMT VAFs (supplemental Figure 3B).
Main clinical, laboratory, and molecular characteristics of the study population stratified by the presence or absence of RAS/CBLMTs are listed in Tables 1 and 2. In comparison with their wild-type (WT) counterparts, patients with RAS/CBLMTs were more likely to be diagnosed with overt PMF than pre-PMF (P = .0021) or post-PV/ET MF (P < .0001); to be older at MF diagnosis (P = .0235); to have white blood cell counts >25 × 109/L (P = .0010), lower hemoglobin levels (HB; P = .0016), lower platelet counts (P = .0031), higher PB CD34+ (P = .0003), and higher PB blasts (P < .0001); to have constitutional symptoms (P = .0088) and red blood cell transfusion dependence (RBC-TD) more frequently (P = .0002); and to develop extramedullary hematopoiesis (EMH) more frequently (P = .0132). With regard to driver MTs, patients with RAS/CBLMTs were more frequently triple negative (19% vs 7%; P = .0045) compared to patients with RAS/CBLWT.JAK2MT tended to be enriched in the RAS/CBLWT cohort (64% vs 52%; P = .09). Among nondriver MTs, ASXL1MTs (71% vs 27%; P < .0001), EZH2MTs (20% vs 7%; P = .0009), SETBP1MTs (8% vs 1%; P = .0092), and SRSF2MTs (20% vs 6%; P < .0001) significantly clustered with RAS/CBLMTs. Overall, patients with RAS/CBLMTs had HMRMTs (75% vs 33%; P < .0001) and >1 HMRMT (42% vs 9%; P < .0001) more frequently. There was no difference in the distributions of karyotype abnormalities and cytogenetic risk stratification. Considering clinical and molecular prognostic models, the RAS/CBLMT cohort was enriched in patients with higher risk disease per the International Prognostic Score System (IPSS), the Dynamic IPSS (DIPSS), and the MIPSS70.
Survival correlates of RAS/CBLMTs
The median follow-up of the entire cohort was 82 (95% confidence interval [CI], 70-89) months, and 172 (37%) deaths were documented at last follow-up. Median OS was 123 (95% CI, 103-141) months. In univariate analysis, MF patients with RAS/CBLMTs had inferior OS compared with that of their WT counterparts (P < .0001; hazard ratio [HR], 2.30; 95% CI, 1.63-3.24), with medians of 51 (95% CI, 31-73) and 140 (95% CI, 111-149) months, respectively (Figure 1C). In a multivariate Cox proportional hazards model that included RAS/CBLMTs and all risk factors in the MIPSS70, along with karyotype stratification, the former retained its significance (HR, 1.73; 95% CI, 1.10-2.71; P = .0177; Table 3). Considering overt PMF, pre-PMF, and post-PV/ET MF separately, the respective median OSs were 103 (95% CI, 66-131), 193 (95% CI, 124 to not reached [NR]), and 114 (95% CI, 87-145) months. The presence of RAS/CBLMTs was associated with inferior OS in overt PMF (median OS, 55 vs 110 months; P = .0106; HR, 2.0; 95% CI, 1.2-3.2) and pre-PMF (median OS, 31 vs 193 months; P < .0001; HR, 6.0; 95% CI, 2.7-13.4) cohorts, but not in post-PV/ET MF (supplemental Figure 4A-C). Upon multivariate Cox proportional hazards analysis, the negative survival impact of RAS/CBLMTs was retained in overt PMF only (HR, 2.91; 95% CI, 1.54-5.50; P = .0010; Table 3).
Results of multivariate Cox proportional hazards model of OS
| Covariate | Primary and secondary MF | Overt PMF | Pre-PMF | Post-PV/ET MF | ||||
|---|---|---|---|---|---|---|---|---|
| HR (95% CI) | P | HR (95% CI) | P | HR (95% CI) | P | HR (95% CI) | P | |
| Constitutional symptoms | NS | NS | NS | NS | ||||
| Leukocytes >25 × 109/L | 4.81 (2.79-8.26) | <.0001 | 4.58 (1.90-11.01) | .0007 | 18.28 (4.69-71.21) | <.0001 | ||
| Hemoglobin <10 g/dL | 2.27 (1.48-3.48) | .0002 | NS | 2.61 (1.01-6.81) | .0487 | 2.75 (1.54-4.91) | .0006 | |
| Blood blasts ≥2% | 1.80 (1.10-2.96) | .0204 | 2.52 (1.17-5.46) | .0186 | NS | 2.90 (1.56-5.42) | .0008 | |
| Platelet count <100 × 109/L | 4.79 (2.72-8.44) | <.0001 | 4.80 (2.09-11.00) | .0002 | 7.98 (2.33-27.36) | .0010 | 8.25 (3.45-19.74) | <.0001 |
| BM fibrosis grade ≥2 | NS | — | — | — | ||||
| Absence of CALR1-like | NS | NS | NS | NS | ||||
| HMRMT* | 1.86 (1.24-2.80) | .0029 | NS | 11.16 (3.53-35.28) | <.0001 | NS | ||
| ≥2 HMRMTs† | NS | NS | NS | NS | ||||
| RAS/CBLMT | 1.73 (1.10-2.71) | .0177 | 2.91 (1.54-5.50) | .0010 | NS | NS | ||
| Cytogenetics‡ | ||||||||
| Favorable | Reference | Reference | Reference | Reference | ||||
| Unfavorable | NS | 2.39 (1.08-5.28) | .0314 | NS | NS | |||
| Very high risk | 4.25 (2.27-7.98) | <.0001 | 10.82 (3.57-32.76) | <.0001 | 20.33 (4.58-90.31) | <.0001 | NS | |
NS, not significant.
The HMR category is defined as the presence of a mutation in any of the following genes: ASXL1, EZH2, SRSF2, and IDH1/2.
≥2 HMRMTs indicate the presence of 2 or more mutations in the ASXL1, EZH2, SRSF2, and IDH1/2 genes (2 or more mutations in the same gene are counted as 1).
According to the revised cytogenetic risk stratification.24
At last follow-up, 57 (12%) patients had transformed to acute leukemia. Overall, LT was significantly more frequent in the RAS/CBLMT cohort (36% vs 9%; P < .0001) compared with the unmutated counterpart, and this finding was confirmed in all 3 MF subtypes (overt PMF, 34% vs 10%, P = .0005; pre-PMF, 42% vs 5%, P < .0001; post-PV/ET MF, 33% vs 11%, P = .0238). After competing risk analysis, the 5-year CuI of LT for the entire MF cohort was 12% (95% CI, 9-16) and was significantly higher in patients with RAS/CBLMTs than in those with RAS/CBLWT (P < .0001), with respective values of 29% (95% CI, 18-42) and 9% (95% CI, 6-12; Figure 1D). By disease subtype, the 5-year CuI of LT was still significantly higher in patients with RAS/CBLMTs vs those with RAS/CBLWT who had overt PMF (24% [95% CI, 11-40] vs 8% [95% CI, 4-15], respectively; P = .0066) and pre-PMF (45% [95% CI, 14-73] vs 8% [95% CI, 4-16], respectively; P = .0003; supplemental Figure 5A-C).
To evaluate the prognostic contribution of RAS/CBLMTs to risk stratification of MF patients, we recomputed MIPSS70 and MIPSS70-plus scores after embedding RAS/CBLMTs as HMRMTs, along with ASXL1MTs, EZH2MTs, IDH1/2MTs, and SRSF2MTs. This attempt produced only minimal redistribution of MF patients across the 3/4 risk classes (supplemental Figure 6A-B), most likely because RAS/CBLMTs are frequently associated with clinical and molecular features that per sedefine a higher risk disease. We further compared the statistical power of the standard and RAS/CBL-enhanced MIPSS70 and MIPSS70-plus in predicting OS and LFS, using the Akaike information criterion and the 3-year receiver operating characteristic area under the curve. We found no significant difference between the standard and modified MIPSS70/MIPSS70-plus (supplemental Figure 6C), suggesting that RAS/CBLMTs do not add prognostically meaningful information to current molecularly annotated models.
RAS/CBLMTs and response to JAKi treatment
In total, 121 of 464 patients (26%) received treatment with a JAKi at any time during the disease course, 61 of whom (50%) were treated in the context of a clinical trial, with treatment response that was fully evaluable across the entire treatment period according to the revised IWG-MRT/ELN23 response criteria. Fifty-seven patients were treated with ruxolitinib, 1 each with pacritinib and momelotinib, and 2 with different JAKis administered sequentially (pacritinib-ruxolitinib and ruxolitinib-momelotinib). Most patients had serial NGS analysis, performed at baseline and different time points, including at time of loss of response. At baseline, RAS/CBLMTs were present in 9 (15%) patients, whereas 5 (8%) acquired RAS/CBLMTs during JAKi treatment. The median daily dose intensity of ruxolitinib was 30 mg for RAS/CBLWT and 25.4 mg for RAS/CBLMT patients (P = .82).
After a median treatment time of 30 (range, 3-120) months, an anemia response was achieved by 4 (8%) patients at any time of treatment, and all were RAS/CBLWT. Fifty-five (90%) patients achieved a symptom response after a median time of 1 (0-26) month from JAKi start. The rate of symptom response was significantly lower in patients with RAS/CBLMTs than in their counterparts without MTs (67% vs 94%; P = .0104). At month 6 of treatment, a symptom response was obtained by 47 (77%) patients, including 4 (9%) with RAS/CBLMT and 43 (91%) without (P = .0118). In univariate regression logistic analysis, RAS/CBLMTs at baseline correlated significantly with a lower probability of achieving symptom response at 6 months (odds ratio [OR], 0.17; 95% CI, 0.04-0.75; P = .0194). The same held true for absence of the JAK2MT (P = .0054) and presence of CALRMT (P = .0352; Figure 2A, top). In multivariate analysis, only RAS/CBLMTs (OR, 0.17; 95% CI, 0.03-0.86; P = .0323) and absence of JAK2MT (OR, 6.85; 95% CI, 1.63-28.85; P = .0087) remained independent predictors of an inferior symptom response at 6 months (Figure 2A, bottom).
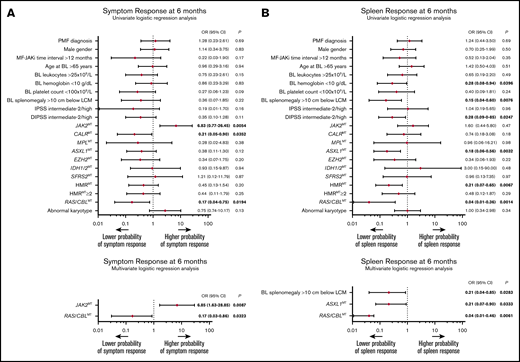
Baseline factors associated with symptom and spleen response to JAKis. (A) The results of univariate (top) and multivariate (bottom) logistic regression analyses of baseline factors predictive of symptom response at 6 months according to the revised IWG-MRT/ELN23 in 61 patients with MF treated with JAKis. (B) The results of univariate (top) and multivariate (bottom) logistic regression analyses of baseline factors predictive of spleen response at 6 months according to the revised IWG-MRT/ELN3 in 61 patients with MF treated with JAKis. Firth’s logistic regression method was used to cope with the bias of maximum likelihood estimates. BL, baseline; LCM, left costal margin; MF-RUXO time interval, time interval between myelofibrosis diagnosis and initiation of JAKis.
Baseline factors associated with symptom and spleen response to JAKis. (A) The results of univariate (top) and multivariate (bottom) logistic regression analyses of baseline factors predictive of symptom response at 6 months according to the revised IWG-MRT/ELN23 in 61 patients with MF treated with JAKis. (B) The results of univariate (top) and multivariate (bottom) logistic regression analyses of baseline factors predictive of spleen response at 6 months according to the revised IWG-MRT/ELN3 in 61 patients with MF treated with JAKis. Firth’s logistic regression method was used to cope with the bias of maximum likelihood estimates. BL, baseline; LCM, left costal margin; MF-RUXO time interval, time interval between myelofibrosis diagnosis and initiation of JAKis.
A total of 34 (59%) patients with splenomegaly achieved a ≥50% reduction from baseline in palpable splenic length at any time during the treatment period. At month 6 of treatment, a spleen response was observed in 29 (51%) patients. Notably, no patients with baseline RAS/CBLMTs achieved a significant reduction in splenic volume at any time during the treatment course, whereas the rate of spleen response among patients with RAS/CBLWT was 59% at month 6 (P = .0019) and 68% at any time (P = .0003). Univariate logistic regression analysis disclosed a significant inverse correlation between RAS/CBLMTs and the probability of achieving a spleen response at 6 months (by Firth’s method: OR, 0.04; 95% CI, 0.01-0.36; P = .0014), with other factors, including baseline HB <10 g/dL (P = .0396), splenomegaly >10 cm from the left costal margin (P = .0076), DIPSS intermediate-2/high (P = .0247), ASXL1MTs (P = .0032), and presence of HMRMTs (P = .0067) (Figure 2B; top). Upon multivariate Firth’s logistic regression analysis, RAS/CBLMTs (OR, 0.04; 95% CI, 0.01-0.46; P = .0061), baseline splenomegaly >10 cm from the left costal margin (OR, 0.21; 95% CI, 0.04-0.85; P = .0283), and ASXL1MTs (OR, 0.21; 95% CI, 0.07-0.90; P = .0333) remained significantly associated with a lower probability of spleen response at 6 months (Figure 2B; bottom). Two patients who obtained a spleen response developed KRASMT during the treatment course, and in both, the response was lost shortly before or after detection of the MT. Time to response, rate of loss, and duration of spleen response were not significantly different among patients with RAS/CBLMTs or those with RAS/CBLWT. Overall, primary resistance (defined as the lack of either anemia, symptoms, or spleen response) was much more frequent in patients with RAS/CBLMTs, either at baseline or during JAKi treatment (29% vs 2%; P = .0015).
Among JAKi-treated patients, the presence of RAS/CBLMTs, either at JAKi start or during treatment, was associated with a significantly inferior OS (computed from the date of JAKi start), with respective median values of 30.4 (95% CI, 11.1-71.3) and 91.4 (95% CI, 64.8-NR) months (Figure 3) for RAS/CBLMT and RAS/CBLWT patients (P = .0001; HR, 4.57; 95% CI, 1.98-10.55). Notably, these results were confirmed after adjustment for the IPSS and DIPSS scores at baseline. Transformation to acute leukemia occurred in 6 (10%) patients after a median of 51 (range, 5-120) months from JAKi start, and 4 (67%) were RAS/CBLMT (P = .0073): 3 had RAS/CBLMTs at baseline, and 1 acquired an NRASMT during JAKi treatment.
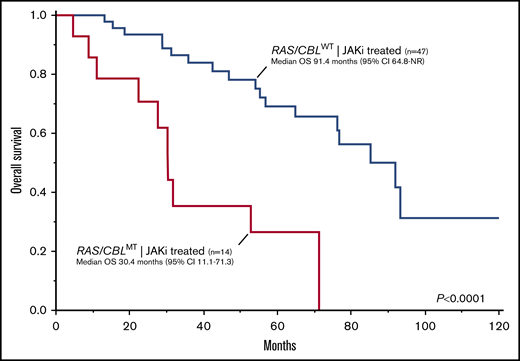
Kaplan-Meier estimates of OS in 61 patients with MF treated with JAKis by the presence or absence of RAS/CBLMTs.
Kaplan-Meier estimates of OS in 61 patients with MF treated with JAKis by the presence or absence of RAS/CBLMTs.
Discussion
In the current study, we provided a comprehensive analysis of phenotypic, prognostic, and therapeutic correlates of RAS/CBLMTs in a large cohort of molecularly annotated patients with MF. Overall, pathogenic MTs in the RAS/MAPK pathway were identified in 12.7% of cases, with NRASMTs, KRASMTs, and CBLMTs accounting for 5.4%, 2.8%, and 5.6%, respectively. Our findings are consistent with those in previous studies5,25 and revealed RAS/MAPK to be a frequently involved pathway in MF pathobiology. Most MTs were missense and localized at previously known hotspots in the 3 genes. Notably, we found no KRASG12C mutations, which is a variant that is specifically targeted by 2 inhibitors currently in development (AMG 510 and MRTX849).26,27 NRASMTs were more common in overt PMF, whereas KRASMTs and CBLMTs were similarly distributed among the 3 MF subtypes. Although there were no significant differences in NRASMTs, KRASMTs and CBLMTs, the median VAFs of RAS/CBLMTs was significantly lower than those of the driver MTs, confirming that they represent subclonal events that are acquired during the disease course.25
RAS/CBLMTs were associated with distinct clinical and laboratory features that usually define high-risk disease, including higher white blood cell counts, lower HB and platelet counts, higher PB CD34+ and blast counts, and higher frequency of RBC-TD and constitutional symptoms. Accordingly, most patients with MF who had the RAS/CBLMTs were considered to be higher risk according to current prognostic models.
On univariate analysis, the OS of patients with RAS/CBLMTs was significantly inferior in the entire MF cohort and, by disease subtype, in overt PMF and pre-PMF. These findings may be explained by the association of RAS/CBLMTs with high-risk features and HMRMTs. However, in a multivariate model including individual MIPSS70 risk factors and karyotype, RAS/CBLMTs retained an independent negative prognostic impact in overt PMF. Recently, Santos et al evaluated 723 patients with MF, and found that the RAS/CBLMTs are an independent predictor of inferior OS and LFS.25 Our findings suggest that the shortened survival conferred by RAS/CBLMTs may be limited to overt PMF. Reasons for such a difference remain at present unknown and may be related in part to the low frequency of RAS/CBLMTs in pre-PMF, which prevented it from retaining significance in multivariate analysis.
The survival disadvantage associated with RAS/CBLMTs is likely related to the higher rate of LT, suggesting that MTs are molecular drivers of disease progression.28 In our study, MF patients with RAS/CBLMTs transformed to blast-phase disease more frequently and had a significantly higher CuI of LT compared with WT patients. By disease subtype, the increased risk of blast transformation was confirmed in both overt and pre-PMF, unlike in post-PV/ET MF, remarking the differences portending the pathobiology of primary and secondary MF. Santos et al incorporated RAS/CBLMTs in a novel MF-specific prognostic model that predicted OS across both a training and a validation cohort.25 When we integrated MIPSS0 and MIPSS70-plus models with RAS/CBLMTs as HMRMTs, we did not observe any risk redistribution across the models or improvement of statistical power, suggesting that RAS/CBLMTs do not add relevant information to current molecularly annotated prognostication systems.
Myelofibrosis treatment has been revolutionized by the use of inhibitors of JAK signaling, including ruxolitinib and fedratinib.10-13 In the current study, 121 patients had received JAKis; however, we focused our analysis on the 61 who were treated in the context of a clinical trial, because response was accurately defined according to standardized criteria, and these patients, unlike the remaining ones, had serial molecular analyses, including one at the time that a loss of response was judged to have occurred. Overall, response rates were comparable with those in previous studies.29-32 However, the presence of RAS/CBLMTs was associated with a lower probability of obtaining symptoms and spleen responses at 6 months. Notably, multivariate analysis confirmed RAS/CBLMTs as an independent predictor of a lesser response, along with the absence of JAK2MT for symptom response, palpable splenomegaly >10 cm, and ASXL1MTs for spleen response. Although patients with RAS/CBLMTs showed lower HB and platelet counts, the JAKi dose intensity was not different among patients with and without RAS/CBLMT, ruling out an effect of drug dose on the lower rate of response.
A few studies have assessed the impact of the molecular landscape on treatment outcomes in patients with MF treated with JAKis, but have produced inconsistent findings. In a retrospective analysis of the CONFORT-II trial, we found that spleen responses and anemia did not correlate with either driver or HMRMTs.33 Another study suggested that the JAK2V617F VAF may predict spleen response.34 Patel and colleagues35 found that 1 or more HMRMTs and the presence of ≥3 MTs were associated with decreased spleen response and a shorter time to discontinuation of therapy among 95 ruxolitinib-treated patients. They also observed a trend for worse OS in patients with G12 N/KRASMT. Notably, the NGS panel did not include either SRSF or CBL. Spiegel et al found that ASXL1MTs, EZH2MTs, CBLMTs, and HMRMTs correlated with a shorter time to treatment failure, although no individual MT was associated with spleen or anemia response.36 Recently, we reported that loss of spleen response was associated with HMRMTs and clonal progression, whereas the absence of ASXL1MTs and JAK2V617F VAF reduction >20% at any time during treatment correlated with long-term spleen response37 ; notably, clonal progression was associated with shorter OS, as reported.38 To the best of our knowledge, our study is the first to investigate systematically the impact of RAS/CBLMTs in JAKi-treated MF patients with accurate response assessment. Although further validation is needed, we believe that our findings shed light on new molecular mechanisms underlying reduced response to JAKis.
A correlation of reduction in splenic volume and length with longer survival in patients treated with ruxolitinib has been reported.32,39,40 Accordingly, the inferior OS in JAKi-treated patients harboring RAS/CBLMTs provides further support to spleen response as a feasible predictor of superior survival in the context of therapy with a JAKi. Furthermore, our findings suggest that treatment with a JAKi does not overcome the negative prognostic impact of RAS/CBLMTs, in disagreement with Santos et al,25 who found nonsignificant improvement of OS in patients with RAS/CBLMTs who were treated with ruxolitinib. Several inhibitors of the RAS/MAPK pathway are currently being investigated in hematologic malignancies. Combined inhibition of JAK2 and MEK (the intermediate kinases in the MEK/ERK pathway) by ruxolitinib and selumetinib abrogated myeloproliferative features and provided long-term survival in a NRASG12D/G12D mouse model.19 Gain-of-function MTs in the RAS/MAPK pathway co-occurring with JAK2V617F confers resistance to JAK inhibition by maintaining sustained BAD phosphorylation, resulting in specific dependence on BCL-xL for survival.41 Furthermore, PDGF-BB/ PDGFRα signaling has been implicated in JAK2-independent MEK/ERK activation in MPN, eventually contributing to bypassing of JAK2 inhibition.20 Combined inhibition of JAK2 and MEK by ruxolitinib and binimetinib suppressed MEK/ERK activation in both JAKV617F and MPLW515L mutant mouse models, with increased efficacy and improved fibrosis to a greater extent, compared with JAKi monotherapy.20 Our findings are consistent with a compensatory role of MEK/ERK pathway activation in JAKi-resistance, offering a rationale for assessing combined targeting of JAK2/STAT and RAS/MAPK pathways in MPNs.
We acknowledge potential limitations in the interpretation of current findings. First, the retrospective nature of the analysis may harbor intrinsic selection biases. Second, the clustering of genes according to known, biologically relevant pathways, although it overcomes the limitations of single-gene-level analysis, cannot fully account for the complex network of relationships of pathway components and with other signaling and/or regulatory pathways. However, the particular role of the RAS/MAPK pathway in JAK2-driven malignancies is well established.42-44 Finally, as concerns the analysis of the effect of RAS/CBLMTs on treatment with JAKis, although we acknowledge the lack of a validation cohort, we trust in the accuracy of our information given that all patients were prospectively followed up in the setting of controlled clinical trials.
Overall, our study revealed that RAS/CBLMTs are major molecular drivers in a considerable proportion of patients with MF and that they cluster with adverse phenotypic features, predict inferior OS, and are associated with a high incidence of LT. The presence of RAS/CBLMTs may also predict reduced symptom and spleen responses to JAKis and, by mediating drug resistance, contribute to undermining the survival advantage attributable to ruxolitinib; these findings remain to be prospectively validated. Finally, we suggest that dual targeting of the JAK/STAT and RAS/MAPK pathways represents an attractive opportunity for improving therapeutic efficacy in MPNs.
Original data are available by e-mail request to the corresponding author, Alessandro M. Vannucchi (amvannucchi@unifi.it).
Acknowledgments
This work was supported by research funding from Associazione Italiana per la Ricerca sul Cancro (AIRC) 5×1000 called “Metastatic disease: the key unmet need in oncology” to MYNERVA (MYeloid NEoplasms Research Venture AIRC; project 21267), and by the Accelerator Award Project funded through a partnership between Cancer Research UK, Fondazione AIRC, Fundacion Cientifica de la Asociacion Espanola Contra el Cancer, and Istituto Toscano Tumori, Regione Toscana (project 2013-B16D14001130002).
Authorship
Contributions: G.C., P.G., M.M.P., A.T., and A.M.V. designed the research, interpreted the results, and wrote and edited the final manuscript; L.M., E.R., E.S., and E.G. contributed patients; G.R., C.M., and S.F. performed the molecular research and interpreted the results; G.C., N.B., and S.R. performed the statistical analysis; and all authors read and approved the final draft of the manuscript.
Conflict-of-interest disclosure: A.M.V. is on the advisory board of Novartis, Celgene, AbbVie, Incyte, Italfarmaco, and CTI; and is a speaker for Novartis, Celgene, and CTI. P.G. is on the advisory board and is a speaker for Novartis. M.M.P. has served on the advisory board of StemLine Pharmaceuticals. The remaining authors declare no competing financial interests.
Correspondence: Alessandro M. Vannucchi, CRIMM, Dipartimento di Medicina Sperimentale e Clinica, AOU Careggi, 50134 Firenze, Italy; e-mail: amvannucchi@unifi.it.

