

Key Points
MLL-ENL affects glycolysis, preparing cells for high anabolic needs.
Restricting the endogenous or exogenous Ser/Gly supply retards leukemic cell proliferation in vitro and in vivo.

Abstract
Mixed-lineage leukemia (MLL) fusions are transcriptional activators that induce leukemia, with a dismal prognosis that mandates further elucidation of their transformation mechanism. In this study, knockdown of the direct MLL-ENL target gene polypyrimidine tract binding protein-1 (PTBP1) was rate limiting for cell proliferation and caused a metabolic phenotype associated with reduced glucose consumption and lactate production. This effect was accompanied by a reduction of splice isoform-2 of pyruvate kinase M (PKM2). Because PKM2 restricts glycolytic outflow to provide anabolic intermediates, we tested the consequences of glucose, energy, and Ser/Gly starvation for cell physiology. Administration of deoxyglucose, energetic decoupling with rotenone, and inhibition of Ser biosynthesis by CBR5884 had a significantly stronger influence on self-renewal and survival of transformed cells than on normal controls. In particular, inhibition of Ser synthesis, which branches off glycolysis caused accumulation of reactive oxygen species, DNA damage, and apoptosis, predominantly in leukemic cells. Depletion of exogenous Ser/Gly affected proliferation and self-renewal of murine and human leukemia samples, even though they are classified as nonessential amino acids. Response to Ser/Gly starvation correlated with glucose transport, but did not involve activation of the AMPK energy homeostasis system. Finally, survival times in transplantation experiments were significantly extended by feeding recipients a Ser/Gly-free diet. These results suggest selective starvation as an option for supportive leukemia treatment.
Introduction
Translocation-derived mixed-lineage leukemia (MLL) fusion proteins occur in up to 10% of all acute leukemias. The presence of rearranged MLL mostly confers a dismal prognosis. Functionally, chimeric MLL proteins subvert universal processes of transcriptional control by altering transcription-associated epigenetic modifications and/or the elongation activity of RNA polymerase itself.1-3 Several potential treatments have been proposed, based either on perturbation of chromatin writers and readers (eg, DOT1L,4 ENL,5 and BRD46 ) or on modulating elongation (eg, by inhibiting CDK9).7 Blocking the interaction of MLL with menin, a protein that aids in genomic localization of wild-type and fused MLL, was tested as an alternative approach.8 Instead of targeting MLL fusion–associated functions directly, an alternate strategy is to probe the known transcriptional targets of MLL fusions for essential activities that may be more amenable for therapeutic intervention. This is particularly worthwhile in the case of MLL rearranged (MLL-r) leukemia, because it has been shown that the transforming potential of MLL chimeras is sufficiently strong to induce leukemic transformation, either by itself or in concert with an unusually small number of cooperating mutations.9,10 Thus, unlike disease induced by other hematopoietic oncogenes, MLL-r disease is largely the consequence of a deregulation of the MLL fusion targets themselves, and it is not confounded by the unknown cooperative effects of several transforming inputs. Genes deregulated by MLL fusions have been identified in several studies.11-13
One likely hallmark of all cancer cells is a shift toward anabolic metabolism to provide building blocks for sustained cell proliferation. Many oncogenes rewire cells to favor glycolysis over oxidative phosphorylation, to channel carbon into biosynthesis rather than oxidizing it into carbon dioxide during oxidative phosphorylation, a phenomenon known as the Warburg effect. Thus, MLL fusions should also control genes with regulatory potential for metabolism, and if these genes are critical for transformation, it may hint of an alternative intervention strategy that targets the metabolic needs of these cells.
We found that MLL-ENL activates the splicing factor polypyrimidine tract binding protein-1 (PTBP1) to induce the anabolic state characteristic of transformed cells, and we showed that MLL-ENL–induced leukemia depends on an external supply of Ser/Gly, resulting in a potentially exploitable metabolic vulnerability.
Methods
Cells, media, nucleic acids, and reagents
Primary murine hematopoietic progenitor cells (HSPCs) transformed by MLL-ENL were generated from BALB/c mice by retroviral transduction, as described before.14 The human MLL-AF9 cell line MOLM13 was obtained from DSMZ (ACC554; Deutsche Sammlung für Mikroorganismen und Zellkulturen, Braunschweig, Germany). Murine cells were cultivated in RPMI supplemented with 10% fetal calf serum (FCS), penicillin/streptomycin (Thermo Fisher Scientific, Dreieich, Germany), and recombinant murine cytokines (5 ng/mL IL3, IL6, and GM-CSF and 50 ng/mL SCF; Miltenyi, Berg-Gladbach, Germany). MOLM13 was cultivated in cytokine-free medium. In vitro starvation experiments were performed in minimum essential medium supplemented with 10% dialyzed fetal calf serum, penicillin/streptomycin, and 1× essential amino acids (all Thermo Fisher Scientific), yielding a Ser/Gly-free medium. Where appropriate Ser and or Gly (Sigma-Aldrich, Taufkirchen, Germany) were added to a final concentration of 400 µM.
The lentiviral all-in-one vector pLEPIR was modified from the miRNA30 design developed by Fellmann et al15 by standard molecular biology procedures. Constructs were verified by sequencing. Short hairpin target sequences can be cloned into the unique XhoI/EcoRI sites. Target sequences used for this project were murine Ptbp1 779-AAGTCTCAATGTCAAGTACAAC; murine Ptbp1 2275-AAAGAGATATAGTTTTAAGTAA; and human PTBP1 2427-CTAGCAAGATGATACAATGGTA. Polymerase chain reaction (PCR) primers are listed in supplemental Table 1.
Antibodies for staining before fluorescence-activated cell sorting (FACS) were provided by eBioscience (Thermo Fisher Scientific). Western blot reagents were purchased from Cell Signaling Technologies (CST; Frankfurt/Main, Germany).
CFC assays
For colony-forming cell (CFC) experiments, we incubated cells for 48 hours under test and control conditions. An equal number of cells was subsequently plated in triplicate into methylcellulose (Methocult M3231; Stemcell Technologies, Köln, Germany), supplemented with recombinant cytokines at concentrations identical with those in liquid growth medium. Medium for cells from patients contained recombinant hIL7, hFlt3 ligand, hIL3 (all 10 ng/mL), and murine SCF (100 ng/mL). Colonies were grown in Methocult H4035optimum without EPO (Stemcell Technologies). The cells were counted after staining with iodonitrotetrazolium chloride (Sigma-Aldrich) at a final concentration of 0.1 mg/mL by photographic evaluation with the software OpenCFU 3.9.0 (http://www.opencfu.sourceforge.net/). For the use of human samples, informed consent was obtained after institutional review board approval according to local laws and regulations and in accordance with the Declaration of Helsinki.
Cell cycle, apoptosis, and ROS determination
Cell cycle distribution was determined by propidium iodide staining followed by FACS analysis. Apoptosis was measured by annexin V-propidium iodide staining with an apoptosis-detection kit from eBioscience, according to the instructions of the manufacturer (Thermo Fisher Scientific). Cellular reactive oxygen species (ROS) were detected by FACS after staining with CellROX deep red reagent, as recommended by the supplier (Thermo Fisher Scientific).
Glucose and lactate determination: seahorse experiments
The glucose and lactate content of the culture supernatant was determined with a Super GL compact analyzer (Hitado, Dreihausen, Germany), according to the manufacturer’s guidelines. Glucose transport was measured by starving cells for 2 hours in glucose-free medium followed by addition of 30 µM 2NBDG [(2-(N-(7-nitrobenz-2-oxa-1,3-diazol-4-yl)amino)-2-deoxyglucose; Thermo Fisher Scientific] for 2 minutes. The cells were subsequently washed and analyzed by FACS. Bioenergetics of murine MLL-r cells were assessed with an XFe96 Extracellular Flux Analyzer (Agilent Technologies, Waldbronn, Germany), as previously described.16 In brief, cells were harvested after culture and immobilized in a XF96 cell culture plate (Agilent Technologies) using CellTAK (BD, Heidelberg, Germany) at a density of 105 cells per well with 5 to 7 technical replicates. Extracellular acidification rate (ECAR) and oxygen consumption rate (OCR) were recorded upon sequential addition of glucose, oligomycin, and 2DG for the glycolysis stress test, as well as oligomycin, FCCP, and antimycin A/rotenone for the mitochondrial stress test.
Nascent RNA sequencing
Nascent-RNA sequencing was performed exactly as published.17 NGS library construction was performed using a polyA priming strategy, with the NEBNext Single Cell/Low Input RNA Library Prep Kit, and libraries were sequenced commercially on an Illumina HiSeq, exactly as recommended by the manufacturers. Sequences were mapped with STAR2.5.3a,18 and expression levels were evaluated with Cufflinks2.2.1.19
Transplantation assays
For transplantation experiments, sublethally irradiated (BALB/c; 7 Gy), syngenic recipients were injected with 1 × 10E6 MLL-ENL–transduced cells and 1 × 10E6 total bone marrow cells for radioprotection. Recipients were fed ad libitum with defined chow from TestDiet (Richmond, IN). Animals were supplied with either a control diet (5WA1-BakerAA: 15% sucrose, 8% fat, 15% protein equivalent, fully supplemented with vitamins, minerals, and proteins according to manufacturer’s specifications) or the specially formulated AminoAcid Diet without Ser and glycine (5B62) that was of identical composition, except that Ser/Gly were omitted, with the remaining amino acids increased proportionally to make up for the missing amino acids. All animal experiments were planned and executed according to institutional and regulatory authority guidelines incorporating the 3R (replace, reduce, and refine) principles.
Statistics
General significance was calculated by 2-sided, nonpaired Student t tests. Survival curves were tested by Kaplan-Meier analysis.
Results
Knockdown of PTBP1 causes a metabolic phenotype
To individually assess the role of direct MLL-ENL targets, as identified in our previous work,17 we modified an available15 lentiviral all-in-one tetracycline-inducible short hairpin (shRNA) expression system (Figure 1A). A puromycin cassette was coupled via an IRES sequence to a reverse tetracycline-inducible transactivator to allow for antibiotic selection of the integrated provirus. In addition, the shRNA processing cassette was placed into the 3′ untranslated region of cDNA coding for the extracellular part of the low-affinity nerve growth factor receptor (LNGFR), enabling specific magnetic enrichment and surface staining for quantification of shRNA-expressing cells. This strategy became necessary because we noted that integrated lentiviruses showed strong variegated expression with respect to the tet-inducible gene. Despite the 100% puromycin-resistant population, not all cells expressed the respective shRNA/LNGFR, which would preclude accurate quantification of knockdown efficiency by quantitative PCR (qPCR), which was therefore performed on LNGFR-selected cell populations. Cell sorting confirmed that the expression state (shRNA on/off) within a cell remained stable over time (supplemental Figure 1A).

Knockdown of Ptbp1/PTBP1 causes a metabolic phenotype. (A) Overview of the pLEPIR lentiviral all-in-one vector for tetracycline-inducible expression of shRNAs. (B) Knockdown efficiency after shRNA treatment in murine MLL-ENL–transformed primary HSPCs and human MOLM13 cells. Shown are qPCR results obtained with RNA isolated from cells selected for the presence of LNGFR from shRNA-expressing and vector-only (nontargeting shRNA) populations. (C) Ptbp1/PTBP1 knockdown affected long-term fitness of the cells. The graph depicts the percentage of shRNA+ (knockdown) cells, as detected by coupled expression of a truncated LNGFR in FACS analysis. Cultures were induced at day 0. Further explanations are given in the text. A representative of 2 experiments is depicted. (D) Visual aspect of Ptbp1 knockdown. An equal number of selected knockdown (shRNA) and control (vec) cells was cultivated overnight demonstrating reduced medium acidification as a consequence of shRNA activity. This phenotype was observed in murine and human cells; only the murine sample is shown. (E) Glucose and lactate metabolism changed after knockdown of Ptbp1/PTBP1. An equal number of enriched LNGFR+ cells from cultures expressing shRNA or vector as controls were seeded, and glucose and lactate concentrations were determined in supernatant medium sampled at the indicated time points.
Knockdown of Ptbp1/PTBP1 causes a metabolic phenotype. (A) Overview of the pLEPIR lentiviral all-in-one vector for tetracycline-inducible expression of shRNAs. (B) Knockdown efficiency after shRNA treatment in murine MLL-ENL–transformed primary HSPCs and human MOLM13 cells. Shown are qPCR results obtained with RNA isolated from cells selected for the presence of LNGFR from shRNA-expressing and vector-only (nontargeting shRNA) populations. (C) Ptbp1/PTBP1 knockdown affected long-term fitness of the cells. The graph depicts the percentage of shRNA+ (knockdown) cells, as detected by coupled expression of a truncated LNGFR in FACS analysis. Cultures were induced at day 0. Further explanations are given in the text. A representative of 2 experiments is depicted. (D) Visual aspect of Ptbp1 knockdown. An equal number of selected knockdown (shRNA) and control (vec) cells was cultivated overnight demonstrating reduced medium acidification as a consequence of shRNA activity. This phenotype was observed in murine and human cells; only the murine sample is shown. (E) Glucose and lactate metabolism changed after knockdown of Ptbp1/PTBP1. An equal number of enriched LNGFR+ cells from cultures expressing shRNA or vector as controls were seeded, and glucose and lactate concentrations were determined in supernatant medium sampled at the indicated time points.
After knockdown of the confirmed MLL-ENL target gene and splicing factor20 Ptbp1/PTBP1 (henceforth PTBP1, if of human and murine origin) in murine MLL-ENL–transformed cells and in the human cell line MOLM13 (derived from an MLL-AF9 leukemia), we saw an unusual phenotype. Reduction of PTBP1 (Figure 1B) not only led to a gradual loss of shRNA-expressing (LNGFR+) cells from mixed cultures (Figure 1C), but shRNA+ cells also displayed a clear metabolic phenotype (Figure 1D). Despite identical density, PTBP1-knockdown cells showed delayed medium acidification compared with the shRNA/LNGFR− controls. Because lactate is a major acidic metabolite, we examined this phenomenon further by quantifying glucose and lactate levels in supernatants of equally dense cultures of knockdown and control cells (Figure 1E). These experiments corroborated the previous visual observations, indicating that a reduction in PTBP1 reduces glucose consumption and lactate production. Knockdown was accompanied by a weak-to-moderate arrest in G1, but no increase in apoptosis, when compared to the controls (supplemental Figure 1B).
PTBP1 controls splicing of PKM
PTBP1 is a known splicing factor that binds to HNRNPA1 (heterogeneous nuclear RNA binding protein 1). The resulting dimer regulates alternative splicing of many transcripts, including the mRNA for pyruvate kinase M (PKM; M is the muscle type, named according to the tissue of initial characterization).21 PKM is present in 2 isoforms that differ in alternative inclusion of either exon 9 or exon 10 (Figure 2A). High levels of PTBP1/HNRNPA1 cause skipping of exon 9, leading to predominant translation of isoform 2 (PKM2), whereas absence of these proteins favors production of PKM1, which skips exon 10.22 To see whether the presence of MLL fusion forces a shift toward PKM2 through upregulation of PTBP1, we determined splicing patterns in knockdown and control cells. The identification of these patterns was possible because the coding sequence of exon 10 contains a restriction enzyme site not present in exon 9. Digestion with PstI selectively cleaves the cDNA for PKM2. Splicing patterns were determined in murine and in MOLM13 cells by using 3 different shRNAs in total (Figure 2B), demonstrating a reduction of the PKM2/PKM1 ratio upon loss of PTBP1. This was confirmed at the protein level with isoform-specific antibodies detecting a shift from PKM2 to PKM1 after knockdown (Figure 2C). In human cells, total PKM protein was upregulated as a response. A close correlation of MLL-ENL activity, Ptbp1 transcription, and Pkm2/Pkm1 ratios was also detectable in primary murine cells transformed by a tamoxifen-inducible derivative of MLL-ENL integrated into the genome under control of the endogenous Mll control elements, derived from MLL-ENL-ER mice, as described previously23 (Figure 2D).
![Knockdown of Ptbp1/PTBP1 affects splicing of PKM in MLL-transformed cells. (A) Schematic depiction of alternative splicing options for PKM RNA. Concentrations of available Ptbp1/Hnrnpa1 dimers altered exon retention in PKM RNA. High levels of Ptbp1/Hnrnpa1 favored alternative inclusion of exon 10, thus preferentially producing isoform PKM2. (B) Analysis of PKM splice isoforms. RNA was isolated from selected shRNA (LNGFR)-positive and -negative murine and human cells. After reverse transcription, the relevant PKM region was amplified by PCR and digested with the PstI enzyme, which exclusively cuts the cDNA of the PKM2 isoform. Digested and undigested PCR products are shown. Please note that an additional murine shRNA (shRNA2275) was included in this experiment. (C) PKM protein isoform analysis. Proteins were extracted from cells as in panel B and subjected to western blot analysis with antibodies specific for PKM1, PKM2, or total PKM, as indicated. (D) MLL-ENL activity correlated with Ptbp1 expression and Pkm2/Pkm1 ratio. Left: RNA was isolated from primary cells transformed by a tamoxifen-inducible version of MLL-ENL at the indicated time points (0 days [0d], TAM present and MLL-ENL active). Pkm1/2 splice analysis was performed by detection of the Pkm2-specific RFLP through digestion with PstI. Ptbp1 transcript levels in the same RNA samples were determined by quantitative reverse transcription-PCR.](https://ash.silverchair-cdn.com/ash/content_public/journal/bloodadvances/4/15/10.1182_bloodadvances.2020001710/2/m_advancesadv2020001710f2.png?Expires=1765923084&Signature=mhHCB0SNzuoPK~cMWOa3GbkzSd-uNs~T1uwrY6wWGzMqXR3tYatdkxeaqxk3YT6fnSakxM1859SqPUzwvMHJHT-QoKr5eF9n5X9ySWOjkhRXFKFMSk9C16iQZIK~A~NuPJtZ66yLua-oARkxV7kFBzh3p2gwcVf6iPaxu2IfEt~FEAbMRLE0xpzZSzULOnwjbmoUoFuxwVnxs70s-VCWb-lh16dJKmw7XpEzhHbwSWCo5pMiEps5dxJy2IYdTEjdPT1-DW0TjOn8CzY3woqi2rKTz3Zs~nKGIj66RLIOJlSjfVRNJP6g~fwVlMfZiiBzolQp5W6k5TYrkZKX4WTfHg__&Key-Pair-Id=APKAIE5G5CRDK6RD3PGA)
Knockdown of Ptbp1/PTBP1 affects splicing of PKM in MLL-transformed cells. (A) Schematic depiction of alternative splicing options for PKM RNA. Concentrations of available Ptbp1/Hnrnpa1 dimers altered exon retention in PKM RNA. High levels of Ptbp1/Hnrnpa1 favored alternative inclusion of exon 10, thus preferentially producing isoform PKM2. (B) Analysis of PKM splice isoforms. RNA was isolated from selected shRNA (LNGFR)-positive and -negative murine and human cells. After reverse transcription, the relevant PKM region was amplified by PCR and digested with the PstI enzyme, which exclusively cuts the cDNA of the PKM2 isoform. Digested and undigested PCR products are shown. Please note that an additional murine shRNA (shRNA2275) was included in this experiment. (C) PKM protein isoform analysis. Proteins were extracted from cells as in panel B and subjected to western blot analysis with antibodies specific for PKM1, PKM2, or total PKM, as indicated. (D) MLL-ENL activity correlated with Ptbp1 expression and Pkm2/Pkm1 ratio. Left: RNA was isolated from primary cells transformed by a tamoxifen-inducible version of MLL-ENL at the indicated time points (0 days [0d], TAM present and MLL-ENL active). Pkm1/2 splice analysis was performed by detection of the Pkm2-specific RFLP through digestion with PstI. Ptbp1 transcript levels in the same RNA samples were determined by quantitative reverse transcription-PCR.
Knockdown of Ptbp1/PTBP1 affects splicing of PKM in MLL-transformed cells. (A) Schematic depiction of alternative splicing options for PKM RNA. Concentrations of available Ptbp1/Hnrnpa1 dimers altered exon retention in PKM RNA. High levels of Ptbp1/Hnrnpa1 favored alternative inclusion of exon 10, thus preferentially producing isoform PKM2. (B) Analysis of PKM splice isoforms. RNA was isolated from selected shRNA (LNGFR)-positive and -negative murine and human cells. After reverse transcription, the relevant PKM region was amplified by PCR and digested with the PstI enzyme, which exclusively cuts the cDNA of the PKM2 isoform. Digested and undigested PCR products are shown. Please note that an additional murine shRNA (shRNA2275) was included in this experiment. (C) PKM protein isoform analysis. Proteins were extracted from cells as in panel B and subjected to western blot analysis with antibodies specific for PKM1, PKM2, or total PKM, as indicated. (D) MLL-ENL activity correlated with Ptbp1 expression and Pkm2/Pkm1 ratio. Left: RNA was isolated from primary cells transformed by a tamoxifen-inducible version of MLL-ENL at the indicated time points (0 days [0d], TAM present and MLL-ENL active). Pkm1/2 splice analysis was performed by detection of the Pkm2-specific RFLP through digestion with PstI. Ptbp1 transcript levels in the same RNA samples were determined by quantitative reverse transcription-PCR.
MLL-ENL–transformed cells are sensitive to nutrient restriction
PKM1/2 are major regulators of the cellular metabolic state.22 PKM2 has reduced catalytic activity compared with PKM1, and therefore the ratio of PKM2/PKM1 controls the outflow of phosphoenolpyruvate from glycolysis. Slowing down phosphoenolpyruvate conversion causes accumulation of glycolytic intermediates as the anabolic precursors necessary for proliferation (Figure 3A). This shifts metabolism away from the normally predominant oxidative phosphorylation, and it is part of the Warburg effect. A complete genomic deletion of PKM2 prevents leukemogenesis in general.24 In addition, PKM2 causes cells to adapt to increased Ser demand, because in contrast to PKM1, PKM2 is an allosteric enzyme that needs to be bound to Ser for full activity. Thus Ser deprivation reduces PKM2 activity and blocks glycolytic outflow further and thus increases the concentration of 3-phosphoglycerate as the starting point for de novo Ser biosynthesis.25,26 To ascertain the involvement of glycolytic control in the observed phenotype, we performed glycolytic and mitochondrial stress tests (Figure 3B). Because the consequences of PTBP1 knockdown were very similar in murine and human cells, these and all further experiments were performed with murine cells only. PTBP1-knockdown cells displayed a larger OCR, congruent with a higher mitochondrial influx and increased oxidative phosphorylation, as expected of cells with higher PKM1 levels. Interestingly, the ATP synthesis rate was not correspondingly increased. Rather, energy seemed to be dissipated by mitochondrial uncoupling. This finding goes along with the previous observation that PTBP1 knockdown slowed proliferation and hence concomitantly also slowed energy consumption. ECARs, mainly caused by lactate production, were also diminished after knockdown, corroborating the previous lactate measurements.

PKM isoform splicing shifts are indicative of the increased anabolic need of leukemic cells. (A) Simplified overview of glycolysis and regulation by PKM isoforms. PKM is the rate-limiting factor of glycolytic outflow, with PKM1 favoring channeling carbon from glucose to mitochondria for energy production. PKM2 generally has lower catalytic activity, restricting exit from glycolysis and guaranteeing the availability of anabolic intermediates. The inhibitors used in this study and their intervention points are schematically indicated. 3-Phosphoglycerate is a precursor of Ser and therefore indirectly also of glycine and glutathione synthesis. For clarity, the pentose-phosphate cycle that is necessary for production of nucleotide bases was omitted. (B) Seahorse analysis of metabolic changes induced by Ptbp1 knockdown. Murine control and knockdown cells were subjected to measurements of OCRs and ECARs. Relevant differences are shaded blue. (C) Determination of 50% inhibitory concentrations for inhibitors of glycolysis (2-deoxy-glucose), Ser biosynthesis (CBR5884), and energy production (rotenone). The experiment was performed with murine MLL-ENL transformed cells and graphs depict relative proliferation as determined by standard MTT tests. (D) Effect of metabolic drugs on colony formation. The number of CFUs was determined after a 48-hour transient treatment of leukemic cells (MLL-ENL transduced) and normal HSPCs (Kit/CD117+ fraction of bone marrow including GMPs) with inhibitors or a solvent control in the indicated concentrations. Top: the mean and standard deviation of the relative number of colonies recorded in triplicate experiments. Bottom: a representative example of methylcellulose cultures after staining of colonies with INT.
PKM isoform splicing shifts are indicative of the increased anabolic need of leukemic cells. (A) Simplified overview of glycolysis and regulation by PKM isoforms. PKM is the rate-limiting factor of glycolytic outflow, with PKM1 favoring channeling carbon from glucose to mitochondria for energy production. PKM2 generally has lower catalytic activity, restricting exit from glycolysis and guaranteeing the availability of anabolic intermediates. The inhibitors used in this study and their intervention points are schematically indicated. 3-Phosphoglycerate is a precursor of Ser and therefore indirectly also of glycine and glutathione synthesis. For clarity, the pentose-phosphate cycle that is necessary for production of nucleotide bases was omitted. (B) Seahorse analysis of metabolic changes induced by Ptbp1 knockdown. Murine control and knockdown cells were subjected to measurements of OCRs and ECARs. Relevant differences are shaded blue. (C) Determination of 50% inhibitory concentrations for inhibitors of glycolysis (2-deoxy-glucose), Ser biosynthesis (CBR5884), and energy production (rotenone). The experiment was performed with murine MLL-ENL transformed cells and graphs depict relative proliferation as determined by standard MTT tests. (D) Effect of metabolic drugs on colony formation. The number of CFUs was determined after a 48-hour transient treatment of leukemic cells (MLL-ENL transduced) and normal HSPCs (Kit/CD117+ fraction of bone marrow including GMPs) with inhibitors or a solvent control in the indicated concentrations. Top: the mean and standard deviation of the relative number of colonies recorded in triplicate experiments. Bottom: a representative example of methylcellulose cultures after staining of colonies with INT.
That even a moderate perturbation of the anabolic efficiency of glycolysis correlated with a significant reduction in cell proliferation indicated that transformed cells were particularly dependent on an abundant supply of building blocks. Therefore, we investigated whether they would be particularly sensitive to starvation. For this purpose, we determined sensitivity to 2-deoxyglucose (DG), CBR5884, and rotenone. DG competes for glucose entry into glycolysis but cannot be metabolized, thus restricting total glycolysis rates. CBR5884 inhibits phosphoglycerate dehydrogenase (PHGDH) and therefore blocks Ser biosynthesis. In addition, Ser is the precursor of glycine and cysteine synthesis, important components of the ROS neutralizer glutathione. The mitochondrial decoupling agent rotenone was included because energy production in mitochondria is limited in PKM2-high cells, and further reduction of ATP production may therefore be particularly deleterious. The 50% inhibitory values for these substances were determined by MTT test to be 0.3 mM (DG), 2 µM (CBR5884), and 15 nM (rotenone) (Figure 3C). For effective treatment, it is more important to eradicate the leukemia repopulating unit, rather than the bulk cell population. As repopulating cells are often more resistant and because they can hide within the major population, we determined the effect of starvation specifically on the repopulating units. For this purpose, the clonogenic activity of transformed cells in comparison with normal bone marrow–derived HSPCs (kit/CD117+ subfraction including GMPs) was recorded after a transient 48-hour treatment with 2DG, CBR5884, and rotenone (Figure 3D). The evaluation of CFC assays revealed that transformed cells were significantly more sensitive to the inhibitors than were their normal counterparts.
Inhibition of Ser synthesis causes increased cellular stress and apoptosis in transformed cells
With respect to practical in vivo applications, glucose and energy starvation are difficult to achieve because neuronal cells are exquisitely sensitive to reduced glucose and energy levels. Long-lasting energy deprivation is neurotoxic, and application of rotenone to animals causes Parkinsonlike disease.27 In addition, low energy levels trigger AMP-activated protein kinase (AMPK), effectively protecting cells from further stress.28 Therefore, we decided to investigate Ser metabolism as a potentially exploitable vulnerability of leukemic cells. To further examine the preferential sensitivity of leukemic CFCs for Ser deprivation, we determined the cell cycle in leukemic/normal cultures after a 48-hour exposure to CBR5884 (Figure 4A). Whereas controls did not show significant changes in cycle distribution, sub-G1 cells, confirmed to be apoptotic by annexin/propidium iodide staining (supplemental Figure 2), increased to more than 30% in the leukemic population. In comparison with normal HSPCs, this effect was accompanied by an increase in ROS and DNA damage, as detected by γ-H2AX (Figure 4B-C). To test whether ROS overproduction is the main reason for the loss of self-replicating capacity after CBR5884 treatment, CFC assays were repeated, quenching ROS with N-acetyl-cysteine (NAC; Figure 4D). Addition of 0.4 mM NAC was sufficient to reverse the effects of CBR5884, indicating that ROS was the major stressor that affected CFC viability.
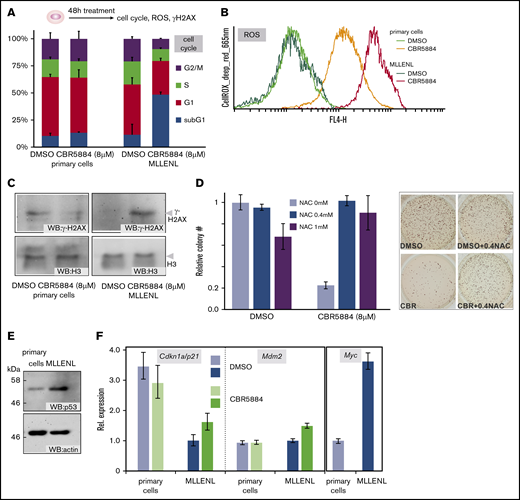
Inhibition of Ser synthesis causes cellular stress in leukemic cells (A) Cell cycle distribution of normal and leukemic HSPCs after a 48-hour block of Ser biosynthesis. Shown are means and standard deviations of 3 independent experiments. Cell cycle phases are colored as indicated. (B) Cellular ROS in cells treated as in panel A. The cells were stained with CellROX deep red reagent and evaluated by FACS. A representative example of 2 experiments is depicted. (C) DNA damage after Ser synthesis blockade. Nuclear proteins were extracted from cells treated as before and immunoblotted with antibodies against the damage-specific histone derivative γ-H2AX and for histone H3 as the control. (D) ROS quenching restores CFC activity after CBR5884 treatment. MLL-ENL–transformed cells were incubated for 48 hours with 8 µM CBR5884 and either solvent or the indicated concentrations of the ROS-quencher NAC. The number of CFCs was recorded in triplicate experiments, with results depicted as mean and standard deviation. An example of the CFC assay is shown in the right panel. DMSO (left columns) difference between NAC 0 mM to 0.4 mM is not significant; difference between 0 mM and 1 mM NAC is P = .03. CBR5884 (right columns) difference between 0 mM and 0.4 mM NAC is P = .00002; difference between 0 mM and 1 mM NAC is P = .002. (E) Steady state levels of p53 in normal and leukemic HSPCs, as detected by western blot. (F) Blunted p53 response in leukemic cells. Expression levels of the major p53 target genes Cdkn1a/p21 and Mdm2, as well as those of the p53 antagonist Myc were determined by qPCR in normal and leukemic HSPCs, in steady state and after CBR5884 treatment.
Inhibition of Ser synthesis causes cellular stress in leukemic cells (A) Cell cycle distribution of normal and leukemic HSPCs after a 48-hour block of Ser biosynthesis. Shown are means and standard deviations of 3 independent experiments. Cell cycle phases are colored as indicated. (B) Cellular ROS in cells treated as in panel A. The cells were stained with CellROX deep red reagent and evaluated by FACS. A representative example of 2 experiments is depicted. (C) DNA damage after Ser synthesis blockade. Nuclear proteins were extracted from cells treated as before and immunoblotted with antibodies against the damage-specific histone derivative γ-H2AX and for histone H3 as the control. (D) ROS quenching restores CFC activity after CBR5884 treatment. MLL-ENL–transformed cells were incubated for 48 hours with 8 µM CBR5884 and either solvent or the indicated concentrations of the ROS-quencher NAC. The number of CFCs was recorded in triplicate experiments, with results depicted as mean and standard deviation. An example of the CFC assay is shown in the right panel. DMSO (left columns) difference between NAC 0 mM to 0.4 mM is not significant; difference between 0 mM and 1 mM NAC is P = .03. CBR5884 (right columns) difference between 0 mM and 0.4 mM NAC is P = .00002; difference between 0 mM and 1 mM NAC is P = .002. (E) Steady state levels of p53 in normal and leukemic HSPCs, as detected by western blot. (F) Blunted p53 response in leukemic cells. Expression levels of the major p53 target genes Cdkn1a/p21 and Mdm2, as well as those of the p53 antagonist Myc were determined by qPCR in normal and leukemic HSPCs, in steady state and after CBR5884 treatment.
Because the tumor suppressor TP53 is central for cellular stress response, we checked the level of TP53 in untreated normal HSPCs and leukemic cells (Figure 4E). TP53 was higher in transformed cells, an unexpected result, because TP53 activates transcription of the cell-cycle inhibitor p21, the presence of which should be incompatible with active proliferation. TP53 was not mutated in MLL-ENL cells, as confirmed by sequencing (not shown); however, its transcriptional response was blunted. Despite the higher level of TP53 protein in transformed cells, TP53 targets p21 and Mdm2 were significantly lower or equal to the levels observed in primary bone marrow HSPCs (Figure 4F). A potential explanation for this reduced TP53 activity in leukemia was found in much higher expression of Myc, a gene that is not only known to be stimulated by MLL fusions but also to act as a repressor of TP53-induced transcription. In addition, it has been shown that MLL fusions can directly bind and inhibit p53.29
MLL-ENL–transformed cells are dependent on exogenous Ser/Gly in vitro and in vivo
The pharmacodynamic properties of CBR5884 are not ideal for in vivo applications. Yet, it has been reported that the increased demand for Ser and glycine of some cancers require an additional exogenous supply of these normally nonessential amino acids.30,31 Because selective starvation for these amino acids would be a very simple and enticing option to influence leukemia development, we tested MLL-ENL–transformed cells for their reliance on exogenous Ser and/or glycine (Figure 5A). Although depletion of glycine did not have effects on cells in MTT tests, proliferation was reduced in Ser-free medium, and this reduction was exacerbated by combined omission of Ser and glycine. Because Ser is the biosynthetic precursor of glycine, a reduction of exogenous glycine depletes Ser stores even further. Remarkably, a transient 48-hour period of Ser/Gly starvation was sufficient to reduce clonogenic activity of leukemic cells to ∼10% of the control value. In contrast, the same treatment had no effect on CFC capability of normal HSPC (Figure 5B-C). Exogenous Ser/Gly starvation increased cellular ROS only moderately, and it did not affect cell-cycle distribution (Figure 5D-E). However, cells responded with a differentiation stimulus, as detected by an induction of the maturation marker Gr-1 (Ly6C/G; Figure 5F). By subjecting 2 human samples to the same treatment, we confirmed that sensitivity to Ser/Gly starvation is not restricted to murine cells (Figure 5G). CFC assays demonstrated that a 48-hour starvation for Ser/Gly causes a strong reduction in clonogenic activity in original human cells, as well.
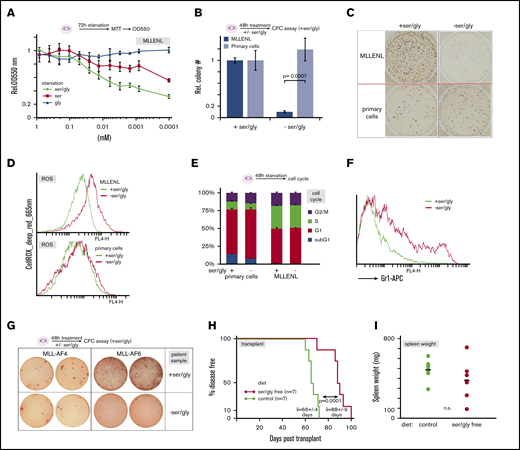
Leukemic cells are dependent on an exogenous source of Ser/Gly (A) Effect of Ser and/or Gly starvation on leukemic cells. MLL-ENL–transduced primary HSPCs were incubated in minimal essential medium supplemented with the indicated concentrations of Ser and Gly or a combination of both amino acids. Proliferation was recorded by standard MTT assays. (B) Selective starvation for Ser and Gly reduces the number of leukemic CFCs. Mean and standard deviation of the relative number of CFCs obtained after a transient starvation of normal and leukemic HSPCs for Ser and Gly. This experiment was performed in triplicate. (C) A sample aspect of CFC colonies in methylcellulose obtained with normal and leukemic cells grown for 48 hours, with or without Ser/Gly. Note that the methylcellulose medium used to enumerate CFCs contains standard amounts of the amino acids. (D) ROS production in normal and leukemic cells after amino acid starvation, as above. FACS plots after staining with CellROX deep-red reagent are shown. (E) Cell cycle distribution of cells as in panel D. (F) Surface staining of leukemic cells for the differentiation marker Gr-1 (Ly6-G) cultivated for 48 hours in supplemented or Ser/Gly-starved conditions. (G) Effect of Ser/Gly deprivation on CFC capacity of MLL-r samples from patients. Cells obtained from leukemic blasts of 2 patients diagnosed with an MLL-AF4 and an MLL-AF6 translocation respectively were cultivated for 48 hours in medium, with or without Ser/Gly, and subsequently plated in duplicate into fully supplemented methylcellulose medium. Colonies were stained and photographed. (H) Survival curve of leukemia cell transplant-recipient animals under different nutrient conditions. Transplant recipients grafted with syngenic MLL-ENL–transduced cells were separated into 2 cohorts fed with either complete chow as the control (green line) or with specifically formulated Ser/Gly-free diet that was otherwise of identical composition (red line). Given are the mean and standard deviation of mean survival times. (I) Spleen weight of animals as recorded in panel H.
Leukemic cells are dependent on an exogenous source of Ser/Gly (A) Effect of Ser and/or Gly starvation on leukemic cells. MLL-ENL–transduced primary HSPCs were incubated in minimal essential medium supplemented with the indicated concentrations of Ser and Gly or a combination of both amino acids. Proliferation was recorded by standard MTT assays. (B) Selective starvation for Ser and Gly reduces the number of leukemic CFCs. Mean and standard deviation of the relative number of CFCs obtained after a transient starvation of normal and leukemic HSPCs for Ser and Gly. This experiment was performed in triplicate. (C) A sample aspect of CFC colonies in methylcellulose obtained with normal and leukemic cells grown for 48 hours, with or without Ser/Gly. Note that the methylcellulose medium used to enumerate CFCs contains standard amounts of the amino acids. (D) ROS production in normal and leukemic cells after amino acid starvation, as above. FACS plots after staining with CellROX deep-red reagent are shown. (E) Cell cycle distribution of cells as in panel D. (F) Surface staining of leukemic cells for the differentiation marker Gr-1 (Ly6-G) cultivated for 48 hours in supplemented or Ser/Gly-starved conditions. (G) Effect of Ser/Gly deprivation on CFC capacity of MLL-r samples from patients. Cells obtained from leukemic blasts of 2 patients diagnosed with an MLL-AF4 and an MLL-AF6 translocation respectively were cultivated for 48 hours in medium, with or without Ser/Gly, and subsequently plated in duplicate into fully supplemented methylcellulose medium. Colonies were stained and photographed. (H) Survival curve of leukemia cell transplant-recipient animals under different nutrient conditions. Transplant recipients grafted with syngenic MLL-ENL–transduced cells were separated into 2 cohorts fed with either complete chow as the control (green line) or with specifically formulated Ser/Gly-free diet that was otherwise of identical composition (red line). Given are the mean and standard deviation of mean survival times. (I) Spleen weight of animals as recorded in panel H.
Finally, we tested the effects of selective Ser/Gly starvation on development of leukemia in vivo. A transplantation experiment was performed by injecting MLL-ENL transduced syngenic HSPCs into sublethally irradiated recipients. Animals were fed either a special Ser/Gly-free chow or an identical diet including those amino acids. Health was monitored by an institutionally standardized scoring procedure. Upon persistent signs of diseaselike hunched posture, alterations in fur hygiene, and labored breathing, the animals were euthanized and examined for signs of leukemia, such as increased and infiltrated spleen, pale liver, enlarged lymph nodes, and bone marrow blasts. Leukemia was also confirmed if permanently proliferating myeloid blast cultures were established from spleen samples, which was the case in all animals tested (not shown). Remarkably, dietary Ser/Gly restriction was sufficient to prolong overall survival by ∼30% in the Ser/Gly-starved population (Figure 5H). The only observable side effect of feeding a Ser/Gly-free diet was moderate alopecia, most likely caused by mutual trichophagy. Apart from that, no influence on well-being or behavior was observed. Spleen weights were not significantly different between groups indicating that experimental groups were euthanized at comparable states of leukemia development (Figure 5I), corroborating the leukemia-delaying effect of Ser/Gly-free nutrition.
Ser/Gly sensitivity in MLL-ENL–transformed cells correlates with glucose transport
To investigate the molecular details of Ser/Gly requirement more closely, we made use of a starvation-resistant population of MLL-ENL-transformed cells that was serendipitously identified after prolonged cultivation of the cells in Ser/Gly-depleted medium. The cells proliferated in the absence of Ser/Gly at nearly the same rates as the parental population in fully supplemented medium (Figure 6A), demonstrating that the requirement for exogenous supplementation with Ser/Gly is not simply a property of every proliferating cell. Genes that modulate the response to Ser/Gly deprivation were identified by isolating and sequencing nascent RNA from MLL-r cells in Ser/Gly-supplemented or -depleted medium and also from starvation-resistant cells in the absence of exogenous Ser/Gly (supplemental Table 2). Genes were ordered according to the up- or downregulation during starvation and their further change in expression in resistant cells. The top 20 genes, with a minimum threshold of a twofold expression difference between supplemented/starved conditions and an at least twofold further increase after acquiring resistance, included the glucose transporter Slc2a3/Glut3 (Figure 6B). Concomitantly, uptake of a fluorescently labeled glucose analog (2NBDG) was higher in the starvation-resistant population (Figure 6C). qPCR showed that Slc2a/Glut3 expression was also elevated in normal HSPC control cells compared with MLL-ENL–transformed cells (Figure 6D). Because higher intracellular glucose alleviated external Ser/Gly requirements, we wanted to clarify whether amino acid starvation also triggers the AMPK alert system (Figure 6E). Although restricting glucose or energy by administering 2DG or rotenone induced AMPK phosphorylation, no such activity was elicited by Ser/Gly deprivation. Thus, increasing intracellular glucose can alleviate the need for exogenous amino acids, but the effects of Ser/Gly and glucose starvation are not equivalent.

The sensitivity of leukemic cells toward amino acid starvation correlates with sugar transport. (A) Spontaneous emergence of a Ser/Gly starvation-resistant population. Proliferation rates of the parental and resistant (res. clone) cells under cultivation conditions as indicated. (B) Heat map depicting the top 20 genes selected according to upregulation under starvation conditions and in starvation-resistant cells. The glucose transporter Slc2a3 (also known as Glut3) is highlighted. (C) Ser/Gly starvation resistance correlated with glucose transport capacity. Glucose uptake was measured by incubation with 2NBDG, a fluorescent glucose analogue, and measured by FACS. (D) Relative expression of Slc2a3 determined by qPCR in leukemic, resistant, and normal cells in complete (blue bars) or Ser/Gly-deficient (red bars) medium. (E) AMPK was not activated by Ser/Gly starvation. MLL-ENL transformed cells were incubated for 48 hours under the indicated conditions, and cellular extracts were analyzed for the presence of total and active/phosphorylated AMPK by western blot.
The sensitivity of leukemic cells toward amino acid starvation correlates with sugar transport. (A) Spontaneous emergence of a Ser/Gly starvation-resistant population. Proliferation rates of the parental and resistant (res. clone) cells under cultivation conditions as indicated. (B) Heat map depicting the top 20 genes selected according to upregulation under starvation conditions and in starvation-resistant cells. The glucose transporter Slc2a3 (also known as Glut3) is highlighted. (C) Ser/Gly starvation resistance correlated with glucose transport capacity. Glucose uptake was measured by incubation with 2NBDG, a fluorescent glucose analogue, and measured by FACS. (D) Relative expression of Slc2a3 determined by qPCR in leukemic, resistant, and normal cells in complete (blue bars) or Ser/Gly-deficient (red bars) medium. (E) AMPK was not activated by Ser/Gly starvation. MLL-ENL transformed cells were incubated for 48 hours under the indicated conditions, and cellular extracts were analyzed for the presence of total and active/phosphorylated AMPK by western blot.
Activation of the Ras/MAPK pathway has been described as an alternative means of enabling cells to adapt to increased anabolic demand. Concomitantly, Ras alterations are the most frequent passenger mutations identified in MLL-r leukemia. Therefore, we tested whether mutated Ras renders MLL-r cells more resistant against Ser/Gly starvation. Yet, although ERK was clearly activated by the introduced RasG12R, the cells did not acquire Ser/Gly starvation resistance (supplemental Figure 3).
Discussion
Altered metabolism is a hallmark of all cancer cells. Ultimately, every driver oncogene needs to perturb normal metabolic reactions to secure the increased demand of anabolic intermediates necessary to sustain transformed growth. Yet, the molecular pathways achieving this perturbation are likely to differ, depending on the transforming oncogene. The MLL-ENL fusion protein restricts glycolytic flux via the PTBP1/PKM axis, creating an increased output of biosynthetic intermediates. However, this effect is obviously not sufficient to provide leukemic cells with adequate amounts of Ser and Gly. As a consequence, they become dependent on dietary supplementation with these normally nonessential amino acids. Strong support for our conclusions comes from the recent work of Göttgens and colleagues,32 who showed that MLL-ENL–transformed cells are enriched for a gene set representing the glycine metabolic process. In addition, they identified lactate dehydrogenase as an MLL-ENL–specific candidate drug target in an unbiased genome-wide screening. These finding fully corroborate our data, given that a block of glycolytic outflow mandated disposal of glycolytic reduction equivalents (NADH/H+) through lactate synthesis catalyzed by lactate dehydrogenase.
That a simple dietary change can extend overall survival by ∼30% in the highly aggressive MLL-ENL transplantation model is particularly remarkable. Comparable results have been reached otherwise only with potentially toxic interventions such as inhibition of CDK97 or BRD4.6
Activation of the PTBP1/PKM pathway is not restricted to MLL fusion proteins. PTBP1 is known to be under MYC control, and indeed, Ser/Gly starvation has been demonstrated to be effective in an MYC-driven lymphoma model.31 Corroborating the link to MYC function, it has been shown that MYCN-overexpressing neuronal tumors are metabolically reprogrammed causing an increased dependency on Ser/Gly biosynthesis.33 As MYC itself is a target of MLL fusions a strong MYC signature may be a feature indicating potential Ser/Gly sensitivity. MYC overexpression is also a frequent feature of AML. Therefore, it must be determined whether sensitivity toward Ser/Gly deprivation is a more general feature of this disease entity.
In this regard, it is important to stress that selective Ser/Gly starvation is different from simply restricting calories or glucose. A comparable transplantation model revealed that a ketogenic diet forcing energy production from fatty acids and thus depleting glycolytic intermediates exacerbated the development of MLL-induced leukemia.34 Cells have developed various mechanisms to protect them from metabolic stress during phases of “natural” nutrient paucity. The AMP-activated kinase AMPK is one of these alert systems. In previous work,28 AMPK deletion or inhibition was necessary to sensitize MLL-AF9 cells to general glucose deprivation. Active AMPK increased glucose uptake, suppressed ROS production, and prevented DNA damage, effectively protecting leukemia cells from the detrimental effects of glucose starvation. In contrast, selective depletion of individual amino acids does not occur naturally, precluding evolutionary selection to survive such a condition. In this regard, it is interesting to note that the widely used chemotherapy agent methotrexate inhibits purine and pyrimidine synthesis that also branches off glycolysis. Therefore, it is tempting to speculate that selective starvation that affects specific branches of anabolic metabolism, rather than a broader approach (eg, by restricting glucose), may circumvent endogenous alert systems. This adds selective nutrient deprivation to the available metabolic strategies35 that may serve as accessory therapy. Based on the available experience with animal chow, an amino acid–specified diet should be composable for human consumption, which could replace regular diet during chemotherapy breaks, for example. The ease of clinical implementation makes this selective starvation an enticing possibility for future trials.
RNA sequencing data have been deposited in the European Bioinformatics Repository (accession number E-MTAB-87380).
Acknowledgments
The authors thank Renate Zimmermann for technical assistance.
This work was supported by research funding from Deutsche Forschungsgemeinschaft (DFG) grant SL27/9-1 (R.K.S.).
Authorship
Contribution: M.-P.G.-C., J.L., M.B., and R.K.S. performed and analyzed experiments; D.M. advised on metabolite determination and seahorse experiments; M.M. provided human cell samples; R.K.S. conceived and supervised experiments and wrote the manuscript; and all authors read, discussed, and modified the manuscript.
Conflict-of-interest disclosure: The authors declare no competing financial interests.
Correspondence: Robert K. Slany, Institute for Genetics, University Erlangen, Erwin Rommel Str 3, 91058 Erlangen, Germany; e-mail: robert.slany@fau.de.

