

Key Points
A forward genetic approach identified new genes regulating T-cell surface marker expression.
A mutation in Ampd3 causes reduced naive CD4+ and CD8+ T-cell populations in peripheral blood but not in secondary lymphoid organs.

Abstract
Adenosine monophosphate deaminase 3 (Ampd3) encodes the erythrocyte isoform of the adenosine monophosphate (AMP) deaminase gene family. Mutations in this gene have been reported in humans, leading to autosomal-recessive erythrocyte AMP deaminase deficiency. However, the mutation is considered clinically asymptomatic. Using N-ethyl-N-nitrosourea mutagenesis to find mutations that affect peripheral lymphocyte populations, we identified 5 Ampd3 mutations (Ampd3guangdong, Ampd3carson, Ampd3penasco, Ampd3taos, and Ampd3commanche) that strongly correlated with a reduction in naive CD4+ T and naive CD8+ T-cell populations. Causation was confirmed by targeted ablation of Ampd3. Knockout mice had reduced frequencies of CD62LhiCD44lo CD4+ naive and CD8+ naive T cells. Interestingly, these phenotypes were restricted to T cells circulating in peripheral blood and were not seen in T cells from secondary lymphoid organs (lymph nodes and spleen). We found that reduction of naive T cells in the peripheral blood of Ampd3−/− mice was caused by T-cell–extrinsic factor(s), which we hypothesize to be elevated levels of adenosine triphosphate released by Ampd3-deficient erythrocytes. These findings provide an example in which disruption of an erythrocyte-specific protein can affect the physiological status of lymphocytes in peripheral blood.
Introduction
Adenosine monophosphate deaminase (AMPD) catalyzes the deamination of adenosine monophosphate (AMP) to inosine monophosphate (IMP) and plays an important role in purine metabolism. AMPD1, AMPD2, and AMPD3 are isoforms within the AMPD family that have distinct tissue-specific expression patterns.1 AMPD1 is predominantly expressed in skeletal muscle.2 AMPD1 deficiency in humans has been linked to exercise-induced myopathy and muscle fatigue.3 AMPD2 is mainly expressed in nonmuscle tissue, including the liver and kidneys.4 AMPD2 deficiency has been implicated in a neurodegenerative brainstem disorder.5 AMPD3 is the main AMPD isoform present in erythrocytes,6 and its expression can be detected in a wide range of tissues and cell lines.7 Human AMPD3 deficiency has been reported in Japanese and Polish populations8-10 and is characterized by an increase in steady-state levels of ATP in the erythrocytes of affected individuals. However, it is thought to be clinically benign and has not been linked to symptoms of any kind.8 Ampd3-deficient mice generated by different research groups all exhibit increased erythrocyte ATP levels.11,12 A gain-of-function mutation of Ampd3, created through N-ethyl-N-nitrosourea (ENU) mutagenesis, caused a reduction in erythrocyte ATP, as well as a striking increase in IMP in erythrocytes, which has been shown to shorten erythrocyte half-life in the affected host.13
T lymphocytes originate from c-kit+Sca1+ hematopoietic stem cells in the bone marrow. Hematopoietic stem cells gradually differentiate into multipotent progenitors and then common lymphoid progenitors, which differentiate into T, B, or natural killer cells. Some common lymphoid progenitors migrate from the circulatory system to the thymus where they engraft and undergo positive and negative selection to become mature immunocompetent T cells.14-16 After being released from the thymus, mature T cells remain in a quiescent state indefinitely before responding to foreign antigens to protect the host from microbial invasion.17,18 Typical mouse resting T cells have a naive phenotype, which is characterized by low expression of activation marker CD44 (CD44lo) and high expression of the lymph node homing receptor CD62L (CD62Lhi). The complicated process of T-cell development and homeostasis is subject to regulation by numerous T-cell–intrinsic and T-cell–extrinsic factors.18-22
To identify new regulators of T-lymphocyte development and homeostasis, we carried out a forward genetic screen in mice, combining ENU-induced germline mutagenesis with automated meiotic mapping.23 Over the course of 6 years (2013-2019), we screened 116 623 G3 mice from 3421 pedigrees for abnormal numbers of naive T cells of CD4 or CD8 subsets. These mice were a repository of 184 778 nonsynonymous coding/splicing changes in 20 756 genes. We estimate23 that 44.48% of all genes were mutated to a significantly hypomorphic state and tested ≥2 times in the homozygous state for effects on the phenotypes in question. We found 5 variant Ampd3 alleles (guangdong [gdg], carson [csn], penasco [pao], taos [tos], and commanche [cme]) that, in the homozygous state, lead to significant reductions in CD62LhiCD44lo CD4+ and CD62LhiCD44lo CD8+ populations. Using Ampd3-knockout mice, we discovered that the reduction in CD4+ and CD8+ naive T cells is restricted only to T cells circulating in peripheral blood and does not affect T cells in secondary lymphoid organs, such as lymph node and spleen. Our findings provide an example of communication between erythrocytes and the intravascular T-cell population.
Materials and methods
Animals
All mice were housed in the University of Texas Southwestern vivarium under pathogen-free conditions. All mice used in experiments were 3 to 6 months old. All animal procedures were performed in accordance with Institutional Animal Care and Use Committee–approved protocols.
ENU mutagenesis and gene mapping
ENU mutagenesis was performed as previously described.24 Mutagenized G0 males were bred to C57BL/6J females, and the resulting G1 males were crossed to C57BL/6J females to produce G2 mice. G2 females were backcrossed to their G1 sires to yield G3 mice, which were screened for phenotypes. Whole-exome sequencing and mapping were performed as previously described23 to identify candidate genes.
Generation of the Ampd3−/− mouse strain using the clustered regularly interspaced short palindromic repeats/Cas9 system
To generate the Ampd3−/− mouse strain, female C57BL/6J mice were superovulated by injection of 6.5 U pregnant mare serum gonadotropin (MilliporeSigma), followed by injection of 6.5 U human chorionic gonadotropin (Sigma-Aldrich) 48 hours later. The superovulated mice were subsequently mated overnight with C57BL/6J male mice. The following day, fertilized eggs were collected from the oviducts, and Cas9 messenger RNA (50 ng/μL) and Ampd3 single guide RNA (25 ng/μL; 5′-CACCTCCGTGCATGCGAACC-3′) were injected into the cytoplasm or pronucleus of the embryos. The injected embryos were cultured in M16 medium (Sigma-Aldrich) at 37°C in 5% CO2. For the production of mutant mice, 2-cell-stage embryos were transferred into the ampulla of the oviduct (10-20 embryos per oviduct) of pseudo-pregnant Hsd:ICR (CD-1) female mice (Harlan Laboratories).
Antibodies and reagents
For flow cytometry analysis, anti-CD62L (MEL-14) was purchased from Tonbo, anti-CD3e (145-2e11), anti-CD4 (RM4-5), and anti-CD44 (IM7) were purchased from BD Biosciences, and anti-CD8a (53-6.7), anti-CD45.1 (A20), anti-CD45.2 (104), anti–tumor necrosis factor receptor 1 (TNFR1) (55R-286), and American hamster IgG isotype were purchased from BioLegend. The following antibodies were used for the western blot analysis: anti-FLAG (M2; Sigma-Aldrich), anti-GFP (JL-8; Takara Bio), anti-Ampd3 (Bethyl Laboratories), and anti-GAPDH (6C5; Santa Cruz Biotechnology).
A mouse Pan T Cell Isolation Kit II (Miltenyi Biotec) was used to isolate mouse T cells. A Mouse sTNFR1 ELISA Kit (RayBiotech) was used for analyzing soluble TNFR1 in mouse serum samples.
Plasmids
Mouse Ampd3 was cloned into a p3xFLAG-CMV14 vector (Sigma-Aldrich). Individual Ampd3 mutations were introduced into p3xFLAG-CVM14-Ampd3 using QuikChange site-directed mutagenesis.
Cell culture and transfection
HEK293T cells were cultured in DMEM, high glucose (Thermo Fisher Scientific) containing 10% fetal bovine serum and penicillin/streptomycin at 37°C. Plasmid DNA was transfected into HEK293T cells using PolyJet In Vitro DNA Transfection Reagent (SignaGen Laboratories). RPMI 1640 (Thermo Fisher Scientific), containing 10% fetal bovine serum and supplemented with 2-mercaptoethanol and nonessential amino acid solution, was used for in vitro T-cell culture. ATP or IMP (Sigma-Aldrich) was added to media for 24 hours.
Antibodies response assay and cytotoxic T-lymphocyte assay
Mice were immunized with ovalbumin (OVA)/alum mixture (100 µg OVA per mouse) or rSFV–β-Gal (2 × 10⁶ infectious units per mouse). Serum samples were harvested 14 days postimmunization. Presence of antigen-specific immunoglobulin G (IgG) antibodies was detected using a standard enzyme-linked immunosorbent assay (ELISA). For the cytotoxic T-lymphocyte assay, spleen cells from C57BL/6J mice (B6 splenocytes) were labeled with 2 methods: (1) low-dose Far Red dye (1 µL of dye per 50 × 106 cells; control cells) or (2) B6 splenocytes pulsed with OVA peptide and then labeled with a high dose of Far Red dye (5 µL of dye per 50 × 106 cells; target cells). The populations were combined at a 1:1 ratio for IV injection into preimmunized and control mice. Twenty-four hours after injection, blood was collected for flow cytometry analysis. Percentage of killing is defined as (1 − [target cells/control cells]) × 100.
IMP injection
IMP (Sigma-Aldrich) was administered (500 mg/kg in 100 µL of phosphate-buffered saline) by intraperitoneal injection twice daily for 2 weeks.25
Blood transfusion
Blood was collected from wild-type or Ampd3−/− mice by cardiac puncture in the presence of heparin anticoagulant. Red blood cells were prepared by passing the blood through α-cellulose and microcrystalline cellulose columns (both from Sigma-Aldrich), followed by washing 3 times with phosphate-buffered saline, which removes 99.75% of leukocytes.26,27 Weekly transfusions of 0.5 mL of packed red blood cells were given to hosts twice, via tail vein injection, before blood was collected from them for flow cytometry analysis.
Statistical analysis
Data are shown as mean ± standard deviation in all graphs depicting error bars. The statistical significance of differences between experimental groups was determined using the Student t test and GraphPad Prism 7. All differences with values of P < .05 were considered significant.
Results
Loss-of-function mutations in Ampd3 caused reduction in naive T-cell populations
Through forward genetic screening of ENU-mutagenized mice combined with automated mapping, we identified 5 Ampd3 mutant alleles associated with reduced naive T-cell populations in peripheral blood (Figure 1A). The nature of Ampd3 point mutations in all mutants was revealed by exome sequencing (Figure 1B), and all 5 mutations affected amino acid residues in the AMPD catalytic domain. All mutations are predicted to be “probably damaging” by Polymorphism Phenotyping v228 scores (Figure 1B). To evaluate how these mutations affect protein stability, we cloned the wild-type Ampd3 coding sequence, as well as these Ampd3 mutant isoforms, into a FLAG-tagged vector to test the protein expression in HEK293 cells. Expressions of the resulting FLAG-tagged proteins show that the gdg and pao mutations greatly affect AMPD3 protein stability, but the csn, tos, and cme mutations do not (Figure 1C). A 3-dimensional structure of mouse AMPD3 generated based on homology predicts that W449 and I470 are located in a hydrophobic area inside the protein that is close to the active site. They interact with each other through hydrophobic interactions. Mutating these residues to charged residues could affect the stability of the hydrophobic center and, thus, the protein stability. T335, S555, and K644 are on or near the surface of the protein, and mutations in these residues could affect oligomerization of the protein or other protein-protein interactions (supplemental Figure 1).

Mutations in Ampd3 were associated with a reduction in naive CD4+ T cells. (A) Percentage of naive CD4+ T cells determined by flow cytometry in 5 Ampd3 mutants created through ENU mutagenesis. Data points represent individual mice. Mean and standard deviation are indicated. The Manhattan plot shows −log10(P value) (y-axis) plotted vs the chromosome positions of all mutations (x-axis) identified in the G1 male founders containing the Ampd3 mutation. Horizontal pink and red lines represent thresholds of P = .05, without and with Bonferroni correction, respectively. VAR, REF, and HET mice descend from mutagenized mice and harbor additional ENU-induced mutations. (B) Genetic mutation, amino acid change, and the predicted Polymorphism Phenotyping v2 score (PPH) of all 5 Ampd3 mutant alleles. (C) Diagram of the protein domains of mouse AMPD3. The location of all 5 point mutations are shown. For comparison of expression, these mutant Ampd3 genes were tagged with a FLAG-tagged epitope and transfected into HEK293T cells. GFP serves as transfection control to demonstrate similar transfection efficiency among samples. AA, amino acid; HET, Ampd3+/−; REF, Ampd3+/+; WT, wild-type mice that do not descend from mutagenized mice; VAR, Ampd3−/−.
Mutations in Ampd3 were associated with a reduction in naive CD4+ T cells. (A) Percentage of naive CD4+ T cells determined by flow cytometry in 5 Ampd3 mutants created through ENU mutagenesis. Data points represent individual mice. Mean and standard deviation are indicated. The Manhattan plot shows −log10(P value) (y-axis) plotted vs the chromosome positions of all mutations (x-axis) identified in the G1 male founders containing the Ampd3 mutation. Horizontal pink and red lines represent thresholds of P = .05, without and with Bonferroni correction, respectively. VAR, REF, and HET mice descend from mutagenized mice and harbor additional ENU-induced mutations. (B) Genetic mutation, amino acid change, and the predicted Polymorphism Phenotyping v2 score (PPH) of all 5 Ampd3 mutant alleles. (C) Diagram of the protein domains of mouse AMPD3. The location of all 5 point mutations are shown. For comparison of expression, these mutant Ampd3 genes were tagged with a FLAG-tagged epitope and transfected into HEK293T cells. GFP serves as transfection control to demonstrate similar transfection efficiency among samples. AA, amino acid; HET, Ampd3+/−; REF, Ampd3+/+; WT, wild-type mice that do not descend from mutagenized mice; VAR, Ampd3−/−.
To validate causation, clustered regularly interspaced short palindromic repeats/Cas9-mediated gene targeting was used to generate Ampd3-knockout mice. The resulting Ampd3−/− allele bears a frame-shifting 7-bp deletion in exon 5 of Ampd3, which is expected to generate a truncated form of AMPD3 completely lacking the AMPD domain. The ablation of full-length protein in Ampd3-knockout mice was confirmed by western blot (supplemental Figure 2). Ampd3−/− mice are viable and fertile, with no obvious changes in the size or shape of the lymphoid organs. Examination of the peripheral blood cells with flow cytometry showed that Ampd3−/− mice exhibited a marked reduction in CD62LhiCD44lo naive CD4+ T cells and naive CD8+ T cells and subtle, but statistically significant, changes in CD3+ T cells, CD4+ T cells, CD8+ T cells, and CD4+ and CD8+ memory T cells when large groups of animals were analyzed (Figure 2A,C). These data confirm that the Ampd3 loss-of-function mutations caused the reduction of naive CD4+ and CD8+ T-cell populations in the peripheral blood, as identified in the forward genetic screen (Ampd3gdg, Ampd3csn, Ampd3pao, Ampd3tos, and Ampd3cme). Ampd3−/− CD4+ and CD8+ T cells express lower levels of the surface marker CD62L, as detected by lower CD62L mean fluorescence intensity (MFI). However, expression of the T-cell activation marker CD44 is not affected, as evidenced by comparable CD44 MFI of wild-type and Ampd3−/− CD4+ or CD8+ cells (Figure 2B), suggesting that the reduction in naive T-cell populations in the peripheral blood in Ampd3-deficient mice is likely not due to T-cell activation.
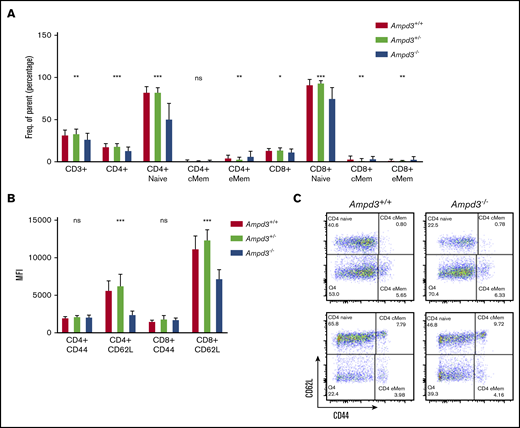
Ampd3 deficiency causes a reduction in mouse naive T cells. (A) Flow cytometry data showing frequencies of various T-cell populations in Ampd3−/− mice (reported as percentage of parent) (n = 25, n = 32, and n = 10 for Ampd3+/+, Ampd3+/−, and Ampd3−/−, respectively). (B) MFI of CD62L and CD44 of CD4+ or CD8+ T cells from Ampd3+/+, Ampd3+/−, and Ampd3−/− mice. (C) Representative flow cytometry result showing CD62L and CD44 expression of CD4+ or CD8+ T cells in Ampd3−/− and wild-type mice. *P ≤ .05, **P ≤ .01, ***P ≤ .001. Ampd3+/+ vs Ampd3−/−. cMem, central memory T cells; eMem, effector memory T cells; ns, not significant (P > .05).
Ampd3 deficiency causes a reduction in mouse naive T cells. (A) Flow cytometry data showing frequencies of various T-cell populations in Ampd3−/− mice (reported as percentage of parent) (n = 25, n = 32, and n = 10 for Ampd3+/+, Ampd3+/−, and Ampd3−/−, respectively). (B) MFI of CD62L and CD44 of CD4+ or CD8+ T cells from Ampd3+/+, Ampd3+/−, and Ampd3−/− mice. (C) Representative flow cytometry result showing CD62L and CD44 expression of CD4+ or CD8+ T cells in Ampd3−/− and wild-type mice. *P ≤ .05, **P ≤ .01, ***P ≤ .001. Ampd3+/+ vs Ampd3−/−. cMem, central memory T cells; eMem, effector memory T cells; ns, not significant (P > .05).
Attenuated immune response against OVA in Ampd3−/− mice
AMPD3 deficiency occurs in human populations, but affected individuals do not exhibit any clinically relevant symptoms.8-10 Ampd3-knockout mice have been generated previously.11,12 One study noted a slight, but significant, increase in mean corpuscular volume.11 It has also been reported that a gain-of-function Ampd3 mutant causes shortened erythrocyte half-life.13 We conducted a complete blood count but did not detect differences in several cell populations in Ampd3−/− mice compared with wild-type mice (Figure 3A). After detecting a reduction in naive CD4+ and CD8+ T-cell populations, we examined the T-cell–dependent antibody response in Ampd3-deficient mice. The mice were challenged with OVA/alum or rSFV-β-Gal, and blood serum samples were collected 14 days after immunization to measure antigen-specific IgG production by ELISA. Ampd3−/− mice mounted a similar response to rSFV-β-Gal as did wild-type controls (Figure 3B), but they showed deficiency in producing OVA-specific IgG antibody (Figure 3C). We measured the in vivo killing efficacy of OVA peptide–labeled B6 splenocytes by host cytotoxic T lymphocytes in mice immunized with OVA/alum, but we did not detect any difference in the cytotoxic T-lymphocyte killing assay between Ampd3−/− mice and wild-type mice (Figure 3D).
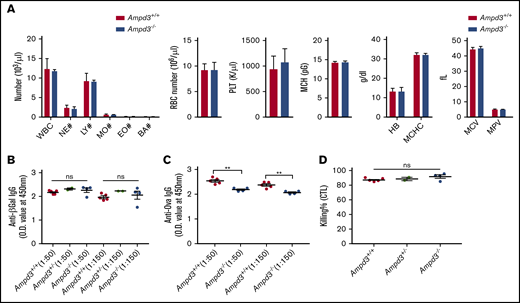
Ampd3-deficient mice show normal complete blood counts and normal T-dependent antibody response to rSFV-β-Gal but an attenuated response to OVA. (A) Complete blood count was obtained using a Hemavet 950. T cell-dependent IgG antibody was measured 14 days after immunization by rSFV-β-Gal (B) or OVA-alum (C) at 2 serum dilutions (1:50 and 1:150). (D) Killing efficacy of OVA peptide–labeled B6 splenocytes by host cytotoxic T lymphocytes (CTL). **P ≤ .01. BA, basophils; EO, eosinophils; HB, hemoglobin; LY, lymphocytes; MCH, mean corpuscular hemoglobin; MCHC, mean corpuscular hemoglobin concentration; MCV, mean corpuscular volume; MO, monocytes; MPV, mean platelet volume; NE, neutrophils; ns, not significant (P > .05); O.D., optical density; PLT, platelet; RBC, red blood cell; WBC, white blood cell.
Ampd3-deficient mice show normal complete blood counts and normal T-dependent antibody response to rSFV-β-Gal but an attenuated response to OVA. (A) Complete blood count was obtained using a Hemavet 950. T cell-dependent IgG antibody was measured 14 days after immunization by rSFV-β-Gal (B) or OVA-alum (C) at 2 serum dilutions (1:50 and 1:150). (D) Killing efficacy of OVA peptide–labeled B6 splenocytes by host cytotoxic T lymphocytes (CTL). **P ≤ .01. BA, basophils; EO, eosinophils; HB, hemoglobin; LY, lymphocytes; MCH, mean corpuscular hemoglobin; MCHC, mean corpuscular hemoglobin concentration; MCV, mean corpuscular volume; MO, monocytes; MPV, mean platelet volume; NE, neutrophils; ns, not significant (P > .05); O.D., optical density; PLT, platelet; RBC, red blood cell; WBC, white blood cell.
Reduction in naive T cells was restricted to peripheral blood in Ampd3−/− mice
Ampd3 encodes the erythrocyte-specific isoform of AMPD. We investigated whether T-cell populations from lymphoid organs demonstrate a similar reduction in naive T cells as we observed in peripheral blood T cells. In contrast to the reduction in CD4+ and CD8+ naive T-cell populations in the peripheral blood of Ampd3−/− mice, flow cytometry data showed that the populations of CD4+ and CD8+ CD62LhiCD44lo naive T cells were not affected by Ampd3 deficiency in the spleen and lymph nodes compared with wild-type mice (Figure 4), suggesting that reductions in CD62LhiCD44lo naive CD4+ and CD62LhiCD44lo naive CD8+ T-cell populations are confined to T cells circulating in the peripheral blood.

Reduction in Ampd3−/− naive T cells is restricted to peripheral blood. (A) Percentages of naive CD4+ T cells and naive CD8+ T cells in blood, lymph node (LN), and spleen (n = 3 and n = 4 for Ampd3+/+ and Ampd3−/−, respectively). (B) Representative flow cytometry analysis of CD62L and CD44 expression of CD4+ T cells from different tissues. ***P ≤ .001. ns, not significant (P < .05).
Reduction in Ampd3−/− naive T cells is restricted to peripheral blood. (A) Percentages of naive CD4+ T cells and naive CD8+ T cells in blood, lymph node (LN), and spleen (n = 3 and n = 4 for Ampd3+/+ and Ampd3−/−, respectively). (B) Representative flow cytometry analysis of CD62L and CD44 expression of CD4+ T cells from different tissues. ***P ≤ .001. ns, not significant (P < .05).
Different phenotypic manifestations of naive T cells in the blood and the secondary lymphoid organs of the same animal strongly imply that the reduction in naive T cells in peripheral blood is caused by non–cell autonomous factors. To test this, we injected purified CD45.1+ T cells into CD45.2+Ampd3−/− mice and CD45.2+Ampd3+/+ mice. Four days after the T-cell transfer, blood samples were collected and analyzed by flow cytometry to determine the percentages of CD62LhiCD44lo naive T cells of the CD45.1+ donor and the CD45.2+ host. Our data show that the percentage of CD45.1+ donor CD62LhiCD44lo naive T cells was similar to that of the CD45.2+ host. CD45.1+ CD8+ naive T cells and CD45.1+ CD4+ T cells were detected at lower percentages when transferred into CD45.2+Ampd3−/− hosts than when transferred into CD45.2+ wild-type hosts (Figure 5A).

Reduction in Ampd3−/− naive T cells is triggered by T-cell–extrinsic factor(s). (A) Donor CD45.1+ T cells were transferred into CD45.2+Ampd3+/+ and Ampd3−/− hosts. The percentages of naive CD4+ and naive CD8+ T cells of transferred CD45.1+ donors and CD45.2+ hosts are shown (n = 4 for wild-type and Ampd3−/− hosts). (B) Packed red blood cells (RBC) from wild-type mice and Ampd3−/− mice were transfused into CD45.1+ hosts. Percentages of CD45.1+ naive CD4+ T cells and naive CD8+ T cells were analyzed by flow cytometry. (C) MFI of CD44 and CD62L of host CD4+ and CD8+ T cells after receiving blood transfusion. (D) The same groups of mice were analyzed again 40 days after the final transfusion (n = 4 and n = 5 for hosts receiving wild-type and Ampd3−/− red blood cells, respectively). ***P ≤ .001. ns, not significant (P > .05).
Reduction in Ampd3−/− naive T cells is triggered by T-cell–extrinsic factor(s). (A) Donor CD45.1+ T cells were transferred into CD45.2+Ampd3+/+ and Ampd3−/− hosts. The percentages of naive CD4+ and naive CD8+ T cells of transferred CD45.1+ donors and CD45.2+ hosts are shown (n = 4 for wild-type and Ampd3−/− hosts). (B) Packed red blood cells (RBC) from wild-type mice and Ampd3−/− mice were transfused into CD45.1+ hosts. Percentages of CD45.1+ naive CD4+ T cells and naive CD8+ T cells were analyzed by flow cytometry. (C) MFI of CD44 and CD62L of host CD4+ and CD8+ T cells after receiving blood transfusion. (D) The same groups of mice were analyzed again 40 days after the final transfusion (n = 4 and n = 5 for hosts receiving wild-type and Ampd3−/− red blood cells, respectively). ***P ≤ .001. ns, not significant (P > .05).
In a blood-transfusion experiment, packed red cells purified from CD45.2+Ampd3−/− mice or wild-type mice were injected into CD45.1+ wild-type hosts. Each mouse received 0.5 mL of packed red blood cells weekly. After 2 transfusions, blood samples were collected from the hosts and analyzed by flow cytometry. Our data show that transfusion of packed wild-type red blood cells did not alter the CD45.1+ population of CD3+, total CD4+, or total CD8+ T cells in hosts. However, the hosts receiving Ampd3−/− red blood cells showed significantly smaller populations of CD45.1+ CD62LhiCD44lo CD4+ T cells and CD62LhiCD44lo CD8+ T cells compared with hosts receiving wild-type red blood cells (Figure 5B). For CD45.1+ CD4+ and CD8+ T cells, CD62L MFI decreased, whereas CD44 MFI was not altered (Figure 5C), which closely resembled the phenotype of peripheral blood CD4+ and CD8+ T cells in Ampd3-knockout mice. The normal life span of circulating mouse red blood cells was reported to be ∼40 days.29 Forty days after the last transfusion, blood samples were again collected from the hosts. Flow cytometry analysis showed that the reduction in CD45.1+ peripheral blood naive CD4+ and CD8+ T cells in hosts receiving Ampd3−/− red blood cells was reversed after this period (Figure 5D).
Taken together, these data demonstrate that reduction in naive T cells in Ampd3-deficient mice is confined to the peripheral blood and is caused by T-cell–extrinsic factors determined by erythrocytes or their products.
Extracellular ATP triggered lower CD62L expression on CD4+ and CD8+ T cells
AMPD3 catalyzes the conversion of AMP to IMP in red blood cells. Therefore, deficiency in AMPD3 catalytic function would be expected to lead to lower levels of IMP. To examine whether IMP deficiency is responsible for the reduction in naive T cells in peripheral blood of Ampd3−/− mice, we administered IMP to Ampd3−/− mice and control mice for 2 weeks via 2 daily intraperitoneal injections.25 Measurement of naive T-cell populations by flow cytometry did not show any reversion of the reduction in naive T cells in Ampd3−/− mice (Figure 6A), suggesting that IMP deficiency is not the cause of the phenotype.
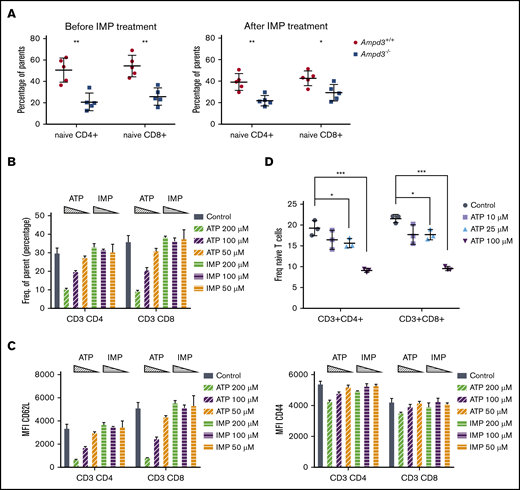
Extracellular ATP triggers reduction of CD62L on CD4 and CD8 T-cell surfaces. (A) IMP was injected into Ampd3−/− and control mice, and the percentages of naive CD4+ and CD8+ T cells in peripheral blood were analyzed by flow cytometry before and after the treatment (n = 5 for each genotype). (B) Different doses of ATP or IMP were added to the media of in vitro–cultured T cells (Control = nothing added). After overnight culture, the percentages of CD62LhiCD44lo naive CD4+ T cells and naive CD8+ T cells were analyzed by flow cytometry (n = 3 for each condition). (C) MFI of CD62L and CD44 of T cells. (D) Percentages of CD62LhiCD44lo naive CD4+ T cells and naive CD8+ T cells after mouse splenocytes were cultured in vitro with lower doses of ATP (n = 3 for each condition). *P ≤ .05, **P ≤ .01, ***P ≤ .001. ns, not significant (P > .05).
Extracellular ATP triggers reduction of CD62L on CD4 and CD8 T-cell surfaces. (A) IMP was injected into Ampd3−/− and control mice, and the percentages of naive CD4+ and CD8+ T cells in peripheral blood were analyzed by flow cytometry before and after the treatment (n = 5 for each genotype). (B) Different doses of ATP or IMP were added to the media of in vitro–cultured T cells (Control = nothing added). After overnight culture, the percentages of CD62LhiCD44lo naive CD4+ T cells and naive CD8+ T cells were analyzed by flow cytometry (n = 3 for each condition). (C) MFI of CD62L and CD44 of T cells. (D) Percentages of CD62LhiCD44lo naive CD4+ T cells and naive CD8+ T cells after mouse splenocytes were cultured in vitro with lower doses of ATP (n = 3 for each condition). *P ≤ .05, **P ≤ .01, ***P ≤ .001. ns, not significant (P > .05).
AMPD3 plays a direct role in maintaining the balance of intracellular adenosine nucleotides by regulating the key step in purine metabolism: converting AMP to IMP to maintain the proper ATP/AMP ratio.30 The fact that transfusion of erythrocytes from Ampd3-deficient donors could trigger a reduction in peripheral blood naive T cells in wild-type mice strongly suggests that Ampd3-deficient erythrocytes possess factor(s) that can affect the surface presentation of CD62L in cocompartmentalized T cells. It has been well established that Ampd3 deficiency leads to higher erythrocyte ATP concentrations in humans and mice.8,11,12 We also detected increased ATP content in the serum of Ampd3−/− mice compared with wild-type mice (supplemental Figure 3). We hypothesized that abnormally high plasma ATP concentrations might be responsible for the observed T-cell phenotype in Ampd3-deficient mice. To test this hypothesis, we purified T cells from the spleens of wild-type mice for in vitro culture and incubated them with different amounts of ATP. After overnight culture, expression of CD62L and CD44 was examined by flow cytometry. Addition of ATP to culture media led to a reduction in CD62LhiCD44lo CD4+ T cells and CD62LhiCD44lo CD8+ T cells in a dose-dependent manner, whereas addition of IMP did not affect CD4+ or CD8+ naive T-cell populations (Figure 6B). Addition of ATP clearly lowered CD62L MFI of CD4+ and CD8+ populations, but it had less of an effect on CD44 MFI (Figure 6C), suggesting that extracellular ATP triggers shedding of CD62L but not T-cell activation. Because this concentration of ATP is much higher than physiological levels, we further examined the threshold concentration for ATP to induce shedding of CD62L. We found that 25 µM ATP is the lowest dose that is able to clearly induce shedding of CD62L from CD4+ and CD8+ T cells in our in vitro culture conditions (Figure 6D).
Shedding of CD62L from the cell surface is primarily catalyzed by a disintegrin and metalloproteinase 17 (ADAM17).31,32 ADAM17 functions as a sheddase in the release of a wide variety of membrane-anchored cytokines, receptors, and cell adhesion molecules, including CD62L.33-35 ADAM17 can be activated by numerous molecules, including ATP.36,37 We hypothesize that, in Ampd3-deficient mice, increased plasma ATP concentration stimulates ADAM17 activation on T cells, which then catalyzes the shedding of its substrates, such as CD62L, from CD4+ and CD8+ T-cell surfaces (Figure 7A). ADAM17 has also been identified as a sheddase for tumor necrosis factor receptor 1 (TNFR1). We examined whether Ampd3 deficiency affects Tnfr1 expression on CD4+ and CD8+ T cells. Surface TNFR1 presentation is lower in Ampd3−/− T cells, as shown by a decrease in TNFR1 MFI in Ampd3-knockout mice (Figure 7B). Accordingly, soluble TNFR1 levels were found to be higher in the serum of Ampd3−/− mice compared with wild-type mice (Figure 7C). These data support our speculation that an increase in ADAM17 catalytic activity in Ampd3-deficient mice, which could be the result of increased plasma ATP concentration, may be responsible for the lower levels of surface CD62L in the peripheral blood T cells of Ampd3−/− mice.
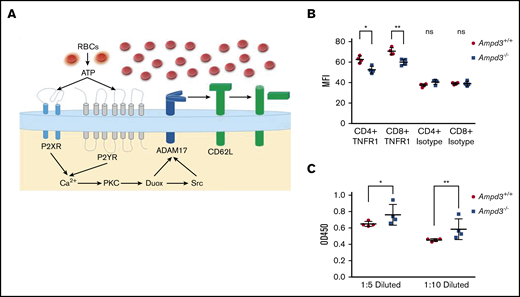
AMPD3 may affect ADAM17 activity to cause T-cell phenotypes. (A) Hypothesis: Erythrocytes release ATP through a nonlytic pathway or intravascular hemolysis. Increased ATP content in Ampd3−/− mouse serum activates Adam17, which triggers shedding of its substrates, including CD62L, from the T-cell surface. (B) MFI of TNFR1 on the surface of CD4+ and CD8+ T cells, as determined by flow cytometry; isotype antibody was used as control (n = 4 for Ampd3−/− and wild-type). (C) Abundance of soluble TNFR1 was determined by ELISA from 2 dilutions of mice serum (n = 4 for wild-type and Ampd3−/− mice). *P ≤ .05, **P ≤ .01. ns, not significant (P > .05); OD450, optical density at 450 nm.
AMPD3 may affect ADAM17 activity to cause T-cell phenotypes. (A) Hypothesis: Erythrocytes release ATP through a nonlytic pathway or intravascular hemolysis. Increased ATP content in Ampd3−/− mouse serum activates Adam17, which triggers shedding of its substrates, including CD62L, from the T-cell surface. (B) MFI of TNFR1 on the surface of CD4+ and CD8+ T cells, as determined by flow cytometry; isotype antibody was used as control (n = 4 for Ampd3−/− and wild-type). (C) Abundance of soluble TNFR1 was determined by ELISA from 2 dilutions of mice serum (n = 4 for wild-type and Ampd3−/− mice). *P ≤ .05, **P ≤ .01. ns, not significant (P > .05); OD450, optical density at 450 nm.
Discussion
AMPDs are a family of enzymes involved in purine metabolism, catalyzing the hydrolytic deamination of AMP to IMP. Ampd3 is the main isoform of AMPD expressed in erythrocytes. In the present study, we used a forward genetic screen in mice to identify Ampd3 mutants that affect naive T-cell populations in peripheral blood. Using Ampd3-knockout mice generated by clustered regularly interspaced short palindromic repeats/Cas9 targeting, we have shown that Ampd3 deficiency caused shedding of CD62L from CD4+ and CD8+ naive T cells without affecting expression of the T-cell activation marker CD44. This phenotype is restricted to T cells in the peripheral blood and is not seen in secondary lymphoid organs, such as the lymph nodes or spleen. T-lymphocyte homeostasis is a dynamic process, and it is highly regulated by a variety of surface receptors and their respective ligands.17-20 There have been reports that, in addition to their canonical function in oxygen and CO2 transport, erythrocytes can modulate T-cell growth and survival through several mechanisms.38-41 Our study provides a new example of how erythrocytes can influence T-lymphocyte homeostasis, demonstrating that changes in erythrocytes as a result of deficiency in the erythrocyte-specific isoform of Ampd3 can influence surface expression of the homing marker CD62L on T cells.
Results from our T-cell– and erythrocyte-transfer experiments demonstrate that the loss of naive T cells in peripheral blood from Ampd3−/− mice is a non–cell autonomous phenotype, attributable to changes in Ampd3-deficient erythrocytes. Increased ATP content in erythrocytes is observed in Ampd3-deficient mice, and we hypothesized that once released into the plasma by lysis or transient breaches in plasma membrane integrity, this ATP is sensed by T cells via P2X or P2Y receptors and causes accelerated shedding of the CD62L surface marker through the activation of ADAM17 (Figure 7A). This hypothesis is supported by our data from T cells cultured in ATP-containing media, in which extracellular ATP triggered lower surface levels of CD62L in a dose-dependent manner.
ATP is an important extracellular messenger, serving as molecular signature of damage during the inflammatory response, and it is also thought to modulate host-tumor interactions and responses to allografts.42,43 Erythrocytes can release ATP into plasma via a nonlytic pathway or via intravascular hemolysis under specific circumstances.44,45 Although intracellular levels of ATP could reach millimolar concentrations, the extracellular ATP concentration in plasma is maintained at 2 or 3 magnitudes of order lower by ectonucleotidases, such as CD39 and CD73. Extracellular ATP has previously been linked to inducing shedding of CD62L from the cell surface.6,46-49 In the present study, the plasma ATP concentration in Ampd3−/− mice was determined to be ∼15 µM (supplemental Figure 3), slightly lower than the tested minimal ATP (25 µM) capable of inducing CD62L shedding from CD4+ and CD8+ T cells in vitro. However, in physiological settings, the local concentration of extracellular ATP would depend on the distance from the source of the ATP release because of the hydrolytic function of ectonucleotidases, with higher concentrations being in close vicinity to erythrocytes releasing ATP. Because ATP induces CD62L shedding in a dose-dependent manner, more ATP release by Ampd3−/− erythrocytes can further trigger CD62L shedding. ATP-induced shedding of CD62L from lymphocytes is dependent on ADAM17.36 We hypothesize that ADAM17 is more activated in the peripheral blood from Ampd3-knockout mice than from wild-type mice. ADAM17 is a membrane-bound metalloprotease that cleaves cell surface proteins, such as cytokines, cytokine receptors, and adhesion proteins. TNFR1 is a known substrate of ADAM17.33 The static elevation in soluble TNFR1 concentration in serum from Ampd3-knockout mice supports the notion that ADAM17 is more active in Ampd3−/− mice.
AMPD3 deficiency has been reported in humans, but it is not associated with any known clinical symptoms.8,10 In our experiments, Ampd3-deficient mice show a normal complete blood count and a normal response to rSFV-β-Gal antigen. However, we observed a slight, but consistent, attenuated antibody response to OVA/alum immunization by Ampd3-deficient mice. ADAM17 has been implicated in regulating an adaptive immune response.50 ADAM17 can negatively regulate humoral responses, which might explain the attenuated immune response to OVA by Ampd3-deficient mice. This observation calls for a more thorough evaluation of the effects of human AMPD3 deficiency, specifically in naive T-cell populations, and the ability to mount antibody responses to infection and immunization.
For original data, please contact Xiaoming Zhan (xiaoming.zhan@utsouthwestern.edu).
Acknowledgments
The authors thank Aijie Liu for technical support.
This work was supported by grants from the National Institutes of Health, National Institute of Allergy and Infectious Diseases (R01-AI125581 and U19-AI100627) (B.B.).
Authorship
Contribution: X. Zhan and B.B designed research and analyzed data; X. Zhan, X. Zhong, J.H.C., J.W., and E.N.-G. performed research; P.A., X.L., M.T., J.R., and S.L. provided animal resources; L.S. performed protein structural analyses; and X. Zhan, T.G., and B.B. wrote the manuscript.
Conflict-of-interest disclosure: The authors declare no competing financial interests.
Correspondence: Bruce Beutler, UT Southwestern Medical Center, 6000 Harry Hines Blvd, NBP.202, Dallas, TX 75390; e-mail: bruce.beutler@utsouthwestern.edu; and Xiaoming Zhan, UT Southwestern Medical Center, 6000 Harry Hines Blvd, NBP.202, Dallas, TX 75390; e-mail: xiaoming.zhan@utsouthwestern.edu.

